A thermocouple, also known as a "thermoelectrical thermometer", is an electrical device consisting of two dissimilar electrical conductors forming an electrical junction. A thermocouple produces a temperature-dependent voltage as a result of the Seebeck effect, and this voltage can be interpreted to measure temperature. Thermocouples are widely used as temperature sensors.
Six Sigma (6σ) is a set of techniques and tools for process improvement. It was introduced by American engineer Bill Smith while working at Motorola in 1986.

A ball grid array (BGA) is a type of surface-mount packaging used for integrated circuits. BGA packages are used to permanently mount devices such as microprocessors. A BGA can provide more interconnection pins than can be put on a dual in-line or flat package. The whole bottom surface of the device can be used, instead of just the perimeter. The traces connecting the package's leads to the wires or balls which connect the die to package are also on average shorter than with a perimeter-only type, leading to better performance at high speeds.

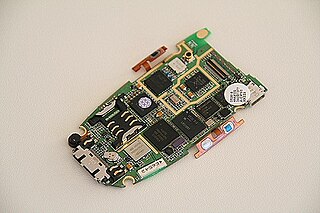
Surface-mount technology (SMT), originally called planar mounting, is a method in which the electrical components are mounted directly onto the surface of a printed circuit board (PCB). An electrical component mounted in this manner is referred to as a surface-mount device (SMD). In industry, this approach has largely replaced through-hole technology construction method of fitting components, in large part because SMT allows for increased manufacturing automation which reduces cost and improves quality. It also allows for more components to fit on a given area of substrate. Both technologies can be used on the same board, with the through-hole technology often used for components not suitable for surface mounting such as large transformers and heat-sinked power semiconductors.

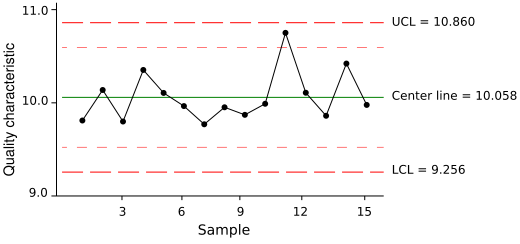
Control charts are graphical plots used in production control to determine whether quality and manufacturing processes are being controlled under stable conditions. The hourly status is arranged on the graph, and the occurrence of abnormalities is judged based on the presence of data that differs from the conventional trend or deviates from the control limit line. Control charts are classified into Shewhart individuals control chart and CUSUM(CUsUM)(or cumulative sum control chart)(ISO 7870-4).

Engineering tolerance is the permissible limit or limits of variation in:
- a physical dimension;
- a measured value or physical property of a material, manufactured object, system, or service;
- other measured values ;
- in engineering and safety, a physical distance or space (tolerance), as in a truck (lorry), train or boat under a bridge as well as a train in a tunnel ;
- in mechanical engineering, the space between a bolt and a nut or a hole, etc.

Statistical process control (SPC) or statistical quality control (SQC) is the application of statistical methods to monitor and control the quality of a production process. This helps to ensure that the process operates efficiently, producing more specification-conforming products with less waste scrap. SPC can be applied to any process where the "conforming product" output can be measured. Key tools used in SPC include run charts, control charts, a focus on continuous improvement, and the design of experiments. An example of a process where SPC is applied is manufacturing lines.

A reflow oven is a machine used primarily for reflow soldering of surface mount electronic components to printed circuit boards (PCBs).

Wave soldering is a bulk soldering process used in printed circuit board manufacturing. The circuit board is passed over a pan of molten solder in which a pump produces an upwelling of solder that looks like a standing wave. As the circuit board makes contact with this wave, the components become soldered to the board. Wave soldering is used for both through-hole printed circuit assemblies, and surface mount. In the latter case, the components are glued onto the surface of a printed circuit board (PCB) by placement equipment, before being run through the molten solder wave. Wave soldering is mainly used in soldering of through hole components.

Reflow soldering is a process in which a solder paste is used to temporarily attach anywhere from one to thousands of tiny electrical components to their contact pads, after which the entire assembly is subjected to controlled heat. The solder paste reflows in a molten state, creating permanent solder joints. Heating may be accomplished by passing the assembly through a reflow oven, under an infrared lamp, or by soldering individual joints with a hot air pencil.
In electronics, rework is repair or refinish of a printed circuit board (PCB) assembly, usually involving desoldering and re-soldering of surface-mounted electronic components (SMD). Mass processing techniques are not applicable to single device repair or replacement, and specialized manual techniques by expert personnel using appropriate equipment are required to replace defective components; area array packages such as ball grid array (BGA) devices particularly require expertise and appropriate tools. A hot air gun or hot air station is used to heat devices and melt solder, and specialised tools are used to pick up and position often tiny components. A rework station is a place to do this work—the tools and supplies for this work, typically on a workbench. Other kinds of rework require other tools.
The process capability is a measurable property of a process to the specification, expressed as a process capability index or as a process performance index. The output of this measurement is often illustrated by a histogram and calculations that predict how many parts will be produced out of specification (OOS).
The process capability index, or process capability ratio, is a statistical measure of process capability: the ability of an engineering process to produce an output within specification limits. The concept of process capability only holds meaning for processes that are in a state of statistical control. This means it cannot account for deviations which are not expected, such as misaligned, damaged, or worn equipment. Process capability indices measure how much "natural variation" a process experiences relative to its specification limits, and allows different processes to be compared to how well an organization controls them. Somewhat counterintuitively, higher index values indicate better performance, with zero indicating high deviation.

Selective soldering is the process of selectively soldering components to printed circuit boards and molded modules that could be damaged by the heat of a reflow oven or wave soldering in a traditional surface-mount technology (SMT) or through-hole technology assembly processes. This usually follows an SMT oven reflow process; parts to be selectively soldered are usually surrounded by parts that have been previously soldered in a surface-mount reflow process, and the selective-solder process must be sufficiently precise to avoid damaging them.

Flat no-leads packages such as quad-flat no-leads (QFN) and dual-flat no-leads (DFN) physically and electrically connect integrated circuits to printed circuit boards. Flat no-leads, also known as micro leadframe (MLF) and SON, is a surface-mount technology, one of several package technologies that connect ICs to the surfaces of PCBs without through-holes. Flat no-lead is a near chip scale plastic encapsulated package made with a planar copper lead frame substrate. Perimeter lands on the package bottom provide electrical connections to the PCB. Flat no-lead packages usually, but not always, include an exposed thermally conductive pad to improve heat transfer out of the IC. Heat transfer can be further facilitated by metal vias in the thermal pad. The QFN package is similar to the quad-flat package (QFP), and a ball grid array (BGA).
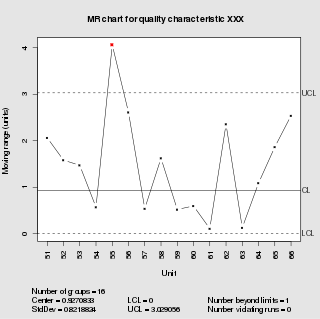
In statistical quality control, the individual/moving-range chart is a type of control chart used to monitor variables data from a business or industrial process for which it is impractical to use rational subgroups.
Laboratory quality control is designed to detect, reduce, and correct deficiencies in a laboratory's internal analytical process prior to the release of patient results, in order to improve the quality of the results reported by the laboratory. Quality control (QC) is a measure of precision, or how well the measurement system reproduces the same result over time and under varying operating conditions. Laboratory quality control material is usually run at the beginning of each shift, after an instrument is serviced, when reagent lots are changed, after equipment calibration, and whenever patient results seem inappropriate. Quality control material should approximate the same matrix as patient specimens, taking into account properties such as viscosity, turbidity, composition, and color. IIt should be stable for long periods of time, and available in large enough quantities for a single batch to last at least one year. Liquid controls are more convenient than lyophilized (freeze-dried) controls because they do not have to be reconstituted, minimizing pipetting error. Dried Tube Specimen (DTS) is slightly cumbersome as a QC material but it is very low-cost, stable over long periods and efficient, especially useful for resource-restricted settings in under-developed and developing countries. DTS can be manufactured in-house by a laboratory or Blood Bank for its use.

A thermal profile is a complex set of time-temperature data typically associated with the measurement of thermal temperatures in an oven. The thermal profile is often measured along a variety of dimensions such as slope, soak, time above liquidus (TAL), and peak.

Graping is a phenomenon marked by the appearance of unreflowed solder particles on top of the solder mass. The solder that is partially coalesced resembles a cluster of grapes, hence the derivation of the phenomenon’s name.
Stencil printing is the process of depositing solder paste on the printed wiring boards (PWBs) to establish electrical connections. It is immediately followed by the component placement stage. The equipment and materials used in this stage are a stencil, solder paste, and a printer.