Related Research Articles

In chemistry, a heteroatom is, strictly, any atom that is not carbon or hydrogen.
The Protein Data Bank (PDB) is a database for the three-dimensional structural data of large biological molecules such as proteins and nucleic acids, which is overseen by the Worldwide Protein Data Bank (wwPDB). These structural data are obtained and deposited by biologists and biochemists worldwide through the use of experimental methodologies such as X-ray crystallography, NMR spectroscopy, and, increasingly, cryo-electron microscopy. All submitted data are reviewed by expert biocurators and, once approved, are made freely available on the Internet under the CC0 Public Domain Dedication. Global access to the data is provided by the websites of the wwPDB member organisations.

Structural bioinformatics is the branch of bioinformatics that is related to the analysis and prediction of the three-dimensional structure of biological macromolecules such as proteins, RNA, and DNA. It deals with generalizations about macromolecular 3D structures such as comparisons of overall folds and local motifs, principles of molecular folding, evolution, binding interactions, and structure/function relationships, working both from experimentally solved structures and from computational models. The term structural has the same meaning as in structural biology, and structural bioinformatics can be seen as a part of computational structural biology. The main objective of structural bioinformatics is the creation of new methods of analysing and manipulating biological macromolecular data in order to solve problems in biology and generate new knowledge.
BioJava is an open-source software project dedicated to provide Java tools to process biological data. BioJava is a set of library functions written in the programming language Java for manipulating sequences, protein structures, file parsers, Common Object Request Broker Architecture (CORBA) interoperability, Distributed Annotation System (DAS), access to AceDB, dynamic programming, and simple statistical routines. BioJava supports a range of data, starting from DNA and protein sequences to the level of 3D protein structures. The BioJava libraries are useful for automating many daily and mundane bioinformatics tasks such as to parsing a Protein Data Bank (PDB) file, interacting with Jmol and many more. This application programming interface (API) provides various file parsers, data models and algorithms to facilitate working with the standard data formats and enables rapid application development and analysis.
The Biopython project is an open-source collection of non-commercial Python tools for computational biology and bioinformatics, created by an international association of developers. It contains classes to represent biological sequences and sequence annotations, and it is able to read and write to a variety of file formats. It also allows for a programmatic means of accessing online databases of biological information, such as those at NCBI. Separate modules extend Biopython's capabilities to sequence alignment, protein structure, population genetics, phylogenetics, sequence motifs, and machine learning. Biopython is one of a number of Bio* projects designed to reduce code duplication in computational biology.
A kinemage is an interactive graphic scientific illustration. It often is used to visualize molecules, especially proteins although it can also represent other types of 3-dimensional data. The kinemage system is designed to optimize ease of use, interactive performance, and the perception and communication of detailed 3D information. The kinemage information is stored in a text file, human- and machine-readable, that describes the hierarchy of display objects and their properties, and includes optional explanatory text. The kinemage format is a defined chemical MIME type of 'chemical/x-kinemage' with the file extension '.kin'.

In biochemistry, a Ramachandran plot, originally developed in 1963 by G. N. Ramachandran, C. Ramakrishnan, and V. Sasisekharan, is a way to visualize energetically allowed regions for backbone dihedral angles ψ against φ of amino acid residues in protein structure. The figure on the left illustrates the definition of the φ and ψ backbone dihedral angles. The ω angle at the peptide bond is normally 180°, since the partial-double-bond character keeps the peptide bond planar. The figure in the top right shows the allowed φ,ψ backbone conformational regions from the Ramachandran et al. 1963 and 1968 hard-sphere calculations: full radius in solid outline, reduced radius in dashed, and relaxed tau (N-Cα-C) angle in dotted lines. Because dihedral angle values are circular and 0° is the same as 360°, the edges of the Ramachandran plot "wrap" right-to-left and bottom-to-top. For instance, the small strip of allowed values along the lower-left edge of the plot are a continuation of the large, extended-chain region at upper left.

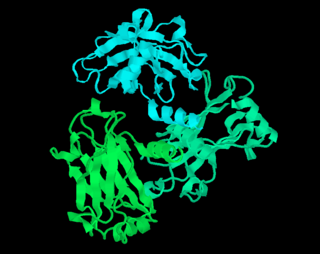
Protein structure is the three-dimensional arrangement of atoms in an amino acid-chain molecule. Proteins are polymers – specifically polypeptides – formed from sequences of amino acids, which are the monomers of the polymer. A single amino acid monomer may also be called a residue, which indicates a repeating unit of a polymer. Proteins form by amino acids undergoing condensation reactions, in which the amino acids lose one water molecule per reaction in order to attach to one another with a peptide bond. By convention, a chain under 30 amino acids is often identified as a peptide, rather than a protein. To be able to perform their biological function, proteins fold into one or more specific spatial conformations driven by a number of non-covalent interactions, such as hydrogen bonding, ionic interactions, Van der Waals forces, and hydrophobic packing. To understand the functions of proteins at a molecular level, it is often necessary to determine their three-dimensional structure. This is the topic of the scientific field of structural biology, which employs techniques such as X-ray crystallography, NMR spectroscopy, cryo-electron microscopy (cryo-EM) and dual polarisation interferometry, to determine the structure of proteins.
A chemical file format is a type of data file which is used specifically for depicting molecular data. One of the most widely used is the chemical table file format, which is similar to Structure Data Format (SDF) files. They are text files that represent multiple chemical structure records and associated data fields. The XYZ file format is a simple format that usually gives the number of atoms in the first line, a comment on the second, followed by a number of lines with atomic symbols and cartesian coordinates. The Protein Data Bank Format is commonly used for proteins but is also used for other types of molecules. There are many other types which are detailed below. Various software systems are available to convert from one format to another.
RasMol is a computer program written for molecular graphics visualization intended and used mainly to depict and explore biological macromolecule structures, such as those found in the Protein Data Bank (PDB).

UCSF Chimera is an extensible program for interactive visualization and analysis of molecular structures and related data, including density maps, supramolecular assemblies, sequence alignments, docking results, trajectories, and conformational ensembles. High-quality images and movies can be created. Chimera includes complete documentation and can be downloaded free of charge for noncommercial use.
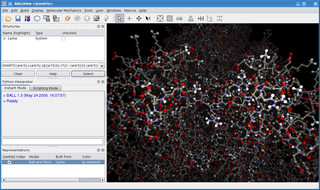
BALL is a C++ class framework and set of algorithms and data structures for molecular modelling and computational structural bioinformatics, a Python interface to this library, and a graphical user interface to BALL, the molecule viewer BALLView.
In chemistry, the Z-matrix is a way to represent a system built of atoms. A Z-matrix is also known as an internal coordinate representation. It provides a description of each atom in a molecule in terms of its atomic number, bond length, bond angle, and dihedral angle, the so-called internal coordinates, although it is not always the case that a Z-matrix will give information regarding bonding since the matrix itself is based on a series of vectors describing atomic orientations in space. However, it is convenient to write a Z-matrix in terms of bond lengths, angles, and dihedrals since this will preserve the actual bonding characteristics. The name arises because the Z-matrix assigns the second atom along the Z axis from the first atom, which is at the origin.
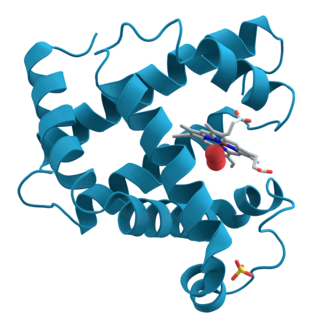
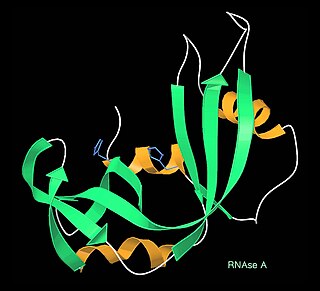
Ribbon diagrams, also known as Richardson diagrams, are 3D schematic representations of protein structure and are one of the most common methods of protein depiction used today. The ribbon depicts the general course and organisation of the protein backbone in 3D and serves as a visual framework for hanging details of the entire atomic structure, such as the balls for the oxygen atoms attached to myoglobin's active site in the adjacent figure. Ribbon diagrams are generated by interpolating a smooth curve through the polypeptide backbone. α-helices are shown as coiled ribbons or thick tubes, β-sheets as arrows, and non-repetitive coils or loops as lines or thin tubes. The direction of the polypeptide chain is shown locally by the arrows, and may be indicated overall by a colour ramp along the length of the ribbon.
In biology, a protein structure database is a database that is modeled around the various experimentally determined protein structures. The aim of most protein structure databases is to organize and annotate the protein structures, providing the biological community access to the experimental data in a useful way. Data included in protein structure databases often includes three-dimensional coordinates as well as experimental information, such as unit cell dimensions and angles for x-ray crystallography determined structures. Though most instances, in this case either proteins or a specific structure determinations of a protein, also contain sequence information and some databases even provide means for performing sequence based queries, the primary attribute of a structure database is structural information, whereas sequence databases focus on sequence information, and contain no structural information for the majority of entries. Protein structure databases are critical for many efforts in computational biology such as structure based drug design, both in developing the computational methods used and in providing a large experimental dataset used by some methods to provide insights about the function of a protein.
PDB may refer to:

The program Coot is used to display and manipulate atomic models of macromolecules, typically of proteins or nucleic acids, using 3D computer graphics. It is primarily focused on building and validation of atomic models into three-dimensional electron density maps obtained by X-ray crystallography methods, although it has also been applied to data from electron microscopy.

Macromolecular structure validation is the process of evaluating reliability for 3-dimensional atomic models of large biological molecules such as proteins and nucleic acids. These models, which provide 3D coordinates for each atom in the molecule, come from structural biology experiments such as x-ray crystallography or nuclear magnetic resonance (NMR). The validation has three aspects: 1) checking on the validity of the thousands to millions of measurements in the experiment; 2) checking how consistent the atomic model is with those experimental data; and 3) checking consistency of the model with known physical and chemical properties.
The Biological Magnetic Resonance Data Bank is an open access repository of nuclear magnetic resonance (NMR) spectroscopic data from peptides, proteins, nucleic acids and other biologically relevant molecules. The database is operated by the University of Wisconsin–Madison and is supported by the National Library of Medicine. The BMRB is part of the Research Collaboratory for Structural Bioinformatics and, since 2006, it is a partner in the Worldwide Protein Data Bank (wwPDB). The repository accepts NMR spectral data from laboratories around the world and, once the data is validated, it is available online at the BMRB website. The database has also an ftp site, where data can be downloaded in the bulk. The BMRB has two mirror sites, one at the Protein Database Japan (PDBj) at Osaka University and one at the Magnetic Resonance Research Center (CERM) at the University of Florence in Italy. The site at Japan accepts and processes data depositions.

The Macromolecular Crystallographic Information File (mmCIF) also known as PDBx/mmCIF is a standard text file format for representing macromolecular structure data, developed by the International Union of Crystallography (IUCr) and the Protein Data Bank It is an extension of the Crystallographic Information File (CIF), specifically for macromolecular data, such as proteins and nucleic acids, incorporating elements from the PDB file format.
References
- ↑ Berman, Helen M.; Kleywegt, Gerard J.; Nakamura, Haruki; Markley, John L. (2014-10-01). "The Protein Data Bank archive as an open data resource". Journal of Computer-Aided Molecular Design. 28 (10): 1009–1014. doi:10.1007/s10822-014-9770-y. ISSN 1573-4951. PMC 4196035 . PMID 25062767.
- ↑ "wwPDB: File Format". www.wwpdb.org.
- ↑ "PROTEIN DATABASE FILE RECORD FORMATS" (PDF). Retrieved 9 June 2024.
- ↑ "PROTEIN DATABASE FILE RECORD FORMATS" (PDF). Retrieved 9 June 2024.
- ↑ Berman, Helen M (2008). "The Protein Data Bank: a historical perspective". Acta Crystallographica. 64 (Pt 1): 88–95. doi: 10.1107/S0108767307035623 . ISSN 2053-2733. PMID 18156675.
- ↑ "wwPDB: File Formats and the PDB". Protein Data Bank . Retrieved 2024-01-15.
- ↑ "wwPDB Format version 3.3: Coordinate Section". Archived from the original on 2012-02-28. Retrieved 2012-03-23.