Related Research Articles
Econometrics is an application of statistical methods to economic data in order to give empirical content to economic relationships. More precisely, it is "the quantitative analysis of actual economic phenomena based on the concurrent development of theory and observation, related by appropriate methods of inference." An introductory economics textbook describes econometrics as allowing economists "to sift through mountains of data to extract simple relationships." Jan Tinbergen is one of the two founding fathers of econometrics. The other, Ragnar Frisch, also coined the term in the sense in which it is used today.

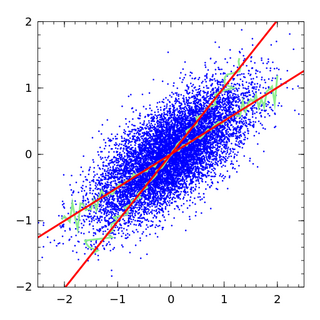
In statistics, correlation or dependence is any statistical relationship, whether causal or not, between two random variables or bivariate data. Although in the broadest sense, "correlation" may indicate any type of association, in statistics it usually refers to the degree to which a pair of variables are linearly related. Familiar examples of dependent phenomena include the correlation between the height of parents and their offspring, and the correlation between the price of a good and the quantity the consumers are willing to purchase, as it is depicted in the so-called demand curve.

In statistics, a spurious relationship or spurious correlation is a mathematical relationship in which two or more events or variables are associated but not causally related, due to either coincidence or the presence of a certain third, unseen factor.

In statistical modeling, regression analysis is a set of statistical processes for estimating the relationships between a dependent variable and one or more independent variables. The most common form of regression analysis is linear regression, in which one finds the line that most closely fits the data according to a specific mathematical criterion. For example, the method of ordinary least squares computes the unique line that minimizes the sum of squared differences between the true data and that line. For specific mathematical reasons, this allows the researcher to estimate the conditional expectation of the dependent variable when the independent variables take on a given set of values. Less common forms of regression use slightly different procedures to estimate alternative location parameters or estimate the conditional expectation across a broader collection of non-linear models.
SUDAAN is a proprietary statistical software package for the analysis of correlated data, including correlated data encountered in complex sample surveys. SUDAAN originated in 1972 at RTI International. Individual commercial licenses are sold for $1,460 a year, or $3,450 permanently.
In statistics, the coefficient of multiple correlation is a measure of how well a given variable can be predicted using a linear function of a set of other variables. It is the correlation between the variable's values and the best predictions that can be computed linearly from the predictive variables.
In statistics, multicollinearity or collinearity is a situation where the predictors in a regression model are linearly dependent.

In statistics, the coefficient of determination, denoted R2 or r2 and pronounced "R squared", is the proportion of the variation in the dependent variable that is predictable from the independent variable(s).
Cointegration is a statistical property of a collection (X1, X2, ..., Xk) of time series variables. First, all of the series must be integrated of order d (see Order of integration). Next, if a linear combination of this collection is integrated of order less than d, then the collection is said to be co-integrated. Formally, if (X,Y,Z) are each integrated of order d, and there exist coefficients a,b,c such that aX + bY + cZ is integrated of order less than d, then X, Y, and Z are cointegrated. Cointegration has become an important property in contemporary time series analysis. Time series often have trends—either deterministic or stochastic. In an influential paper, Charles Nelson and Charles Plosser (1982) provided statistical evidence that many US macroeconomic time series (like GNP, wages, employment, etc.) have stochastic trends.

Regression dilution, also known as regression attenuation, is the biasing of the linear regression slope towards zero, caused by errors in the independent variable.
In statistics, canonical analysis (from Ancient Greek: κανων bar, measuring rod, ruler) belongs to the family of regression methods for data analysis. Regression analysis quantifies a relationship between a predictor variable and a criterion variable by the coefficient of correlation r, coefficient of determination r2, and the standard regression coefficient β. Multiple regression analysis expresses a relationship between a set of predictor variables and a single criterion variable by the multiple correlation R, multiple coefficient of determination R2, and a set of standard partial regression weights β1, β2, etc. Canonical variate analysis captures a relationship between a set of predictor variables and a set of criterion variables by the canonical correlations ρ1, ρ2, ..., and by the sets of canonical weights C and D.
In statistics, unit-weighted regression is a simplified and robust version of multiple regression analysis where only the intercept term is estimated. That is, it fits a model
Cochrane–Orcutt estimation is a procedure in econometrics, which adjusts a linear model for serial correlation in the error term. Developed in the 1940s, it is named after statisticians Donald Cochrane and Guy Orcutt.
Multilevel models are statistical models of parameters that vary at more than one level. An example could be a model of student performance that contains measures for individual students as well as measures for classrooms within which the students are grouped. These models can be seen as generalizations of linear models, although they can also extend to non-linear models. These models became much more popular after sufficient computing power and software became available.
In statistics, standardized (regression) coefficients, also called beta coefficients or beta weights, are the estimates resulting from a regression analysis where the underlying data have been standardized so that the variances of dependent and independent variables are equal to 1. Therefore, standardized coefficients are unitless and refer to how many standard deviations a dependent variable will change, per standard deviation increase in the predictor variable.

In statistics, least-angle regression (LARS) is an algorithm for fitting linear regression models to high-dimensional data, developed by Bradley Efron, Trevor Hastie, Iain Johnstone and Robert Tibshirani.
Causal inference is the process of determining the independent, actual effect of a particular phenomenon that is a component of a larger system. The main difference between causal inference and inference of association is that causal inference analyzes the response of an effect variable when a cause of the effect variable is changed. The study of why things occur is called etiology, and can be described using the language of scientific causal notation. Causal inference is said to provide the evidence of causality theorized by causal reasoning.
In mathematics and empirical science, quantification is the act of counting and measuring that maps human sense observations and experiences into quantities. Quantification in this sense is fundamental to the scientific method.
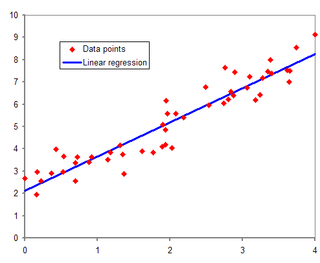
In statistics, linear regression is a statistical model which estimates the linear relationship between a scalar response and one or more explanatory variables. The case of one explanatory variable is called simple linear regression; for more than one, the process is called multiple linear regression. This term is distinct from multivariate linear regression, where multiple correlated dependent variables are predicted, rather than a single scalar variable. If the explanatory variables are measured with error then errors-in-variables models are required, also known as measurement error models.

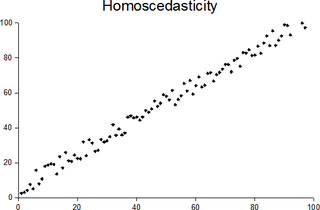
In statistics, a sequence of random variables is homoscedastic if all its random variables have the same finite variance; this is also known as homogeneity of variance. The complementary notion is called heteroscedasticity, also known as heterogeneity of variance. The spellings homoskedasticity and heteroskedasticity are also frequently used. Skedasticity comes from the Ancient Greek word skedánnymi, meaning “to scatter”. Assuming a variable is homoscedastic when in reality it is heteroscedastic results in unbiased but inefficient point estimates and in biased estimates of standard errors, and may result in overestimating the goodness of fit as measured by the Pearson coefficient.
References
- ↑ Upton, G., Cook, I. (2002) Oxford Dictionary of Statistics. OUP ISBN 978-0-19-954145-4
- ↑ Mark R. Montgomery, Michele Gragnolati, Kathleen Burke, and Edmundo Paredes, Measuring Living Standards with Proxy Variables, Demography, Vol. 37 No. 2, pp. 155-174 (2000). (retrieved 9 Nov. 2015)
- ↑ Jim Frost, Proxy Variables: The Good Twin of Confounding Variables, 22 September 2011 (retrieved 9 Nov. 2015)
- Toutenburg, Helge; Götz Trenkler (1992). "Proxy variables and mean square error dominance in linear regression". Journal of Quantitative Economics. 8: 433–442.
- Stahlecker, Peter; Götz Trenkler (1993). "Some further results on the use of proxy variables in prediction". The Review of Economics and Statistics. 75 (4). The MIT Press: 707–711. doi:10.2307/2110026. JSTOR 2110026.
- Trenkler, Götz; Peter Stahlecker (1996). "Dropping variables versus use of proxy variables in linear regression". Journal of Statistical Planning and Inference. 50 (1). NORTH-HOLLAND: 65–75. doi:10.1016/0378-3758(95)00045-3.