Pythagorean expectation is a sports analytics formula devised by Bill James to estimate the percentage of games a baseball team "should" have won based on the number of runs they scored and allowed. Comparing a team's actual and Pythagorean winning percentage can be used to make predictions and evaluate which teams are over-performing and under-performing. The name comes from the formula's resemblance to the Pythagorean theorem.[1]
where Win Ratio is the winning ratio generated by the formula. The expected number of wins would be the expected winning ratio multiplied by the number of games played.
Empirical origin
Empirically, this formula correlates fairly well with how baseball teams actually perform. However, statisticians since the invention of this formula found it to have a fairly routine error, generally about three games off.
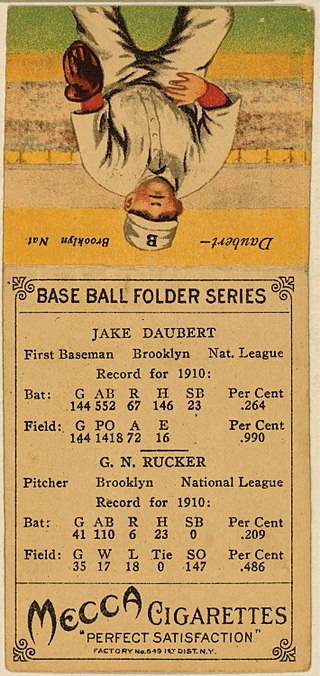
For example, the 2002 New York Yankees scored 897 runs and allowed 697 runs: according to James' original formula, the Yankees should have finished with a win percentage of .624.
Based on a 162-game season, the 2002 Yankees should have finished 101-61: they actually finished 103–58.[2]
In efforts to fix this routine error, statisticians have performed numerous searches to find the ideal exponent.
If using a single-number exponent, 1.83 is the most accurate, and is the one used by baseball-reference.com.[3] The updated formula therefore reads as follows:
He concluded that the exponent should be calculated from a given team based on the team's runs scored, runs allowed, and games. By not reducing the exponent to a single number for teams in any season, Davenport was able to report a 3.991 root-mean-square error as opposed to a 4.126 root-mean-square error for an exponent of 2.[4]
Less well known but equally (if not more) effective is the Pythagenpat formula, developed by David Smyth.[5]
Davenport expressed his support for this formula, saying:
After further review, I (Clay) have come to the conclusion that the so-called Smyth/Patriot method, aka Pythagenpat, is a better fit. In that, X=((rs+ra)/g)0.287, although there is some wiggle room for disagreement in the exponent. Anyway, that equation is simpler, more elegant, and gets the better answer over a wider range of runs scored than Pythagenport, including the mandatory value of 1 at 1rpg.[6]
These formulas are only necessary when dealing with extreme situations in which the average number of runs scored per game is either very high or very low. For most situations, simply squaring each variable yields accurate results.
There are some systematic statistical deviations between actual winning percentage and expected winning percentage, which include bullpen quality and luck. In addition, the formula tends to regress toward the mean, as teams that win a lot of games tend to be underrepresented by the formula (meaning they "should" have won fewer games), and teams that lose a lot of games tend to be overrepresented (they "should" have won more).
A notable example is the 2016 Texas Rangers, who beat their predicted record by 13 games, finishing 95-67 while having an expected win–loss record of 82-80.
"Second-order" and "third-order" wins
In their Adjusted Standings Report,[7]Baseball Prospectus refers to different "orders" of wins for a team. The basic order of wins is simply the number of games they have won. However, because a team's record may not reflect its true talent due to luck, different measures of a team's talent were developed.
First-order wins, based on pure run differential, are the number of expected wins generated by the "pythagenport" formula (see above). In addition, to further filter out the distortions of luck, Sabermetricians can also calculate a team's expected runs scored and allowed via a runs created-type equation (the most accurate at the team level being Base Runs). These formulas result in the team's expected number of runs given their offensive and defensive stats (total singles, doubles, walks, etc.), which helps to eliminate the luck factor of the order in which the team's hits and walks came within an inning. Using these stats, sabermetricians can calculate how many runs a team "should" have scored or allowed.
By plugging these expected runs scored and allowed into the pythagorean formula, one can generate second-order wins, the number of wins a team deserves based on the number of runs they should have scored and allowed given their component offensive and defensive statistics. Third-order wins are second-order wins that have been adjusted for strength of schedule (the quality of the opponent's pitching and hitting). Second- and third-order winning percentage has been shown[according to whom?] to predict future actual team winning percentage better than both actual winning percentage and first-order winning percentage.[citation needed]
Theoretical explanation
Initially the correlation between the formula and actual winning percentage was simply an experimental observation. In 2003, Hein Hundal provided an inexact derivation of the formula and showed that the Pythagorean exponent was approximately 2/(σ√π) where σ was the standard deviation of runs scored by all teams divided by the average number of runs scored.[8] In 2006, Professor Steven J. Miller provided a statistical derivation of the formula[9] under some assumptions about baseball games: if runs for each team follow a Weibull distribution and the runs scored and allowed per game are statistically independent, then the formula gives the probability of winning.[9]
More simply, the Pythagorean formula with exponent 2 follows immediately from two assumptions: that baseball teams win in proportion to their "quality", and that their "quality" is measured by the ratio of their runs scored to their runs allowed. For example, if Team A has scored 50 runs and allowed 40, its quality measure would be 50/40 or 1.25. The quality measure for its (collective) opponent team B, in the games played against A, would be 40/50 (since runs scored by A are runs allowed by B, and vice versa), or 0.8. If each team wins in proportion to its quality, A's probability of winning would be 1.25/(1.25+0.8), which equals 502/(502+402), the Pythagorean formula. The same relationship is true for any number of runs scored and allowed, as can be seen by writing the "quality" probability as [50/40] / [ 50/40+40/50], and clearing fractions.
The assumption that one measure of the quality of a team is given by the ratio of its runs scored to allowed is both natural and plausible; this is the formula by which individual victories (games) are determined. [There are other natural and plausible candidates for team quality measures, which, assuming a "quality" model, lead to corresponding winning percentage expectation formulas that are roughly as accurate as the Pythagorean ones.] The assumption that baseball teams win in proportion to their quality is not natural, but is plausible. It is not natural because the degree to which sports contestants win in proportion to their quality is dependent on the role that chance plays in the sport. If chance plays a very large role, then even a team with much higher quality than its opponents will win only a little more often than it loses. If chance plays very little role, then a team with only slightly higher quality than its opponents will win much more often than it loses. The latter is more the case in basketball, for various reasons, including that many more points are scored than in baseball (giving the team with higher quality more opportunities to demonstrate that quality, with correspondingly fewer opportunities for chance or luck to allow the lower-quality team to win.)
Baseball has just the right amount of chance in it to enable teams to win roughly in proportion to their quality, i.e. to produce a roughly Pythagorean result with exponent two. Basketball's higher exponent of around 14 (see below) is due to the smaller role that chance plays in basketball. The fact that the most accurate (constant) Pythagorean exponent for baseball is around 1.83, slightly less than 2, can be explained by the fact that there is (apparently) slightly more chance in baseball than would allow teams to win in precise proportion to their quality. Bill James realized this long ago when noting that an improvement in accuracy on his original Pythagorean formula with exponent two could be realized by simply adding some constant number to the numerator, and twice the constant to the denominator. This moves the result slightly closer to .500, which is what a slightly larger role for chance would do, and what using the exponent of 1.83 (or any positive exponent less than two) does as well. Various candidates for that constant can be tried to see what gives a "best fit" to real life data.
The fact that the most accurate exponent for baseball Pythagorean formulas is a variable that is dependent on the total runs per game is also explainable by the role of chance, since the more total runs scored, the less likely it is that the result will be due to chance, rather than to the higher quality of the winning team having been manifested during the scoring opportunities. The larger the exponent, the farther away from a .500 winning percentage is the result of the corresponding Pythagorean formula, which is the same effect that a decreased role of chance creates. The fact that accurate formulas for variable exponents yield larger exponents as the total runs per game increases is thus in agreement with an understanding of the role that chance plays in sports.
In his 1981 Baseball Abstract, James explicitly developed another of his formulas, called the log5 formula (which has since proven to be empirically accurate), using the notion of 2 teams having a face-to-face winning percentage against each other in proportion to a "quality" measure. His quality measure was half the team's "wins ratio" (or "odds of winning"). The wins ratio or odds of winning is the ratio of the team's wins against the league to its losses against the league. [James did not seem aware at the time that his quality measure was expressible in terms of the wins ratio. Since in the quality model any constant factor in a quality measure eventually cancels, the quality measure is today better taken as simply the wins ratio itself, rather than half of it.] He then stated that the Pythagorean formula, which he had earlier developed empirically, for predicting winning percentage from runs, was "the same thing" as the log5 formula, though without a convincing demonstration or proof. His purported demonstration that they were the same boiled down to showing that the two different formulas simplified to the same expression in a special case, which is itself treated vaguely, and there is no recognition that the special case is not the general one. Nor did he subsequently promulgate to the public any explicit, quality-based model for the Pythagorean formula. As of 2013, there is still little public awareness in the sabermetric community that a simple "teams win in proportion to quality" model, using the runs ratio as the quality measure, leads directly to James's original Pythagorean formula.
In the 1981 Abstract, James also says that he had first tried to create a "log5" formula by simply using the winning percentages of the teams in place of the runs in the Pythagorean formula, but that it did not give valid results. The reason, unknown to James at the time, is that his attempted formulation implies that the relative quality of teams is given by the ratio of their winning percentages. Yet this cannot be true if teams win in proportion to their quality, since a .900 team wins against its opponents, whose overall winning percentage is roughly .500, in a 9 to 1 ratio, rather than the 9 to 5 ratio of their .900 to .500 winning percentages. The empirical failure of his attempt led to his eventual, more circuitous (and ingenious) and successful approach to log5, which still used quality considerations, though without a full appreciation of the ultimate simplicity of the model and of its more general applicability and true structural similarity to his Pythagorean formula.
Use in basketball
American sports executive Daryl Morey was the first to adapt James' Pythagorean expectation to professional basketball while a researcher at STATS, Inc. He found that using 13.91 for the exponents provided an acceptable model for predicting won-lost percentages:
The formula is used with an exponent of 2.37 and gives a projected winning percentage. That winning percentage is then multiplied by 17 (for the number of games played in an NFL season from 2021), to give a projected number of wins. This projected number given by the equation is referred to as Pythagorean wins.
The 2011 edition of Football Outsiders Almanac[11] states, "From 1988 through 2004, 11 of 16 Super Bowls were won by the team that led the NFL in Pythagorean wins, while only seven were won by the team with the most actual victories. Super Bowl champions that led the league in Pythagorean wins but not actual wins include the 2004 Patriots, 2000 Ravens, 1999 Rams and 1997 Broncos."
Although Football Outsiders Almanac acknowledges that the formula had been less-successful in picking Super Bowl participants from 2005–2008, it reasserted itself in 2009 and 2010. Furthermore, "[t]he Pythagorean projection is also still a valuable predictor of year-to-year improvement. Teams that win a minimum of one full game more than their Pythagorean projection tend to regress the following year; teams that win a minimum of one full game less than their Pythagorean projection tend to improve the following year, particularly if they were at or above .500 despite their underachieving.
The 2022 Minnesota Vikings were a great outlier in this regard, going 13-4 despite having 8.4 Pythagorean wins.[12] Two years later, the 2024 Kansas City Chiefs surpassed this discrepancy by going 15-2 with a Pythagorean win total of 10.2 wins.[13]
Use in ice hockey
In 2013, statistician Kevin Dayaratna and mathematician Steven J. Miller provided theoretical justification for applying the Pythagorean Expectation to ice hockey. In particular, they found that by making the same assumptions that Miller made in his 2007 study about baseball, specifically that goals scored and goals allowed follow statistically independentWeibull distributions, that the Pythagorean Expectation works just as well for ice hockey as it does for baseball. The Dayaratna and Miller study verified the statistical legitimacy of making these assumptions and estimated the Pythagorean exponent for ice hockey to be slightly above 2.[14]
Baseball statistics include a variety of metrics used to evaluate player and team performance in the sport of baseball.
In baseball statistics, on-base percentage (OBP) measures how frequently a batter reaches base. An official Major League Baseball (MLB) statistic since 1984, it is sometimes referred to as on-base average (OBA), as it is rarely presented as a true percentage.
Sabermetrics is the original or blanket term for sports analytics in the US, the empirical analysis of baseball, especially the development of advanced metrics based on baseball statistics that measure in-game activity. The term is derived from the movement's progenitors, members of the Society for American Baseball Research (SABR), founded in 1971, and was coined by Bill James, who is one of its pioneers and considered its most prominent advocate and public face.
In baseball statistics, slugging percentage (SLG) is a measure of the batting productivity of a hitter. It is calculated as total bases divided by at-bats, through the following formula, where AB is the number of at-bats for a given player, and 1B, 2B, 3B, and HR are the number of singles, doubles, triples, and home runs, respectively:
George William James is an American baseball writer, historian, and statistician whose work has been widely influential. Since 1977, James has written more than two dozen books about baseball history and statistics. His approach, which he named sabermetrics after the Society for American Baseball Research (SABR), scientifically analyzes and studies baseball, often through the use of statistical data, in an attempt to determine why teams win and lose.
The Elo rating system is a method for calculating the relative skill levels of players in zero-sum games such as chess or esports. It is named after its creator Arpad Elo, a Hungarian-American physics professor.
In baseball and softball, a win–loss record is a statistic that indicates the number of wins and losses credited to a pitcher. For example, a 20–10 win–loss record would represent 20 wins and 10 losses.
In baseball, a save is credited to a pitcher who finishes a game for the winning team under certain circumstances. A save can be earned by entering a game in which his team is leading by three or fewer runs and finishing the game by pitching at least one inning without losing the lead; entering the game with the tying run in the on-deck circle, at the plate or on the bases and finishing the game; or by pitching at least three innings in relief and finishing the game regardless of how many runs your team was winning by when entering the game. The number of saves or percentage of save opportunities successfully converted are oft-cited statistics of relief pitchers, particularly those in the closer role. The save statistic was created by journalist Jerome Holtzman in 1959 to "measure the effectiveness of relief pitchers" and was adopted as an official Major League Baseball (MLB) statistic in 1969. The save has been retroactively tabulated for pitchers before that date. Mariano Rivera is MLB's all-time leader in regular-season saves with 652, while Francisco Rodríguez earned the most saves in a single season with 62 in 2008.
Runs created (RC) is a baseball statistic invented by Bill James to estimate the number of runs a hitter contributes to their team.
In baseball, value over replacement player is a statistic popularized by Keith Woolner that demonstrates how much a hitter, pitcher or outfielder contributes to their team in comparison to a replacement-level player who is an average fielder at that position and a below average hitter. A replacement player performs at "replacement level," which is the level of performance an average team can expect when trying to replace a player at minimal cost, also known as "freely available talent."
In sports, a winning percentage or Copeland score is the fraction of games or matches a team or individual has won. The statistic is commonly used in standings or rankings to compare teams or individuals. It is defined as wins divided by the total number of matches played. A draw counts as a 1⁄2 win.
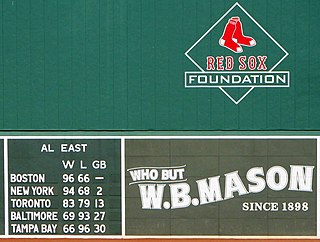
In some North American sports, the phrase games behind or games back refers to a common way to reflect the gap between a leading team and another team in a sports league, conference, or division.
A sports rating system is a system that analyzes the results of sports competitions to provide ratings for each team or player. Common systems include polls of expert voters, crowdsourcing non-expert voters, betting markets, and computer systems. Ratings, or power ratings, are numerical representations of competitive strength, often directly comparable so that the game outcome between any two teams can be predicted. Rankings, or power rankings, can be directly provided, or can be derived by sorting each team's ratings and assigning an ordinal rank to each team, so that the highest rated team earns the #1 rank. Rating systems provide an alternative to traditional sports standings which are based on win–loss–tie ratios.
Football Outsiders (FO) was a website started in July 2003 which focused on advanced statistical analysis of the National Football League (NFL). The site was run by a staff of regular writers, who produced a series of weekly columns using both the site's in-house statistics and their personal analyses of NFL games.
PECOTA, an acronym for Player Empirical Comparison and Optimization Test Algorithm, is a sabermetric system for forecasting Major League Baseball player performance. The word is a backronym based on the name of journeyman major league player Bill Pecota, who, with a lifetime batting average of .249, is perhaps representative of the typical PECOTA entry. PECOTA was developed by Nate Silver in 2002–2003 and introduced to the public in the book Baseball Prospectus 2003. Baseball Prospectus (BP) has owned PECOTA since 2003; Silver managed PECOTA from 2003 to 2009. Beginning in Spring 2009, BP assumed responsibility for producing the annual forecasts, making 2010 the first baseball season for which Silver played no role in producing PECOTA projections.
In baseball statistics, earned run average (ERA) is the average of earned runs allowed by a pitcher per nine innings pitched. It is determined by dividing the number of earned runs allowed by the number of innings pitched and multiplying by nine. Thus, a lower ERA is better. Runs resulting from passed balls, defensive errors, and runners placed on base at the start of extra innings are recorded as unearned runs and omitted from ERA calculations.
Win Shares is a 2002 book about baseball written by Bill James and Jim Henzler. The book explains how to apply the concept of sabermetrics to assess the impact of player performance in a combination of several areas, including offensive, defensive, and pitching on their team's overall performance. The resulting "Win Share" also takes into account factors such as the era in which the player was active to allow easy comparisons between players from different eras. The book focuses primarily on the many formulas involved in computing the final number of win shares accumulated.
Wins above replacement or wins above replacement player, commonly abbreviated to WAR or WARP, is a non-standardized sabermetric baseball statistic developed to sum up "a player's total contributions to his team". A player's WAR value is claimed to be the number of additional wins his team has achieved above the number of expected team wins if that player were substituted with a replacement-level player: a player who may be added to the team for minimal cost and effort.
In baseball, run differential is a cumulative team statistic that combines offensive and defensive scoring. Run differential is calculated by subtracting runs allowed from runs scored.
Runs Per Wicket Ratio is a method of ranking teams in league tables in cricket who are equal on other criteria, including points.
This page is based on this Wikipedia article Text is available under the CC BY-SA 4.0 license; additional terms may apply. Images, videos and audio are available under their respective licenses.


