This is a list of results for the 2021 New South Wales local elections in the Northern Rivers region. [1] [2] [3] [4]
Party | Votes | % | Swing | Seats | Change | ||
---|---|---|---|---|---|---|---|
Independent | 1,0195 | 40.4 | 4 | 1 | |||
Sharon Cadwallader Team | 7,227 | 28.6 | 3 | ||||
Greens | 4,173 | 16.5 | +16.5 | 2 | 2 | ||
Labor | 3,676 | 14.5 | +14.5 | 0 | |||
Formal votes | 25,271 | 90.94 | |||||
Informal votes | 2,517 | 9.06 | |||||
Total | 27,788 | 100.00 | 9 | ||||
Registered voters / turnout | 32,830 | 84.64 |
Party | Candidate | Votes | % | ±% | |
---|---|---|---|---|---|
Sharon Cadwallader Team | Rod Bruem (elected) | 1,395 | 17.6 | ||
Independent | Steve McCarthy (elected) | 1,371 | 17.3 | ||
Independent | Phil Meehan (elected) | 1,337 | 16.8 | ||
Labor | Col Riches | 1,079 | 13.6 | ||
Greens | Jason Shrieves | 919 | 11.6 | ||
Independent | Rick Hyde | 818 | 10.3 | ||
Independent | Lenkunyar Roberts | 335 | 4.2 | ||
Sharon Cadwallader Team | Simon Kinny | 327 | 4.1 | ||
Independent | Kevin Loughrey | 290 | 3.6 | ||
Independent | John Bout | 76 | 1.0 | ||
Total formal votes | 7,947 | 89.5 | |||
Informal votes | 933 | 10.5 | |||
Turnout | 82.4 |
Party | Candidate | Votes | % | ±% | |
---|---|---|---|---|---|
Sharon Cadwallader Team | Sharon Cadwallader | 3,321 | 36.5 | ||
Independent | Jeff Johnson (elected) | 2,172 | 23.9 | ||
Greens | Kiri Dicker (elected) | 1,485 | 16.3 | ||
Labor | Keith Williams | 1,215 | 13.4 | [lower-alpha 1] | |
Sharon Cadwallader Team | Eva Ramsey (elected) | 371 | 4.1 | ||
Independent | Wendy Wishart | 342 | 3.8 | ||
Labor | Leonie Price | 181 | 2.0 | ||
Total formal votes | 9,087 | 92.4 | |||
Informal votes | 747 | 7.6 | |||
Turnout | 85.3 |
Party | Candidate | Votes | % | ±% | |
---|---|---|---|---|---|
Independent | Eoin Johnston (elected) | 3,454 | 41.9 | ||
Greens | Simon Chate (elected) | 1,769 | 21.5 | ||
Sharon Cadwallader Team | Nigel Buchanan (elected) | 1,242 | 15.1 | ||
Labor | Therese Crollick | 1,201 | 14.6 | ||
Sharon Cadwallader Team | Stephen Bocking | 571 | 6.9 | ||
Total formal votes | 8,237 | 90.8 | |||
Informal votes | 837 | 9.2 | |||
Turnout | 86.3 |
Elected councillor | Party | |
---|---|---|
Duncan Dey | Greens | |
Cate Coorey | Independent (Group B) | |
Mark Swivel | Mark Swivel Team | |
Sama Balson | Byron Independents | |
Asren Pugh | Labor | |
Sarah Ndiaye | Greens | |
Peter Westheimer | Byron Independents | |
Alan Hunter | Byron Alliance |
Party | Candidate | Votes | % | ±% | |
---|---|---|---|---|---|
Greens | 3,755 | 21.2 | −21.7 | ||
Byron Independents | 3,627 | 20.5 | |||
Mark Swivel Team | 2,969 | 16.7 | |||
Independent (Group B) | 2,633 | 14.8 | |||
Labor | 2,196 | 12.4 | |||
Byron Alliance | 1,235 | 7.0 | |||
Byron Shire Action Group | 975 | 5.5 | |||
Independent | John Anderson | 345 | 1.9 | ||
Total formal votes | 17,735 | 94.6 | |||
Informal votes | 1,021 | 5.4 | |||
Turnout | 18,756 | 73.8 | |||
Party total seats | Seats | ± | |||
Independent | 5 | 3 | |||
Greens | 2 | 1 | |||
Labor | 1 | 1 |
Party | Candidate | Votes | % | ±% | |
---|---|---|---|---|---|
Independent | Jeff Smith (elected) | 6,022 | 19.6 | ||
Independent | Debrah Novak (elected) | 3,622 | 11.8 | ||
Independent | Ian Tiley (elected) | 2,637 | 8.6 | ||
Independent National | Allison Whaites (elected) | 2,403 | 7.8 | ||
Independent | Bill Day (elected) | 2,039 | 6.7 | ||
Greens | Greg Clancy (elected) | 2,592 | 8.5 | ||
Independent National | Peter Johnstone (elected) | 2,212 | 7.2 | ||
Independent | Karen Toms (elected) | 1,658 | 5.4 | ||
Independent | Steve Pickering (elected) | 1,536 | 5.0 | ||
Independent Labor | Peter Ellem | 1,494 | 4.9 | ||
Independent | Ash Gibbons | 1,189 | 3.9 | ||
Independent | Pete Hanson | 1,189 | 3.9 | ||
Independent National | Donald Scott | 702 | 2.3 | ||
Independent | Phil Belletty | 661 | 2.2 | ||
Independent | Jeffrey Fuller | 357 | 1.2 | ||
Independent | Warren Lang | 348 | 1.1 | ||
Total formal votes | 30,661 | 92.9 | |||
Informal votes | 2,358 | 7.1 | |||
Turnout | 85.7 | ||||
Party total votes | |||||
Independent | 23,850 | 77.8 | |||
Independent National | 5,317 | 17.3 | |||
Independent Labor | 1,494 | 4.9 | |||
Party total seats | Seats | ± | |||
Independent | 7 | ||||
Independent National | 2 | 1 | |||
Independent Labor | 0 | 1 |
Party | Votes | % | Swing | Seats | Change | ||
---|---|---|---|---|---|---|---|
Independent | 3,419 | 100.0 | +0.0 | 9 | |||
Formal votes | 3,419 | 95.2 | |||||
Informal votes | 172 | 4.8 | |||||
Total | 3,591 | 100.0 | |||||
Registered voters / turnout | 6,688 | 53.7 |
Party | Candidate | Votes | % | ±% | |
---|---|---|---|---|---|
Independent | Hayden Doolan (elected) | unopposed | |||
Independent | Kylie Thomas (elected) | unopposed | |||
Independent | Janet Wilson (elected) | unopposed | |||
Registered electors | 2,251 |
Party | Candidate | Votes | % | ±% | |
---|---|---|---|---|---|
Independent | Robert Cullen (elected) | 534 | 30.5 | ||
Independent | John Burley (elected) | 415 | 23.7 | ||
Independent | Maggie May (elected) | 392 | 22.4 | ||
Independent | Vickie Steward | 210 | 12.0 | ||
Independent | Bob Dwyer | 202 | 11.5 | ||
Total formal votes | 1,753 | 95.1 | |||
Informal votes | 90 | 4.9 | |||
Turnout | 1,843 | 83.9 |
Party | Candidate | Votes | % | ±% | |
---|---|---|---|---|---|
Independent | Danielle Mulholland (elected) | 813 | 48.8 | ||
Independent | Tom Cooper (elected) | 446 | 26.8 | ||
Independent | James Murray (elected) | 322 | 19.3 | ||
Independent | Simon Dejoux | 85 | 5.1 | ||
Total formal votes | 1,666 | 95.3 | |||
Informal votes | 82 | 4.7 | |||
Turnout | 1,748 | 78.0 |
Elected councillor | Party | |
---|---|---|
Peter Colby | Steve Krieg | |
Jeri Hall | Steve Krieg | |
Andrew Gordon | Steve Krieg | |
Electra Jensen | Steve Krieg | |
Andrew Bing | Steve Krieg | |
Vanessa Grindon-Ekins | Greens | |
Adam Guise | Greens | |
Darlene Cook | Labor | |
Elly Bird | OSF | |
Big Rob | Independent |
Party | Candidate | Votes | % | ±% | |
---|---|---|---|---|---|
Steve Krieg for Lismore | 12,766 | 49.2 | +49.2 | ||
Greens | 3,820 | 14.7 | +0.8 | ||
Labor | 3,195 | 12.3 | −10.3 | ||
Our Sustainable Future | 2,769 | 10.7 | +0.0 | ||
Independent | 1,948 | 7.5 | |||
Independent Lismore | 797 | 3.1 | |||
Animal Justice | 653 | 2.5 | +2.5 | ||
Total formal votes | 25,948 | 95.8 | |||
Informal votes | 1,140 | 4.2 | |||
Turnout | 27,088 | 85.9 |
Elected councillor | Party | |
---|---|---|
Steve Morrissey | Independent (Group B) | |
Sam Cornish | Independent (Group B) | |
Sandra Humphrys | Independent (Group B) | |
Debra McGillan | Independent (Group B) | |
Patrick Deegan | Labor | |
Robert Hayes | Independent (Group D) |
Party | Candidate | Votes | % | ±% | |
---|---|---|---|---|---|
Independent (Robert Mustow's Group B) | 7,346 | 57.6 | |||
Labor | 1,769 | 13.9 | |||
Independent (Group D) | 1,457 | 11.4 | |||
Independent (Group A) | 1,281 | 10.0 | |||
Independent (Group C) | 776 | 6.1 | |||
Independent | Robyn Kapeen | 127 | 1.0 | ||
Total formal votes | 12,756 | 90.7 | |||
Informal votes | 1,313 | 9.3 | |||
Turnout | 14,069 | 85.4 |
Richmond Valley Council (RVC) is a local government area on the Northern Rivers region of north-eastern New South Wales, Australia. RVC services an area of 3,051 square kilometres (1,178 sq mi) and draws its name from the Richmond River, which flows through most of the council area. The area under management is located adjacent to the Bruxner Highway, Pacific Highway, and the North Coast railway line.
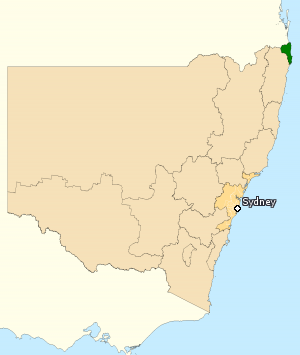
The Division of Richmond is an Australian electoral division in the state of New South Wales.
Ballina is an electoral district of the Legislative Assembly in the Australian state of New South Wales.
Byron Shire is a local government area located in the Northern Rivers region of New South Wales, Australia. The shire is located adjacent to the Coral Sea about 50 kilometres (31 mi) south of the Queensland border. The shire, administered from the town of Mullumbimby, covers an area of 566.7 square kilometres (218.8 sq mi), and has existed as a local government entity since 1906. The shire was named for Cape Byron, itself named by Captain James Cook in May 1770 in honour of Vice-Admiral John Byron.
The Municipality of Kiama is a local government area in the Illawarra region of New South Wales, Australia. The area is situated south of Shellharbour and the City of Wollongong and is located adjacent to the Pacific Ocean, the Princes Highway and the South Coast railway line.
Ballina Shire is a local government area in the Northern Rivers region of New South Wales, Australia. The Shire was formed on 1 January 1977 by the amalgamation of the Municipality of Ballina and Tintenbar Shire. The Shire is located adjacent to the Tasman Sea and the Pacific Highway. The council seat is located in the town of Ballina. The population of the Ballina Shire area was 46,850 in 2022.
Ballina, an electoral district of the Legislative Assembly in the Australian state of New South Wales, was established in 1894. In 1904 it was abolished and replaced by Byron. It was re-established in 1988, largely replacing Lismore.
Benjamin Cameron Franklin is an Australian politician. He served as a member of the New South Wales Legislative Council from March 2015 until March 2019, representing the National Party. He resigned in 2019 to contest the Legislative Assembly seat of Ballina, but was defeated by the incumbent Greens MP Tamara Smith. He was subsequently appointed in May 2019 to fill the casual vacancy caused by his own resignation. Franklin served as the Minister for Aboriginal Affairs, the Minister for the Arts, and the Minister for Regional Youth in the second Perrottet ministry from December 2021 to March 2023.
The 2017 New South Wales local elections were held on 9 September 2017 to elect the councils of 46 of the 128 local government areas (LGAs) in New South Wales. Several councils also held mayoral elections and/or referendums.
The 2016 New South Wales local elections were held on 10 September 2016 to elect the councils of 79 of the 128 local government areas (LGAs) of New South Wales. Several councils also held mayoral elections and/or referendums.
The 2021 New South Wales mayoral elections were held on 4 December 2021 to elect mayors or lord mayors to 35 of the 128 local government areas (LGAs) in New South Wales. The elections were held as part of the statewide local elections.
The 2024 New South Wales mayoral elections were held on 14 September 2024 to elect mayors or lord mayors to 37 of the 128 local government areas (LGAs) in New South Wales, Australia. The elections took place as part of the statewide local elections.
This is a list of results for the 2021 New South Wales local elections in the Riverina region.
This is a list of results for the 2021 New South Wales local elections in the New England region, including the North West.
This is a list of results for the 2021 New South Wales local elections in the Mid North Coast region.
This is a list of results for the 2021 New South Wales local elections in the Murray region, including the Far West.
This is a list of results for the 2021 New South Wales local elections in the Hunter Region.
This is a list of results for the 2021 New South Wales local elections in the South Coast and Southern Inland region.
This is a list of results for the 2024 New South Wales local elections in the Northern Rivers region.