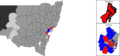
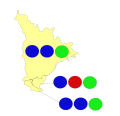
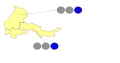
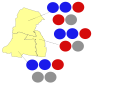
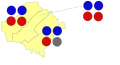
This is a list of local government area results for the 2021 New South Wales local elections. [1] [2] [3] [4]
Elected councillor | Party | |
---|---|---|
Kylie King | Team Kylie | |
Steve Bowen | Team Kylie | |
Stuart Baker | Stuart Baker Team | |
Jessica Kellahan | Stuart Baker Team | |
Alice Glachan | Alice Glachan Ticket | |
Ashley Edwards | Greens | |
Darren Cameron | Labor | |
Daryl Betteridge | Independent (Group A) | |
David Thurley | Thurley |
Party | Candidate | Votes | % | ±% | |
---|---|---|---|---|---|
Team Kylie | 6,426 | 22.6 | |||
Stuart Baker Team | 4,863 | 17.1 | |||
Alice Glachan Ticket | 3,959 | 14.0 | |||
Greens | 3,074 | 10.8 | |||
Labor | 2,714 | 9.5 | |||
Independent (Group A) | 2,661 | 9.4 | |||
Hamilton Team | 1,324 | 4.7 | |||
Albury First | 1,294 | 4.6 | |||
Thurley | 1,244 | 4.4 | |||
Independent (Group E) | 768 | 2.7 | |||
Independent | Peter Hood | 51 | 0.2 | ||
Total formal votes | 28,374 | 94.2 | |||
Informal votes | 1,745 | 5.8 | |||
Turnout | 80.0 |
Elected councillor | Party | |
---|---|---|
Debra O'Brien | Labor | |
Susan McMichael | Labor | |
Margaret O'Connor | Ind. Liberal | |
Dorothy Robinson | Greens | |
Sam Coupland | Independent | |
Jon Galletly | Independent | |
Steven Mepham | Independent | |
Todd Redwood | Independent | |
Paul Packham | Independent | |
Bradley Widders | Independent | |
Paul Gaddes | Independent |
Party | Candidate | Votes | % | ±% | |
---|---|---|---|---|---|
Labor | 2,352 | 15.5 | +4.5 | ||
Independent Liberal | 2,196 | 14.4 | +3.1 | ||
Independent | Sam Coupland | 1,897 | 12.5 | ||
Greens | 1,664 | 10.9 | +3.4 | ||
Independent | Jon Galletly | 1,139 | 7.5 | ||
Independent | Steven Mepham | 930 | 6.1 | ||
Independent | Todd Redwood | 852 | 5.6 | ||
Independent | Paul Packham | 728 | 4.8 | ||
Independent | Bradley Widders | 627 | 4.1 | ||
Independent | Paul Gaddes | 621 | 4.1 | ||
Independent | Richard Robinson | 598 | 3.9 | ||
Independent | Callan Schaefer | 466 | 3.1 | ||
Independent | Kathleen Clare | 416 | 2.7 | ||
Independent | Peter Bailey | 239 | 1.6 | ||
Independent | Margaret Sims | 224 | 1.5 | ||
Independent | Phillip Blackmore | 158 | 1.0 | ||
Independent | Craig Pevitt | 116 | 0.8 | ||
Total formal votes | 28,374 | 94.2 | |||
Informal votes | 1,745 | 5.8 | |||
Turnout | 80.0 | ||||
Party total seats | Seats | ± | |||
Independent | 7 | 1 | |||
Labor | 2 | 1 | |||
Independent Liberal | 1 | ||||
Greens | 1 | ||||
Party | Votes | % | Swing | Seats | Change | ||
---|---|---|---|---|---|---|---|
Independent | 1,0195 | 40.4 | 4 | 1 | |||
Sharon Cadwallader Team | 7,227 | 28.6 | 3 | ||||
Greens | 4,173 | 16.5 | +16.5 | 2 | 2 | ||
Labor | 3,676 | 14.5 | +14.5 | 0 | |||
Formal votes | 25,271 | 90.94 | |||||
Informal votes | 2,517 | 9.06 | |||||
Total | 27,788 | 100.00 | 9 | ||||
Registered voters / turnout | 32,830 | 84.64 |
Party | Candidate | Votes | % | ±% | |
---|---|---|---|---|---|
Sharon Cadwallader Team | Rod Bruem (elected) | 1,395 | 17.6 | ||
Independent | Steve McCarthy (elected) | 1,371 | 17.3 | ||
Independent | Phil Meehan (elected) | 1,337 | 16.8 | ||
Labor | Col Riches | 1,079 | 13.6 | ||
Greens | Jason Shrieves | 919 | 11.6 | ||
Independent | Rick Hyde | 818 | 10.3 | ||
Independent | Lenkunyar Roberts | 335 | 4.2 | ||
Sharon Cadwallader Team | Simon Kinny | 327 | 4.1 | ||
Independent | Kevin Loughrey | 290 | 3.6 | ||
Independent | John Bout | 76 | 1.0 | ||
Total formal votes | 7,947 | 89.5 | |||
Informal votes | 933 | 10.5 | |||
Turnout | 82.4 |
Party | Candidate | Votes | % | ±% | |
---|---|---|---|---|---|
Sharon Cadwallader Team | Sharon Cadwallader | 3,321 | 36.5 | ||
Independent | Jeff Johnson (elected) | 2,172 | 23.9 | ||
Greens | Kiri Dicker (elected) | 1,485 | 16.3 | ||
Labor | Keith Williams | 1,215 | 13.4 | [lower-alpha 1] | |
Sharon Cadwallader Team | Eva Ramsey (elected) | 371 | 4.1 | ||
Independent | Wendy Wishart | 342 | 3.8 | ||
Labor | Leonie Price | 181 | 2.0 | ||
Total formal votes | 9,087 | 92.4 | |||
Informal votes | 747 | 7.6 | |||
Turnout | 85.3 |
Party | Candidate | Votes | % | ±% | |
---|---|---|---|---|---|
Independent | Eoin Johnston (elected) | 3,454 | 41.9 | ||
Greens | Simon Chate (elected) | 1,769 | 21.5 | ||
Sharon Cadwallader Team | Nigel Buchanan (elected) | 1,242 | 15.1 | ||
Labor | Therese Crollick | 1,201 | 14.6 | ||
Sharon Cadwallader Team | Stephen Bocking | 571 | 6.9 | ||
Total formal votes | 8,237 | 90.8 | |||
Informal votes | 837 | 9.2 | |||
Turnout | 86.3 |
Elected councillor | Party | |
---|---|---|
Ben Fry | Balanced Bathurst | |
Kirralee Burke | Balanced Bathurst | |
Ian North | TEAM NORTH | |
Marg Hogan | Marg Hogan Team | |
Graeme Hanger | Team Hanger | |
Jess Jennings | Better Bathurst | |
Robert 'Stumpy' Taylor | Back Bathurst | |
Andrew 'Struthy' Smith | Back Bathurst | |
Warren Aubin | Bathurst First |
Party | Candidate | Votes | % | ±% | |
---|---|---|---|---|---|
Balanced Bathurst | 4,943 | 20.0 | |||
Back Bathurst | 4,334 | 17.5 | |||
TEAM NORTH | 2,475 | 10.0 | |||
Marg Hogan Team | 2,119 | 8.6 | |||
Better Bathurst | 2,057 | 8.3 | |||
Team Hanger – Working Together for Bathurst | 1,737 | 7.0 | |||
The Restore Bathurst Team | 1,458 | 5.9 | |||
Nick Packham for Bathurst | 1,244 | 5.0 | |||
Bathurst First | 1,125 | 4.6 | |||
Bathurst Matters | 792 | 3.2 | |||
Independent | Alex Christian | 733 | 3.0 | ||
TEAM BOURKE | Bobby Bourke | 456 | 1.8 | ||
Independent (Group J) | 393 | 1.6 | |||
Independent | Stuart Driver | 292 | 1.2 | ||
Team Singleton | 214 | 0.9 | |||
Independent | Catherine Strods | 129 | 0.5 | ||
Independent | Steve Semmens | 105 | 0.4 | ||
TEAM BOURKE | Jeff Muir | 42 | 0.2 | ||
TEAM BOURKE | Steve Ellery | 25 | 0.1 | ||
TEAM BOURKE | Ken Hope | 21 | 0.1 | ||
TEAM BOURKE | Michael Forde | 10 | 0.0 | ||
Total formal votes | 24,704 | 92.7 | |||
Informal votes | 1,939 | 7.3 | |||
Turnout | 86.3 |
The Liberal Party did not endorse any candidates, including its five councillors elected in 2017. [11]
Party | Votes | % | Swing | Seats | Change | ||
---|---|---|---|---|---|---|---|
Labor | 37,157 | 45.7 | −0.3 | 7 | |||
Independent | 22,563 | 27.8 | +7.8 | 4 | 1 | ||
Independent Liberal | 7,564 | 9.3 | −17.9 [lower-alpha 2] | 2 | 5 [lower-alpha 2] | ||
Peaceful Bayside | 3,015 | 3.7 | 1 | 1 | |||
Greens | 10,969 | 13.5 | +6.8 | 1 | 1 | ||
Formal votes | 81,268 |
Elected councillor | Party | |
---|---|---|
Christina Curry | Labor | |
Scott Morrissey | Labor | |
Jennifer Muscat | Independent (Group A) |
Party | Candidate | Votes | % | ±% | |
---|---|---|---|---|---|
Labor | 10,496 | 60.4 | |||
Independent (Group A) | 2,807 | 16.2 | |||
Independent (Group D) | 2,165 | 12.5 | |||
Greens | 1,911 | 11.0 | |||
Total formal votes | 17,379 | 94.2 | |||
Informal votes | 1,070 | 5.8 | |||
Turnout | 82.7 |
Elected councillor | Party | |
---|---|---|
Jo Jansyn | Labor | |
Ann Fardell | Labor | |
Michael Nagi | Ind. Liberal |
Party | Candidate | Votes | % | ±% | |
---|---|---|---|---|---|
Labor | 9,164 | 53.4 | |||
Independent Liberal | 3,173 | 18.5 | |||
Greens | 3,169 | 18.5 | |||
Independent (Group C) | 1,662 | 9.7 | |||
Total formal votes | 17,168 | 94.2 | |||
Informal votes | 1,064 | 5.8 | |||
Turnout | 80.4 |
Elected councillor | Party | |
---|---|---|
Bill Saravinovski | Labor | |
Greta Werner | Greens | |
Andrew Tsounis | Independent (Group D) |
Party | Candidate | Votes | % | ±% | |
---|---|---|---|---|---|
Labor | 6,494 | 42.7 | |||
Greens | 3,459 | 22.7 | |||
Independent (Group D) | 2,935 | 19.3 | |||
Independent (Group A) | 2,324 | 15.3 | |||
Total formal votes | 15,212 | 92.7 | |||
Informal votes | 1,202 | 7.3 | |||
Turnout | 83.2 |
Elected councillor | Party | |
---|---|---|
Liz Barlow | Independent | |
Mark Hanna | Independent | |
Joe Awada | Labor |
Party | Candidate | Votes | % | ±% | |
---|---|---|---|---|---|
Independent (Group A) | 7,412 | 44.9 | |||
Labor | 6,677 | 40.4 | |||
Greens | 2,430 | 14.7 | |||
Total formal votes | 16,519 | 93.0 | |||
Informal votes | 1,239 | 7.0 | |||
Turnout | 85.8 |
Elected councillor | Party | |
---|---|---|
Edward McDougall | Labor | |
Heidi Douglas | Peaceful Bayside | |
Paul Sedral | Ind. Liberal |
Party | Candidate | Votes | % | ±% | |
---|---|---|---|---|---|
Independent Liberal | 4,347 | 29.0 | |||
Labor | 4,326 | 28.9 | |||
Peaceful Bayside | 3,015 | 20.1 | |||
Independent (Group E) | 2,487 | 16.1 | |||
Independent (Group D) | 771 | 5.1 | |||
Independent Liberal | Ron Bezic | 44 | 0.3 | ||
Total formal votes | 14,990 | 91.5 | |||
Informal votes | 1,398 | 8.5 | |||
Turnout | 84.4 |
Elected councillor | Party | |
---|---|---|
Helen O'Neil | Labor | |
Cathy Griff | Greens | |
Russell Fitzpatrick | Independent | |
Tony Allen | Independent | |
Karen Wright | Independent | |
Mitch Nadin | Independent | |
Joy Robin | Independent | |
David Porter | Independent | |
Liz Seckhold | Independent |
Party | Candidate | Votes | % | ±% | |
---|---|---|---|---|---|
Labor | 4,943 | 17.3 | |||
Independent | Russell Fitzpatrick | 2,818 | 13.1 | ||
Greens | 2,665 | 12.4 | |||
Independent | Tony Allen | 2,594 | 12.1 | ||
Independent | Karen Wright | 2,539 | 11.8 | ||
Independent | Mitch Nadin | 1,201 | 5.6 | ||
Independent | Joy Robin | 1,080 | 5.0 | ||
Independent | David Porter | 1,003 | 4.7 | ||
Independent | Mike Britten | 884 | 4.1 | ||
Independent | Liz Seckhold | 875 | 4.1 | ||
Independent | Nathan O'Donnell | 852 | 4.0 | ||
Independent | Joshua Shoobridge | 650 | 3.0 | ||
Independent | Neil Bourke | 568 | 2.6 | ||
Total formal votes | 21,435 | 91.4 | |||
Informal votes | 2,026 | 8.6 | |||
Turnout | 23,461 | 87.9 | |||
Party total votes | |||||
Independent | 15,064 | 70.3 | |||
Labor | 4,943 | 17.3 | |||
Greens | 2,665 | 12.4 | |||
Elected councillor | Party | |
---|---|---|
Dominic King | Greens | |
Jo Brotherton | WWI | |
Ellie Tree | WWI | |
Joanne Cook | Independent (Group E) | |
Stephen Glyde | Stephen Glyde Group | |
Jennie Fenton | Greens | |
Joy Robin | Independent | |
David Porter | Independent | |
Liz Seckhold | Independent |
Party | Candidate | Votes | % | ±% | |
---|---|---|---|---|---|
Waterfall Way Independents | 2,800 | 33.9 | |||
Greens | 2,145 | 25.9 | |||
Independent (Group E) | 1,163 | 14.0 | |||
Stephen Glyde Group | 990 | 12.0 | |||
Labor | 838 | 10.1 | |||
Independent (Group B) | 334 | 4.0 | |||
Total formal votes | 8,270 | 95.9 | |||
Informal votes | 352 | 4.1 | |||
Turnout | 83.8 |
Party | Candidate | Votes | % | ±% | |
---|---|---|---|---|---|
Independent | Matthew Hannan (elected) | 833 | 17.6 | ||
Independent | Carly Marriott (elected) | 654 | 13.9 | ||
Independent | Sarah McNaught (elected) | 610 | 12.9 | ||
Independent | Edward (Ted) Hatty (elected) | 488 | 10.3 | ||
Independent | John Taylor (elected) | 347 | 7.4 | ||
Independent | Roger Reynoldson (elected) | 313 | 6.6 | ||
Independent | Julia Cornwell McKean (elected) | 302 | 6.4 | ||
Independent | Renee Paine (elected) | 271 | 5.7 | ||
Independent | Marcus Fry | 195 | 4.1 | ||
Independent | Mandy Bonat | 185 | 3.9 | ||
Independent | Clare Allan | 182 | 3.9 | ||
Independent | Daryll Morris | 172 | 3.6 | ||
Independent | Ross Bodey | 168 | 3.6 | ||
Total formal votes | 4,720 | 95.0 | |||
Informal votes | 249 | 5.0 | |||
Turnout | 4,969 | 80.5 |
The Liberal Party did not endorse any candidates, including its five councillors elected in 2016. [16] [17]
Party | Votes | % | Swing | Seats | Change | ||
---|---|---|---|---|---|---|---|
Labor | 98,633 | 53.6 | +1.8 | 10 | |||
Blacktown Coalition Team | 33,720 | 18.3 | +18.3 | 1 | 1 | ||
Independent Liberal | 32,747 | 17.8 | 3 | 3 | |||
Your Community Coalition | 9,104 | 4.9 | +4.9 | 1 | 1 | ||
Greens | 4,632 | 2.5 | 0 | ||||
Blacktown Matters Independents | 4,335 | 2.4 | 0 | ||||
Independent | 981 | 0.5 | 0 | ||||
Formal votes | 184,152 | 93.47 | |||||
Informal votes | 12,862 | 6.53 | |||||
Total | 197,014 | 100.0 |
Elected councillor | Party | |
---|---|---|
Moninder Singh | Labor | |
Christopher Quilkey | Labor | |
Jess Diaz | Ind. Liberal |
Party | Candidate | Votes | % | ±% | |
---|---|---|---|---|---|
Labor | 22,693 | 51.6 | |||
Independent Liberal | 12,285 | 27.2 | |||
Blacktown Coalition Team | 8,534 | 19.4 | |||
Independent | Anil Kumar | 500 | 1.1 | ||
Total formal votes | 44,012 | 53.9 | |||
Informal votes | 2,857 | 6.1 | |||
Turnout | 86.6 |
Elected councillor | Party | |
---|---|---|
Julie Griffiths | Labor | |
Kushpinder Kaur | Labor | |
Michael Stubley | Coalition Team |
Party | Candidate | Votes | % | ±% | |
---|---|---|---|---|---|
Labor | 16,589 | 47.6 | |||
Blacktown Coalition Team | 9,277 | 26.6 | |||
Greens | 4,632 | 13.3 | |||
Independent Liberal | 4,136 | 11.9 | |||
Independent | Kittu Randhawa | 220 | 0.6 | ||
Total formal votes | 34,854 | 94.0 | |||
Informal votes | 2,211 | 6.0 | |||
Turnout | 85.2 |
Elected councillor | Party | |
---|---|---|
Susai Benjamin | Labor | |
Kathie Collins | Labor | |
Allan Green | Community Coalition |
Party | Candidate | Votes | % | ±% | |
---|---|---|---|---|---|
Labor | 19,245 | 57.1 | |||
Your Community Coalition | 9,104 | 27.0 | |||
Blacktown Coalition Team | 5,332 | 15.8 | |||
Total formal votes | 33,681 | 93.4 | |||
Informal votes | 2,398 | 6.6 | |||
Turnout | 83.6 |
Elected councillor | Party | |
---|---|---|
Carol Israel | Labor | |
Bob Fitzgerald | Labor | |
Peter Camilleri | Ind. Liberal |
Party | Candidate | Votes | % | ±% | |
---|---|---|---|---|---|
Labor | 20,485 | 57.9 | |||
Independent Liberal | 8,905 | 25.2 | |||
Blacktown Coalition Team | 5,961 | 16.9 | |||
Total formal votes | 35,351 | 93.5 | |||
Informal votes | 2,447 | 6.5 | |||
Turnout | 84.6 |
Elected councillor | Party | |
---|---|---|
Tony Bleasdale | Labor | |
Brad Bunting | Labor | |
Livingston Chettipally | Ind. Liberal |
Party | Candidate | Votes | % | ±% | |
---|---|---|---|---|---|
Labor | 19,621 | 54.1 | |||
Independent Liberal | 7,421 | 20.5 | |||
Blacktown Coalition Team | 4,616 | 12.7 | |||
Blacktown Matters Independents | 4,335 | 12.0 | |||
Independent | Ammar Khan | 261 | 0.7 | ||
Total formal votes | 36,254 | 92.5 | |||
Informal votes | 2,949 | 7.5 | |||
Turnout | 78.4 |
Party | Candidate | Votes | % | ±% | |
---|---|---|---|---|---|
Independent | Brian Monaghan (elected) | 913 | 28.4 | ||
Independent | Elizabeth McGlynn (elected) | 405 | 12.6 | ||
Independent | Kerron Keatley (elected) | 399 | 12.4 | ||
Independent | Rodney Crowe (elected) | 339 | 10.6 | ||
Independent | Roger Moore (elected) | 256 | 8.0 | ||
Independent | Jill Funnell (elected) | 201 | 6.3 | ||
Independent | Tony Lord (elected) | 201 | 6.3 | ||
Independent | Bruce Baker (elected) | 196 | 6.1 | ||
Independent | Monica Clark (elected) | 176 | 5.5 | ||
Independent | Bradley Staniforth | 125 | 3.9 | ||
Total formal votes | 3,211 | 96.1 | |||
Informal votes | 131 | 3.9 | |||
Turnout | 3,342 | 80.7 |
Party | Candidate | Votes | % | ±% | |
---|---|---|---|---|---|
Independent | Scott Ferguson (elected) | 1,036 | 22.7 | ||
Independent | Bruce Reynolds (elected) | 635 | 13.9 | ||
Independent | Michelle Pryse Jones (elected) | 605 | 13.3 | ||
Independent | Craig Gosewisch (elected) | 559 | 12.3 | ||
Independent | Allan Ewin (elected) | 526 | 11.5 | ||
Independent | David Somervaille (elected) | 443 | 9.7 | ||
Independent | John Newstead (elected) | 416 | 9.1 | ||
Independent | Iris Dorsett | 340 | 7.5 | ||
Total formal votes | 4,560 | 95.3 | |||
Informal votes | 224 | 4.7 | |||
Turnout | 4,784 | 87.7 |
Party | Votes | % | Swing | Seats | Change | ||
---|---|---|---|---|---|---|---|
Labor | 24,032 | 49.2 | +11.4 | 6 | 1 | ||
Liberal | 11,750 | 24.1 | −1.1 | 3 | 1 | ||
Greens | 7,296 | 14.9 | −4.3 | 2 | |||
Independent | 5,755 | 11.8 | −5.9 | 1 | |||
Formal votes | 48,833 | 96.48 | |||||
Informal votes | 1,784 | 3.52 | |||||
Total | 50,617 | 100.00 |
Elected councillor | Party | |
---|---|---|
Suzie van Opdorp | Labor | |
Kevin Schreiber | Liberal | |
Sarah Redshaw | Greens |
Party | Candidate | Votes | % | ±% | |
---|---|---|---|---|---|
Labor | 5,303 | 46.4 | |||
Greens | 3,267 | 28.6 | |||
Liberal | 2,865 | 25.1 | |||
Total formal votes | 11,435 | 95.8 | |||
Informal votes | 501 | 4.2 | |||
Turnout | 11,936 | 82.6 |
Elected councillor | Party | |
---|---|---|
Claire West | Labor | |
Romola Hollywood | Labor | |
Brent Hoare | Greens |
Party | Candidate | Votes | % | ±% | |
---|---|---|---|---|---|
Labor | 5,950 | 47.6 | |||
Liberal | 2,270 | 18.2 | |||
Independent | 2,145 | 17.2 | |||
Greens | 2,128 | 17.0 | |||
Total formal votes | 12,493 | 96.3 | |||
Informal votes | 474 | 3.7 | |||
Turnout | 12,967 | 88.4 |
Elected councillor | Party | |
---|---|---|
Mick Fell | Labor | |
Roza Sage | Liberal | |
Daniel Myles | Independent |
Party | Candidate | Votes | % | ±% | |
---|---|---|---|---|---|
Labor | 4,821 | 38.4 | |||
Liberal | 3,873 | 30.8 | |||
Independent | 1,972 | 15.7 | |||
Greens | 1,901 | 15.1 | |||
Total formal votes | 12,567 | 96.7 | |||
Informal votes | 425 | 3.3 | |||
Turnout | 12,992 | 88.4 |
Elected councillor | Party | |
---|---|---|
Mark Greenhill | Labor | |
Nyree Fisher | Labor | |
Brendan Christie | Liberal |
Party | Candidate | Votes | % | ±% | |
---|---|---|---|---|---|
Labor | 7,958 | 64.5 | |||
Liberal | 2,742 | 22.2 | |||
Independent | 1,638 | 13.3 | |||
Total formal votes | 12,338 | 97.0 | |||
Informal votes | 384 | 3.0 | |||
Turnout | 12,722 | 89.2 |
Party | Candidate | Votes | % | ±% | |
---|---|---|---|---|---|
Independent | Glen Neill (elected) | 336 | 22.9 | ||
Independent | Karl Bright (elected) | 216 | 14.7 | ||
Independent | Graham Jackson (elected) | 200 | 13.6 | ||
Independent | Victoria Boag (elected) | 155 | 10.6 | ||
Independent | Jodi Douglas (elected) | 116 | 7.9 | ||
Independent | Richard Milligan (elected) | 99 | 6.7 | ||
Independent | Douglas Menzies (elected) | 97 | 6.6 | ||
Independent | Michael Hoare | 66 | 4.5 | ||
Independent | Greg Deacon (elected) | 65 | 4.4 | ||
Independent | Veneta Dutton | 59 | 4.0 | ||
Independent | Tony Elias (elected) | 58 | 4.0 | ||
Total formal votes | 1,467 | 97.5 | |||
Informal votes | 38 | 2.5 | |||
Turnout | 1,505 | 78.4 |
Party | Candidate | Votes | % | ±% | |
---|---|---|---|---|---|
Independent | Victor Bartley (elected) | unopposed | |||
Independent | Sarah Barton (elected) | unopposed | |||
Independent | Sally Davis (elected) | unopposed | |||
Independent | Cec Dorrington (elected) | unopposed | |||
Independent | Lachlan Ford (elected) | unopposed | |||
Independent | Barry Hollman (elected) | unopposed | |||
Independent | Samuel Rice (elected) | unopposed | |||
Independent | Grace Ridge (elected) | unopposed | |||
Independent | Nathan Ryan (elected) | unopposed | |||
Independent | Bob Stutsel (elected) | unopposed | |||
Registered electors | 1,775 |
Party | Candidate | Votes | % | ±% | |
---|---|---|---|---|---|
Independent | Vivian Slack-Smith (elected) | 148 | 26.9 | ||
Independent | Thomas Stanton (elected) | 102 | 18.5 | ||
Independent | Angelo Pippos (elected) | 64 | 11.6 | ||
Independent | Gordon Douglas (elected) | 49 | 8.9 | ||
Greens | Trish Frail (elected) | 39 | 7.1 | ||
Independent | Noel Sheridan (elected) | 37 | 6.7 | ||
Independent | Mark Brown (elected) | 36 | 6.5 | ||
Independent | Donna Jefferies (elected) | 28 | 5.1 | ||
Independent | Lily Shearer | 24 | 4.4 | ||
Independent | Isaac Gordon (elected) | 23 | 4.2 | ||
Total formal votes | 550 | 97.0 | |||
Informal votes | 17 | 3.0 | |||
Turnout | 567 | 63.6 | |||
Party total votes | |||||
Independent | 511 | 92.9 | |||
Greens | 39 | 7.1 | |||
Party total seats | Seats | ± | |||
Independent | 8 | 1 | |||
Greens | 1 | 1 | |||
Elected councillor | Party | |
---|---|---|
Dave Gallagher | Team Broken Hill | |
Michael Boland | FABBH | |
Darriea Turley | Labor | |
Bob Algate | FABBH | |
Ronald Page | Team Broken Hill | |
Marion Browne | Labor | |
Jim Hickey | FABBH | |
Hayley Jewitt | FABBH | |
Alan Chandler | FABBH |
Party | Candidate | Votes | % | ±% | |
---|---|---|---|---|---|
For A Better Broken Hill | 5,237 | 50.4 | |||
Team Broken Hill | 2,549 | 24.5 | |||
Labor | 2,263 | 21.8 | |||
Independent | Gigi Barbe | 346 | 3.3 | ||
Total formal votes | 10,395 | 93.4 | |||
Informal votes | 732 | 6.6 | |||
Turnout | 11,127 | 83.4 | |||
Party total seats | Seats | ± | |||
For A Better Broken Hill | 5 | ||||
Team Broken Hill | 2 | ||||
Labor | 2 | 2 | |||
Elected councillor | Party | |
---|---|---|
Heather Crichton | Labor | |
George Mannah | Labor | |
Pascale Esber | Labor | |
David Hull | Liberal | |
Hugo Robinson | Liberal | |
Ned Cutcher | Greens |
Party | Candidate | Votes | % | ±% | |
---|---|---|---|---|---|
Labor | 9,002 | 52.2 | +1.1 | ||
Liberal | 4,050 | 23.5 | −2.4 | ||
Greens | 2,196 | 12.7 | +12.7 | ||
Independent | 1,277 | 7.4 | +7.4 | ||
Major Independent Group | 725 | 4.2 | +4.2 | ||
Total formal votes | 17,250 | 94.4 | |||
Informal votes | 1,030 | 5.6 | |||
Turnout | 18,280 | 87.0 | |||
Party total seats | Seats | ± | |||
Labor | 3 | ||||
Liberal | 2 | ||||
Greens | 1 | 1 | |||
Elected councillor | Party | |
---|---|---|
Duncan Dey | Greens | |
Cate Coorey | Independent (Group B) | |
Mark Swivel | Mark Swivel Team | |
Sama Balson | Byron Independents | |
Asren Pugh | Labor | |
Sarah Ndiaye | Greens | |
Peter Westheimer | Byron Independents | |
Alan Hunter | Byron Alliance |
Party | Candidate | Votes | % | ±% | |
---|---|---|---|---|---|
Greens | 3,755 | 21.2 | −21.7 | ||
Byron Independents | 3,627 | 20.5 | |||
Mark Swivel Team | 2,969 | 16.7 | |||
Independent (Group B) | 2,633 | 14.8 | |||
Labor | 2,196 | 12.4 | |||
Byron Alliance | 1,235 | 7.0 | |||
Byron Shire Action Group | 975 | 5.5 | |||
Independent | John Anderson | 345 | 1.9 | ||
Total formal votes | 17,735 | 94.6 | |||
Informal votes | 1,021 | 5.4 | |||
Turnout | 18,756 | 73.8 | |||
Party total seats | Seats | ± | |||
Independent | 5 | 3 | |||
Greens | 2 | 1 | |||
Labor | 1 | 1 | |||
Party | Candidate | Votes | % | ±% | |
---|---|---|---|---|---|
Independent | Kevin Beatty (elected) | 1,859 | 23.7 | ||
Independent | Marlene Nash (elected) | 1,090 | 13.9 | ||
Independent | Andrew Pull (elected) | 726 | 9.3 | ||
Independent | Kathryn O'Ryan (elected) | 657 | 8.4 | ||
Independent | Andrew Rawson (elected) | 641 | 8.2 | ||
Independent | Jamie Jones (elected) | 638 | 8.1 | ||
Independent | Peter Batten (elected) | 511 | 6.5 | ||
Independent | Libby Oldham (elected) | 378 | 4.8 | ||
Independent | Aaron Pearson | 375 | 4.8 | ||
Independent | Kevin Walker | 293 | 3.7 | ||
Independent | Jenny Weaver (elected) | 250 | 3.2 | ||
Independent | Paul Mullins | 205 | 2.6 | ||
Total formal votes | 7,836 | 92.7 | |||
Informal votes | 618 | 7.3 | |||
Turnout | 8,454 | 84.0 |
Party | Votes | % | Swing | Seats | Change | ||
---|---|---|---|---|---|---|---|
Liberal | 27,148 | 44.0 | +12.0 | 4 | |||
Labor | 20,351 | 33.0 | +8.0 | 4 | |||
Independent | 13,913 | 22.5 | −20.5 | 2 | |||
Shooters, Fishers and Farmers | 314 | 0.5 | +0.5 | 0 | |||
Formal votes | 61,726 | 94.58 | |||||
Informal votes | 3,537 | 5.42 | |||||
Total | 65,263 | 100.0 |
Elected councillor | Party | |
---|---|---|
Therese Fedeli | Liberal | |
Ashleigh Cagney | Labor | |
Peter McLean | Independent |
Party | Candidate | Votes | % | ±% | |
---|---|---|---|---|---|
Liberal | 8,708 | 42.0 | |||
Labor | 7,539 | 36.4 | |||
Independent | 4,488 | 21.6 | |||
Total formal votes | 20,735 | 94.7 | |||
Informal votes | 1,159 | 5.3 | |||
Turnout | 21,894 | 86.7 |
Elected councillor | Party | |
---|---|---|
Lara Symkowiak | Liberal | |
Cindy Cagney | Labor | |
Usha Dommaraju | Liberal |
Party | Candidate | Votes | % | ±% | |
---|---|---|---|---|---|
Liberal | 11,291 | 49.1 | |||
Labor | 8,119 | 35.3 | |||
Independent (Group B) | 2,266 | 9.9 | |||
Independent (Group D) | 710 | 3.1 | |||
Shooters, Fishers, Farmers | Kadeja Assaad | 314 | 1.4 | ||
Independent | Muhammad Farooq | 275 | 1.2 | ||
Total formal votes | 22,975 | 94.4 | |||
Informal votes | 1,366 | 5.6 | |||
Turnout | 24,341 | 86.0 |
Elected councillor | Party | |
---|---|---|
Russel Zammit | Liberal | |
Eva Campbell | Independent | |
Paul Farrow | Labor |
Party | Candidate | Votes | % | ±% | |
---|---|---|---|---|---|
Liberal | 7,149 | 39.7 | |||
Independent (Group A) | 5,849 | 32.5 | |||
Labor | 4,693 | 26.0 | |||
Independent | Mick Jackson | 256 | 1.4 | ||
Independent | Valerie Tarela-Moyes | 69 | 0.4 | ||
Total formal votes | 18,016 | 94.7 | |||
Informal votes | 1,012 | 5.3 | |||
Turnout | 19,028 | 85.2 |
Elected councillor | Party | |
---|---|---|
George Brticevic | Labor | |
Meg Oates | Labor | |
Darcy Lound | Labor | |
Margaret Chivers | Labor | |
Rey Manoto | Labor | |
Masood Chowdhury | Labor | |
Karen Hunt | Labor | |
George Greiss | Liberal | |
Marian George | Liberal | |
Riley Munro | Liberal | |
John Chew | Liberal | |
Matt Stellino | Animal Justice | |
Joshua Cotter | Community First | |
Masud Khalil | Community Voice | |
Warren Morrison | TLC |
Party | Candidate | Votes | % | ±% | |
---|---|---|---|---|---|
Labor | 39,162 | 43.8 | +0.5 | ||
Liberal | 22,056 | 24.7 | +8.2 | ||
Community First Team | 7,561 | 8.5 | −0.4 | ||
Totally Locally Committed | 4,809 | 5.4 | −4.6 | ||
Community Voice | 4,388 | 4.9 | |||
Animal Justice | 4,261 | 4.8 | +4.8 | ||
Greens | 4,057 | 4.5 | −0.4 | ||
Campbelltown Independents | 2,857 | 3.2 | |||
Independent | Mukesh Chand | 98 | 0.1 | ||
Independent | Mick Allen | 88 | 0.1 | ||
Total formal votes | 89,337 | 93.7 | |||
Informal votes | 6,011 | 6.3 | |||
Turnout | 95,348 | 84.4 | |||
Party total seats | Seats | ± | |||
Labor | 7 | ||||
Liberal | 4 | 1 | |||
Community First Team | 1 | ||||
Totally Locally Committed | 1 | 1 | |||
Community Voice | 1 | 1 | |||
Animal Justice | 1 | 1 | |||
Greens | 0 | 1 | |||
Elected councillor | Party | |
---|---|---|
Michael Megna | Liberal | |
Stephanie Di Pasqua | Liberal | |
Anthony Bazouni | Liberal | |
Julia Little | Labor | |
Andrew Ferguson | Labor | |
Joseph Cordaro | OLC | |
Carmela Ruggeri | OLC | |
Charles Jago | Greens |
Party | Candidate | Votes | % | ±% | |
---|---|---|---|---|---|
Liberal | 14,126 | 29.8 | −8.8 | ||
Labor | 13,917 | 29.3 | −6.1 | ||
Our Local Community | 12,867 | 27.1 | +27.1 | ||
Greens | 4,653 | 9.8 | −1.5 | ||
Independent | 1,909 | 4.0 | −4.2 | ||
Total formal votes | 47,472 | 95.4 | |||
Informal votes | 2,312 | 4.6 | |||
Turnout | 49,784 | 85.6 | |||
Party total seats | Seats | ± | |||
Liberal | 3 | ||||
Labor | 2 | 1 | |||
Our Local Community | 2 | 2 | |||
Greens | 1 | ||||
Independent | 0 | 1 | |||
Party | Votes | % | Swing | Seats | Change | ||
---|---|---|---|---|---|---|---|
Labor | 83724 | 47.4 | +0.0 | 9 | |||
Liberal | 52960 | 30.0 | +0.6 | 5 | |||
Greens | 6,608 | 3.7 | −4.8 | 0 | 1 | ||
Independent | 16,221 | 9.1 | +4.6 | 0 | |||
Barbara Coorey Independent Group | 9,027 | 5.1 | +5.1 | 1 | 1 | ||
Our Local Community | 5105 | 2.9 | −7.2 | 0 | |||
Animal Justice | 2,746 | 8.2 | +8.2 | 0 | |||
Communist League | 99 | 0.1 | 0 | ||||
Formal votes | 176,490 |
Elected councillor | Party | |
---|---|---|
Khal Asfour | Labor | |
Bilal El-Hayek | Labor | |
George Zakhia | Liberal |
Party | Candidate | Votes | % | ±% | |
---|---|---|---|---|---|
Labor | 19,848 | 58.3 | |||
Liberal | 10,412 | 30.6 | |||
Independent | 3,802 | 11.2 | |||
Total formal votes | 34,062 | 93.5 | |||
Informal votes | 2,378 | 6.5 | |||
Turnout | 36,440 | 80.9 |
Elected councillor | Party | |
---|---|---|
Rachelle Harika | Labor | |
Christopher Cahill | Labor | |
Charlie Ishac | Liberal |
Party | Candidate | Votes | % | ±% | |
---|---|---|---|---|---|
Labor | 17,194 | 51.9 | |||
Liberal | 9,991 | 30.1 | |||
Independent | 5,968 | 18.0 | |||
Total formal votes | 33,153 | 92.9 | |||
Informal votes | 2,547 | 7.1 | |||
Turnout | 35,700 | 80.3 |
Elected councillor | Party | |
---|---|---|
Clare Raffan | Labor | |
Jessie Nguyen | Liberal | |
Barbara Coorey | BCIG |
Party | Candidate | Votes | % | ±% | |
---|---|---|---|---|---|
Labor | 12,708 | 34.1 | |||
Barbara Coorey Independent Group | 9,027 | 24.2 | +24.2 | ||
Liberal | 8,834 | 23.7 | |||
Greens | 6,608 | 17.7 | |||
Communist League | Linda Harris | 99 | 0.3 | ||
Total formal votes | 37,276 | 94.2 | |||
Informal votes | 2,310 | 5.8 | |||
Turnout | 39,586 | 85.1 |
Elected councillor | Party | |
---|---|---|
David Walsh | Labor | |
Linda Downey | Labor | |
Charbel Abouraad | Liberal |
Party | Candidate | Votes | % | ±% | |
---|---|---|---|---|---|
Labor | 16,123 | 41.9 | |||
Liberal | 14,031 | 36.5 | |||
Our Local Community | 5,105 | 13.3 | |||
Independent | 2,758 | 7.2 | |||
Independent | Chris Brogan | 429 | 1.1 | ||
Total formal votes | 38,446 | 94.9 | |||
Informal votes | 2,080 | 5.1 | |||
Turnout | 40,526 | 86.3 |
Elected councillor | Party | |
---|---|---|
Karl Saleh | Labor | |
Bhadra Waida | Labor | |
Sazeda Akter | Liberal |
Party | Candidate | Votes | % | ±% | |
---|---|---|---|---|---|
Labor | 17,851 | 53.2 | |||
Liberal | 9,692 | 28.9 | |||
Independent | 3,264 | 9.7 | |||
Animal Justice | 2,746 | 8.2 | +8.2 | ||
Total formal votes | 33,553 | 92.5 | |||
Informal votes | 2,724 | 7.5 | |||
Turnout | 36,277 | 80.7 |
Party | Votes | % | Swing | Seats | Change | ||
---|---|---|---|---|---|---|---|
Independent | 694 | 100.0 | +0.0 | 10 | |||
Formal votes | 694 | 97.9 | |||||
Informal votes | 15 | 2.1 | |||||
Total | 709 | 100.00 | |||||
Registered voters / turnout | 1,792 | 39.56 |
Party | Candidate | Votes | % | ±% | |
---|---|---|---|---|---|
Independent | Darryl Jardine (elected) | 235 | 33.9 | ||
Independent | Heather Lyall (elected) | 147 | 21.2 | ||
Independent | Geoff Peters (elected) | 73 | 10.5 | ||
Independent | David Fensom (elected) | 72 | 10.4 | ||
Independent | Julie Potter (elected) | 70 | 10.1 | ||
Independent | Allan Hutchison | 52 | 7.5 | ||
Independent | Anne Moore | 45 | 6.5 | ||
Total formal votes | 694 | 97.9 | |||
Informal votes | 15 | 2.1 | |||
Turnout | 709 | 78.3 |
Party | Candidate | Votes | % | ±% | |
---|---|---|---|---|---|
Independent | Mick Armstrong (elected) | unopposed | |||
Independent | Leon Cashmere (elected) | unopposed | |||
Independent | Beverley Furner (elected) | unopposed | |||
Independent | William Kite (elected) | unopposed | |||
Independent | Damon Liddicoat (elected) | unopposed | |||
Registered electors | 887 |
Party | Votes | % | Swing | Seats | Change | ||
---|---|---|---|---|---|---|---|
Labor | 15,136 | 42.5 | −6.2 | 5 | 2 | ||
Independent | 9,297 | 26.1 | +4.3 | 4 | 2 | ||
Liberal | 7676 | 21.6 | −0.9 | 3 | |||
Greens | 3,509 | 9.9 | +2.8 | 0 | |||
Formal votes | 35,618 | 93.99 | |||||
Informal votes | 2,274 | 6.01 | |||||
Total | 37,892 | 100.00 |
Elected councillor | Party | |
---|---|---|
James Hawkins | Labor | |
Jessica Jurd | Independent | |
Paul Dunn | Liberal |
Party | Candidate | Votes | % | ±% | |
---|---|---|---|---|---|
Labor | 3,273 | 35.7 | |||
Independent | 2,587 | 28.2 | |||
Liberal | 1,939 | 21.2 | |||
Greens | 988 | 10.8 | |||
Independent | Allan Stapleford | 389 | 4.2 | ||
Total formal votes | 9,176 | 92.8 | |||
Informal votes | 713 | 7.2 | |||
Turnout | 83.6 |
Elected councillor | Party | |
---|---|---|
Anthony Burke | Labor | |
Ian Olsen | Independent | |
John Moores | Liberal |
Party | Candidate | Votes | % | ±% | |
---|---|---|---|---|---|
Labor | 3,146 | 39.9 | |||
Independent | 2,512 | 31.8 | |||
Liberal | 1,630 | 20.7 | |||
Greens | 605 | 7.7 | |||
Total formal votes | 7,893 | 94.1 | |||
Informal votes | 495 | 5.9 | |||
Turnout | 82.4 |
Elected councillor | Party | |
---|---|---|
Anne-Marie Sander | Labor | |
Darren Watton | Independent | |
Karen Jackson | Liberal |
Party | Candidate | Votes | % | ±% | |
---|---|---|---|---|---|
Labor | 4,180 | 43.8 | |||
Liberal | 2,375 | 24.9 | |||
Independent | 2,047 | 21.4 | |||
Greens | 950 | 9.9 | |||
Total formal votes | 9,552 | 94.6 | |||
Informal votes | 547 | 5.4 | |||
Turnout | 83.2 |
Elected councillor | Party | |
---|---|---|
Rosa Grine | Labor | |
Mitchell Hill | Labor | |
Paul Paynter | Independent |
Party | Candidate | Votes | % | ±% | |
---|---|---|---|---|---|
Labor | 4,537 | 50.4 | |||
Independent | 1,762 | 19.6 | |||
Liberal | 1,732 | 19.3 | |||
Greens | 966 | 10.7 | |||
Total formal votes | 8,997 | 94.5 | |||
Informal votes | 519 | 5.5 | |||
Turnout | 84.5 |
Party | Candidate | Votes | % | ±% | |
---|---|---|---|---|---|
Independent | Jeff Smith (elected) | 6,022 | 19.6 | ||
Independent | Debrah Novak (elected) | 3,622 | 11.8 | ||
Independent | Ian Tiley (elected) | 2,637 | 8.6 | ||
Independent National | Allison Whaites (elected) | 2,403 | 7.8 | ||
Independent | Bill Day (elected) | 2,039 | 6.7 | ||
Greens | Greg Clancy (elected) | 2,592 | 8.5 | ||
Independent National | Peter Johnstone (elected) | 2,212 | 7.2 | ||
Independent | Karen Toms (elected) | 1,658 | 5.4 | ||
Independent | Steve Pickering (elected) | 1,536 | 5.0 | ||
Independent Labor | Peter Ellem | 1,494 | 4.9 | ||
Independent | Ash Gibbons | 1,189 | 3.9 | ||
Independent | Pete Hanson | 1,189 | 3.9 | ||
Independent National | Donald Scott | 702 | 2.3 | ||
Independent | Phil Belletty | 661 | 2.2 | ||
Independent | Jeffrey Fuller | 357 | 1.2 | ||
Independent | Warren Lang | 348 | 1.1 | ||
Total formal votes | 30,661 | 92.9 | |||
Informal votes | 2,358 | 7.1 | |||
Turnout | 85.7 | ||||
Party total votes | |||||
Independent | 23,850 | 77.8 | |||
Independent National | 5,317 | 17.3 | |||
Independent Labor | 1,494 | 4.9 | |||
Party total seats | Seats | ± | |||
Independent | 7 | ||||
Independent National | 2 | 1 | |||
Independent Labor | 0 | 1 |
Elected councillor | Party | |
---|---|---|
Scott Wolgamot | Team Moose | |
George Cecato | Coffs Coast First | |
Rodger Pryce | TWFI | |
Tegan Swan | Ind. National | |
Tony Judge | Labor | |
Julie Sechi | Team Moose | |
Jonathan Cassell | Greens | |
Sally Townley | Independent (Group F) |
Party | Candidate | Votes | % | ±% | |
---|---|---|---|---|---|
Team Moose | 9,838 | 22.6 | |||
Together We'll Fix It | 6,316 | 14.5 | |||
Coffs Coast First | 6,192 | 14.2 | |||
Independent National | 4,638 | 10.6 | |||
Labor | 4,623 | 10.6 | |||
Independent (Group F) | 4,047 | 9.3 | |||
Greens | 3,933 | 9.0 | |||
Independent (Group E) | 1,743 | 4.0 | |||
Independent (Group A) | 1,704 | 3.9 | |||
Independent | Donna Pike | 413 | 0.9 | ||
Liberal Democrats | 140 | 0.3 | |||
Total formal votes | 43,587 | 92.7 | |||
Informal votes | 3,410 | 7.3 | |||
Turnout | 46,997 | 82.9 |
Party | Candidate | Votes | % | ±% | |
---|---|---|---|---|---|
Independent | Peter Abbott (elected) | unopposed | |||
Independent | Tony Chaplain (elected) | unopposed | |||
Independent | Janine Lea-Barrett (elected) | unopposed | |||
Independent | Jarrod Marsden (elected) | unopposed | |||
Independent | Peter Maxwell (elected) | unopposed | |||
Independent | Kain Neale (elected) | unopposed | |||
Independent | Julie Payne (elected) | unopposed | |||
Independent | Lillian Simpson (elected) | unopposed | |||
Independent | Bob Sinclair (elected) | unopposed | |||
Independent | Harley Toomey (elected) | unopposed | |||
Independent | Kate Winders (elected) | unopposed | |||
Registered electors | 2,829 |
Party | Candidate | Votes | % | ±% | |
---|---|---|---|---|---|
Independent | Michael Prince (elected) | 1,537 | 77.28 | +77.28 | |
Independent | Jesse Cochrane Adolfson | 452 | 22.72 | +22.72 | |
Total formal votes | 1,989 | 98.42 | |||
Informal votes | 32 | 1.58 | |||
Turnout | 2,021 | 80.0 | |||
Independent hold | Swing | ||||
Party | Candidate | Votes | % | ±% | |
---|---|---|---|---|---|
Independent | Bronwyn Hatty (elected) | 638 | 24.8 | ||
Shooters, Fishers, Farmers | Jeremy Crocker (elected) | 413 | 16.0 | ||
Independent | Colin McKinnon (elected) | 286 | 11.1 | ||
Independent | David McCann (elected) | 266 | 10.3 | ||
Independent | Kathy Maslin (elected) | 265 | 10.3 | ||
Independent | Alan White (elected) | 212 | 8.2 | ||
Independent | Bruce Hutcheon (elected) | 185 | 7.2 | ||
Independent | Trevor Jose | 118 | 4.6 | ||
Independent National | Wayne Lewis (elected) | 110 | 4.3 | ||
Independent | Garth Perkin (elected) | 82 | 3.2 | ||
Total formal votes | 2,576 | 96.4 | |||
Informal votes | 97 | 3.6 | |||
Turnout | 2,673 | 82.5 |
Party | Candidate | Votes | % | ±% | |
---|---|---|---|---|---|
Independent | Tim Horan (elected) | 346 | 16.5 | ||
Independent | Ahmad Karanouh (elected) | 267 | 12.7 | ||
Independent | Karen Churchill (elected) | 184 | 8.8 | ||
Independent | Adam Cohen (elected) | 174 | 8.3 | ||
Independent | Bill Fisher (elected) | 173 | 8.3 | ||
Independent | Brian Sommerville (elected) | 166 | 7.9 | ||
Independent | Barbara Deans (elected) | 127 | 6.1 | ||
Independent | Pat Cullen (elected) | 107 | 5.1 | ||
Independent | Steven 'Jay' Smith | 107 | 5.1 | ||
Independent | Robert Thomas | 100 | 4.8 | ||
Independent | Terry Lees (elected) | 97 | 4.6 | ||
Independent | Chris Newbold | 73 | 3.5 | ||
Independent | Narelle Mayoh | 56 | 2.7 | ||
Independent | Tracy Mood | 46 | 2.2 | ||
Independent | Robert Ryan | 41 | 2.0 | ||
Independent | Luke Day | 18 | 0.9 | ||
Independent | Karen McCusker | 14 | 0.7 | ||
Total formal votes | 2,096 | 97.6 | |||
Informal votes | 51 | 2.4 | |||
Turnout | 2,147 | 78.6 |
Party | Candidate | Votes | % | ±% | |
---|---|---|---|---|---|
Independent | Abb McAlister (elected) | 1,424 | 20.6 | ||
Independent | Charlie Sheahan (elected) | 963 | 13.9 | ||
Independent | Gil Kelly (elected) | 901 | 13.0 | ||
Independent | Les Boyd (elected) | 753 | 10.9 | ||
Independent | Leigh Bowden (elected) | 605 | 8.7 | ||
Independent | Penny Nicholson (elected) | 451 | 6.5 | ||
Independent | Logan Collins (elected) | 444 | 6.4 | ||
Independent | Trevor Glover (elected) | 417 | 6.0 | ||
Independent | David Ferguson | 358 | 5.2 | ||
Independent | David Graham (elected) | 269 | 3.9 | ||
Independent | Rosalind Wight | 210 | 3.0 | ||
Independent | Maxine Hayes | 127 | 1.8 | ||
Total formal votes | 6,922 | 95.7 | |||
Informal votes | 310 | 4.3 | |||
Turnout | 7,232 | 84.1 |
Party | Candidate | Votes | % | ±% | |
---|---|---|---|---|---|
Independent | Bill West (elected) | 2,132 | 27.5 | ||
Independent | Erin Watt (elected) | 1,138 | 14.7 | ||
Independent | Sharon D'Elboux (elected) | 705 | 9.1 | ||
Independent | Nikki Kiss (elected) | 676 | 8.7 | ||
Independent | Cheryl Downing (elected) | 527 | 6.8 | ||
Independent | Peter Wright (elected) | 428 | 5.5 | ||
Independent | Paul Smith (elected) | 386 | 5.0 | ||
Independent National | Ruth Fagan (elected) | 265 | 3.4 | ||
Independent | Donna Peters | 260 | 3.3 | ||
Independent National | Ian Docker | 235 | 3.0 | ||
Independent | Rodrick Buhr | 230 | 3.0 | ||
Independent | Judi Smith (elected) | 216 | 2.8 | ||
Independent | Michael Nobes | 152 | 2.0 | ||
Independent | Alex Cozadinos | 145 | 1.9 | ||
Independent | Rebecca Morgan | 143 | 1.8 | ||
Independent | Simon Bray | 126 | 1.6 | ||
Total formal votes | 7,764 | 94.2 | |||
Informal votes | 480 | 5.8 | |||
Turnout | 8,244 | 85.0 |
The Liberal Party did not endorse any candidates, including its five councillors elected in 2017. [48]
Party | Votes | % | Swing | Seats | Change | ||
---|---|---|---|---|---|---|---|
Labor | 47,343 | 48.6 | +9.4 | 8 | |||
Our Local Community | 27,547 | 28.3 | +14.0 | 4 | 2 | ||
Independent Liberal | 12,467 | 12.8 | −13.4 [lower-alpha 3] | 2 | 3 [lower-alpha 3] | ||
The Independents | 6,388 | 6.5 | +6.5 | 1 | 1 | ||
Greens | 2,748 | 2.8 | +1.1 | 0 | |||
Independent | 968 | 1.0 | 0 | ||||
Formal votes | 97,461 | 96.48 |
Elected councillor | Party | |
---|---|---|
Ola Hamed | Labor | |
Steve Christou | OLC | |
Joseph Rahme | Ind. Liberal |
Party | Candidate | Votes | % | ±% | |
---|---|---|---|---|---|
Labor | 8,222 | 42.5 | |||
Our Local Community | 6,252 | 32.4 | |||
Independent Liberal | 4,274 | 22.1 | |||
Independent | Carly Lewis | 422 | 2.2 | ||
Independent | Jacob Abraham | 108 | 0.6 | ||
Independent | Ibtisam Koreel | 47 | 0.2 | ||
Total formal votes | 19,325 | 93.0 | |||
Informal votes | 1,447 | 7.0 | |||
Turnout | 79.8 |
Elected councillor | Party | |
---|---|---|
Diane Colman | Labor | |
Eddy Sarkis | OLC | |
Greg Cummings | The Independents |
Party | Candidate | Votes | % | ±% | |
---|---|---|---|---|---|
Labor | 6,838 | 32.9 | |||
Our Local Community | 7,228 | 34.8 | |||
The Independents | 6,388 | 30.7 | +30.7 | ||
Independent Liberal | 325 | 1.6 | |||
Total formal votes | 20,779 | 93.9 | |||
Informal votes | 1,357 | 6.1 | |||
Turnout | 85.4 |
Elected councillor | Party | |
---|---|---|
Kun Huang | Labor | |
Sabrin Farooqui | Labor | |
Helen Hughes | OLC |
Party | Candidate | Votes | % | ±% | |
---|---|---|---|---|---|
Labor | 11,789 | 59.7 | |||
Our Local Community | 4,307 | 21.8 | |||
Independent Liberal | 3,262 | 16.5 | |||
Independent | Khaled Sunkesula | 391 | 2.0 | ||
Total formal votes | 19,749 | 94.0 | |||
Informal votes | 1,267 | 6.0 | |||
Turnout | 84.9 |
Elected councillor | Party | |
---|---|---|
Glenn Elmore | Labor | |
Mohamad Hussein | Labor | |
Paul Garrard | OLC |
Party | Candidate | Votes | % | ±% | |
---|---|---|---|---|---|
Labor | 11,291 | 64.9 | |||
Our Local Community | 6,106 | 35.1 | |||
Total formal votes | 17,397 | 92.1 | |||
Informal votes | 1,500 | 7.9 | |||
Turnout | 18,897 | 76.1 |
Elected councillor | Party | |
---|---|---|
Suman Saha | Labor | |
Lisa Lake | Labor | |
Michael Zaiter | Ind. Liberal |
Party | Candidate | Votes | % | ±% | |
---|---|---|---|---|---|
Labor | 9,203 | 45.5 | |||
Independent Liberal | 4,606 | 22.8 | |||
Our Local Community | 3,654 | 18.1 | |||
Greens | 2,748 | 13.6 | |||
Total formal votes | 20,211 | 94.7 | |||
Informal votes | 1,134 | 5.3 | |||
Turnout | 21,345 | 83.4 |
Party | Votes | % | Swing | Seats | Change | ||
---|---|---|---|---|---|---|---|
Independent | 16,684 | 57.1 | 6 | ||||
Labor | 6,871 | 23.5 | 3 | ||||
Ben Shields Team | 5,687 | 19.4 | 1 | ||||
Formal votes | 29,242 |
Elected councillor | Party | |
---|---|---|
Mathew Dickerson | Independent | |
Vicki Etheridge | Labor |
Party | Candidate | Votes | % | ±% | |
---|---|---|---|---|---|
Independent | Mathew Dickerson | 2,999 | 56.4 | ||
Labor | 1,457 | 27.4 | |||
Ben Shields Team | 864 | 16.2 | |||
Total formal votes | 5,320 | 95.8 | |||
Informal votes | 232 | 4.2 | |||
Turnout | 5,552 | 80.9 |
Elected councillor | Party | |
---|---|---|
Lewis Burns | Independent (Group B) | |
Damien Mahon | Independent |
Party | Candidate | Votes | % | ±% | |
---|---|---|---|---|---|
Independent (Group B) | 1,498 | 28.6 | |||
Ben Shields Team | 1,231 | 23.5 | |||
Independent | Damien Mahon | 1,041 | 19.9 | ||
Labor | Tatum Moore | 601 | 11.8 | ||
Independent | Rod Fardell | 648 | 12.4 | ||
Independent | Ana Pateman | 212 | 4.1 | ||
Total formal votes | 5,231 | 94.7 | |||
Informal votes | 294 | 5.3 | |||
Turnout | 80.9 |
Elected councillor | Party | |
---|---|---|
Matthew Wright | Independent | |
Pamela Wells | Labor |
Party | Candidate | Votes | % | ±% | |
---|---|---|---|---|---|
Independent | Matthew Wright | 1,674 | 26.6 | ||
Labor | 1,377 | 21.9 | |||
Ben Shields Team | 1,101 | 17.5 | |||
Independent (Group B) | 930 | 14.8 | |||
Independent | Matthew Smith | 432 | 6.9 | ||
Independent | Greg Matthews | 777 | 12.4 | ||
Total formal votes | 6,291 | 94.9 | |||
Informal votes | 337 | 5.1 | |||
Turnout | 80.8 |
Elected councillor | Party | |
---|---|---|
Shibli Chowdhury | Independent | |
Josh Black | Labor |
Party | Candidate | Votes | % | ±% | |
---|---|---|---|---|---|
Labor | 2,320 | 33.7 | |||
Independent | Shibli Chowdhury | 1,911 | 27.8 | ||
Ben Shields Team | 1,360 | 19.8 | |||
Independent | Kevin Parker | 1,285 | 18.7 | ||
Total formal votes | 6,876 | 95.5 | |||
Informal votes | 324 | 4.5 | |||
Turnout | 85.8 |
Elected councillor | Party | |
---|---|---|
Richard Ivey | Independent | |
Jess Gough | Ben Shields Team |
Party | Candidate | Votes | % | ±% | |
---|---|---|---|---|---|
Independent | Richard Ivey | 1,275 | 23.1 | ||
Ben Shields Team | 1,131 | 20.5 | |||
Labor | 1,116 | 20.2 | |||
Independent | Anne Jones | 1,013 | 18.3 | ||
Independent | Lizzy George | 989 | 17.9 | ||
Total formal votes | 5,524 | 96.3 | |||
Informal votes | 212 | 3.7 | |||
Turnout | 5,736 | 83.7 |
Party | Votes | % | Swing | Seats | Change | ||
---|---|---|---|---|---|---|---|
Independent | 6,135 | 100.0 | 6 | ||||
Formal votes | 6,135 | 95.33 | |||||
Informal votes | 300 | 4.67 | |||||
Total | 6,435 | 100.0 |
Party | Candidate | Votes | % | ±% | |
---|---|---|---|---|---|
Independent | Michael Dowling (elected) | 828 | 41.7 | ||
Independent | Michael Tobin (elected) | 604 | 30.4 | ||
Independent | Stephen "Sparrow" Farrow | 291 | 14.6 | ||
Independent | John Connors | 264 | 13.3 | ||
Total formal votes | 1,987 | 95.6 | |||
Informal votes | 91 | 4.4 | |||
Turnout | 2,078 | 87.4 |
Party | Candidate | Votes | % | ±% | |
---|---|---|---|---|---|
Independent | Stephen Low (elected) | 946 | 44.9 | ||
Independent | Jessica Clark (elected) | 754 | 35.8 | ||
Independent | Alan Green | 407 | 19.3 | ||
Total formal votes | 2,107 | 95.7 | |||
Informal votes | 94 | 4.3 | |||
Turnout | 2,201 | 86.7 |
Party | Candidate | Votes | % | ±% | |
---|---|---|---|---|---|
Independent | Digby Rayward (elected) | 965 | 47.3 | ||
Independent | Bradley Bale (elected) | 613 | 30.0 | ||
Independent | Peter Millynn | 463 | 22.7 | ||
Total formal votes | 2,041 | 46.7 | |||
Informal votes | 115 | 5.3 | |||
Turnout | 2,156 | 85.7 |
Party | Candidate | Votes | % | ±% | |
---|---|---|---|---|---|
Independent | Pat Fogarty (elected) | 997 | 21.9 | ||
Independent | Paul Fellows (elected) | 783 | 17.2 | ||
Independent National | Peta Betts (elected) | 705 | 15.5 | ||
Independent | Shirlee Burge (elected) | 463 | 10.2 | ||
Independent | Linda Fawns (elected) | 398 | 8.7 | ||
Independent | Harold Clapham (elected) | 358 | 7.9 | ||
Independent | Peter Connell (elected) | 276 | 6.1 | ||
Independent | Tarria Moore (elected) | 211 | 4.6 | ||
Independent | Marc Petersen (elected) | 183 | 4.0 | ||
Independent | Shannon Sampson | 138 | 3.0 | ||
Independent | Narelle Whitham | 47 | 1.0 | ||
Total formal votes | 4,559 | 94.9 | |||
Informal votes | 245 | 5.1 | |||
Turnout | 4,804 | 75.8 |
Elected councillor | Party | |
---|---|---|
Rob Pollock | Prefer Pollock | |
Noel (Tubby) Harrison | A Better Council | |
Anthony Mayne | The Mayne Team | |
Amber Schutz | Advance Eurobodalla | |
David Grace | Labor | |
Alison Worthington | Greens | |
Peter Diskon | Prefer Pollock | |
Tanya Dannock | Advance Eurobodalla |
Party | Candidate | Votes | % | ±% | |
---|---|---|---|---|---|
Advance Eurobodalla | 5,012 | 20.1 | |||
Prefer Pollock | 4,644 | 18.7 | |||
The Mayne Team | 4,196 | 16.9 | |||
Labor | 3,752 | 15.1 | |||
A Better Council | 3,486 | 14.0 | |||
Greens | 2,684 | 10.8 | |||
Independent (Group G) | 1,101 | 4.4 | |||
Total formal votes | 24,875 | 93.3 | |||
Informal votes | 1,780 | 6.7 | |||
Turnout | 26,655 | 83.3 |
The Liberal Party did not endorse any candidates, including its three councillors elected in 2016. [56]
The election was conducted by the Australian Election Company. [56]
Party | Votes | % | Swing | Seats | Change | ||
---|---|---|---|---|---|---|---|
Frank Carbone | 39,445 | 42.5 | 6 | ||||
Women's Party | 18,774 | 20.2 | +20.2 | 3 | 3 | ||
Labor | 23,081 | 24.9 | −20.2 | 3 | 3 | ||
The Real Local | 3,468 | 3.7 | +3.7 | 0 | |||
Independent | 3,007 | 3.2 | 0 | ||||
Our Local Community | 2,880 | 3.1 | +3.1 | 0 | |||
Independent Liberal | 2,207 | 2.4 | −16.1 [lower-alpha 4] | 0 | 3 [lower-alpha 4] | ||
Formal votes | 92,862 |
Elected councillor | Party | |
---|---|---|
Milovan Karajcic | Frank Carbone | |
Charbel Saliba | Frank Carbone | |
Kien Ly | Labor | |
Carmen Lazar | Labor | |
Dai Le | Women's Party | |
Kevin Lam | Women's Party |
Party | Candidate | Votes | % | ±% | |
---|---|---|---|---|---|
Frank Carbone | 14,975 | 31.6 | |||
Labor | 12,838 | 27.0 | |||
Women's Party | 13,047 | 27.5 | +27.5 | ||
The Real Local | 3,468 | 7.3 | +7.3 | ||
Independent (Group D) | 2,988 | 6.3 | |||
Independent Liberal | Lachlan Hyde | 129 | 0.3 | ||
Independent | Huu Tam Luong | 19 | 0.0 | ||
Total formal votes | 47,464 | ||||
Turnout | 70.6 |
Elected councillor | Party | |
---|---|---|
Reni Barkho | Frank Carbone | |
Hugo Morvillo | Frank Carbone | |
Marie Saliba | Frank Carbone | |
Michael Mijatovic | Frank Carbone | |
George Barcha | Labor | |
Andrew Rohan | Women's Party |
Party | Candidate | Votes | % | ±% | |
---|---|---|---|---|---|
Frank Carbone | 24,470 | 53.9 | |||
Labor | 10,243 | 22.6 | |||
Women's Party | 5,727 | 12.6 | +12.6 | ||
Independent Liberal | 2,078 | 4.6 | |||
Our Local Community | 2,880 | 6.3 | +6.3 | ||
Total formal votes | 45,398 | ||||
Turnout | 73.6 |
Elected councillor | Party | |
---|---|---|
Patrick Bourke | Independent (Group A) | |
David Fahey | Independent (Group A) | |
Andrew Kennedy | Independent (Group C) | |
Aaron Nicholls | Independent (Group E) | |
Shaun Whitechurch | Independent (Group D) | |
Sally Hughes | Independent (Group B) | |
David Longley | Independent | |
Rowena Black | Independent | |
Gail Law | Independent |
Party | Candidate | Votes | % | ±% | |
---|---|---|---|---|---|
Independent (Group A) | 1,616 | 21.8 | |||
Independent (Group C) | 1,117 | 15.1 | |||
Independent (Group E) | 932 | 12.6 | |||
Independent | David Longley | 873 | 11.8 | ||
Independent (Group D) | 785 | 10.6 | |||
Independent (Group B) | 699 | 9.4 | |||
Independent | Rowena Black | 497 | 6.7 | ||
Independent | Gail Law | 280 | 3.8 | ||
Independent | David Harrison | 251 | 3.4 | ||
Independent | Janette Outram | 249 | 3.4 | ||
Independent | Mick Robson | 103 | 1.4 | ||
Total formal votes | 7,402 | 94.0 | |||
Informal votes | 1,780 | 6.0 | |||
Turnout | 7,877 | 79.6 |
Party | Candidate | Votes | % | ±% | |
---|---|---|---|---|---|
Independent | Phyllis Miller (elected) | 2,062 | 36.6 | ||
Independent | Steve Karaitiana (elected) | 577 | 10.3 | ||
Independent | Jenny Webb (elected) | 569 | 10.1 | ||
Independent | Margaret Duggan (elected) | 456 | 8.1 | ||
Independent | Aidan Clarke (elected) | 451 | 8.0 | ||
Independent | Maria Willis (elected) | 272 | 4.8 | ||
Independent | Chris Roylance (elected) | 267 | 4.7 | ||
Independent | Emma Henderson | 190 | 3.4 | ||
Independent | Brian Mattiske (elected) | 176 | 3.1 | ||
Independent | Graeme Miller | 164 | 2.9 | ||
Independent | Thomas Dwyer | 160 | 2.8 | ||
Independent | Michele Herbert (elected) | 142 | 2.5 | ||
Independent | Jeff Nicholson | 142 | 2.5 | ||
Total formal votes | 5,628 | 97.1 | |||
Informal votes | 170 | 2.9 | |||
Turnout | 5,798 | 83.1 |
Party | Votes | % | Swing | Seats | Change | ||
---|---|---|---|---|---|---|---|
Labor | 25,064 | 32.4 | −5.7 | 5 | 1 | ||
Liberal | 22,459 | 29.0 | −4.6 | 5 | |||
Residents and Ratepayers | 16,607 | 21.4 | +21.4 | 4 | 4 | ||
Independent | 10,279 | 13.3 | −5.1 | 0 | 3 | ||
Georges River Association | 2,105 | 2.7 | +2.7 | 1 | 1 | ||
Kogarah Residents' Association | 919 | 1.2 | −3.4 | 0 | 1 | ||
Communist League | 17 | 0.0 | +0.0 | 0 | |||
Formal votes | 77,450 | 94.56 | |||||
Informal votes | 4,456 | 5.44 | |||||
Total | 81,906 | 100.00 |
Elected councillor | Party | |
---|---|---|
Sam Elmir | Liberal | |
Natalie Mort | GRRRP | |
Kathryn Landsberry | Labor |
Party | Candidate | Votes | % | ±% | |
---|---|---|---|---|---|
Liberal | 5,109 | 31.7 | |||
Residents and Ratepayers | 4,276 | 26.5 | +26.5 | ||
Labor | 3,963 | 24.6 | |||
Independent (Group D) | 2,218 | 13.7 | |||
Independent (Group C) | 576 | 3.6 | |||
Total formal votes | 16,142 | 95.3 | |||
Informal votes | 795 | 4.7 | |||
Turnout | 16,937 | 87.7 |
Elected councillor | Party | |
---|---|---|
Colleen Symington | Labor | |
Nancy Liu | Liberal | |
Benjamin Wang | GRA |
Party | Candidate | Votes | % | ±% | |
---|---|---|---|---|---|
Labor | 4,468 | 30.2 | |||
Liberal | 3,579 | 24.2 | |||
Georges River Association | 2,105 | 14.2 | +14.2 | ||
Residents and Ratepayers | 1,617 | 10.9 | +10.9 | ||
Independent (Group A) | 1,638 | 11.1 | |||
Independent (Group D) | 1,349 | 9.1 | |||
Communist League | Robert Aiken | 17 | 0.1 | +0.1 | |
Total formal votes | 14,773 | 93.4 | |||
Informal votes | 1,039 | 6.6 | |||
Turnout | 15,812 | 85.9 |
Elected councillor | Party | |
---|---|---|
Nick Katris | Labor | |
Elise Borg | GRRRP | |
Sam Stratikopoulos | Liberal |
Party | Candidate | Votes | % | ±% | |
---|---|---|---|---|---|
Labor | 4,653 | 29.5 | |||
Residents and Ratepayers | 3,681 | 23.3 | +23.3 | ||
Liberal | 3,667 | 23.2 | |||
Independent | 2,823 | 17.9 | |||
Kogarah Residents' Association | 919 | 5.8 | |||
Independent | Greg McAleer | 54 | 0.3 | ||
Total formal votes | 15,797 | 93.9 | |||
Informal votes | 1,029 | 6.1 | |||
Turnout | 16,826 | 84.3 |
Elected councillor | Party | |
---|---|---|
Warren Tegg | Labor | |
Nick Smerdely | Liberal | |
Christina Jamieson | GRRRP |
Party | Candidate | Votes | % | ±% | |
---|---|---|---|---|---|
Labor | 5,054 | 35.0 | |||
Liberal | 4,908 | 34.0 | |||
Residents and Ratepayers | 3,044 | 21.1 | +21.1 | ||
Independent (Group D) | 866 | 6.0 | |||
Independent (Group B) | 327 | 2.3 | |||
Independent | David Perry | 128 | 0.9 | ||
Independent | Christian Stojkov | 84 | 0.6 | ||
Independent | Damian Cook | 41 | 0.3 | ||
Total formal votes | 14,452 | 94.3 | |||
Informal votes | 880 | 5.7 | |||
Turnout | 15,332 | 86.5 |
Elected councillor | Party | |
---|---|---|
Kevin Greene | Labor | |
Lou Konjarski | Liberal | |
Peter Mahoney | GRRRP |
Party | Candidate | Votes | % | ±% | |
---|---|---|---|---|---|
Labor | 6,926 | 42.5 | |||
Liberal | 5,196 | 31.9 | |||
Residents and Ratepayers | 3,989 | 24.5 | +24.5 | ||
Independent | Dina Ghazal | 175 | 1.1 | ||
Total formal votes | 16,286 | 95.8 | |||
Informal votes | 713 | 4.2 | |||
Turnout | 16,999 | 87.1 |
Party | Candidate | Votes | % | ±% | |
---|---|---|---|---|---|
Independent | Paul Mann (elected) | 337 | 13.5 | ||
Independent | Ash Walker (elected) | 328 | 13.2 | ||
Independent | Ian Freeth (elected) | 263 | 10.6 | ||
Independent | Doug Batten (elected) | 262 | 10.5 | ||
Independent | Gail Babbage (elected) | 238 | 9.6 | ||
Independent | Noel Mudford (elected) | 206 | 8.3 | ||
Independent | Amber Bunter (elected) | 193 | 7.7 | ||
Independent | Brian Mockler (elected) | 188 | 7.5 | ||
Independent | Gregory Peart (elected) | 160 | 6.4 | ||
Independent | Helen Naef | 160 | 6.4 | ||
Independent | Nicholas White | 157 | 6.3 | ||
Total formal votes | 2,492 | 97.6 | |||
Informal votes | 60 | 2.4 | |||
Turnout | 2,552 | 80.6 |
Party | Candidate | Votes | % | ±% | |
---|---|---|---|---|---|
Independent | Rob Banham (elected) | 1,066 | 19.4 | ||
Greens | Carol Sparks (elected) | 638 | 11.6 | ||
Independent | Troy Arandale (elected) | 637 | 11.6 | ||
Independent | Timothy Alt (elected) | 612 | 11.1 | ||
Independent | Jack Parry (elected) | 534 | 9.7 | ||
Independent | Lara Gresham (elected) | 389 | 7.1 | ||
Independent | Andrew Parsons (elected) | 311 | 5.7 | ||
Independent | Jeff Smith | 298 | 5.4 | ||
Independent | Benjamin Thorpe | 223 | 4.1 | ||
Independent | Richard Moon | 207 | 3.8 | ||
Independent | Dianne Newman | 177 | 3.2 | ||
Independent | Sheryn Nourse | 177 | 3.2 | ||
Independent | Rosemary Curtis | 173 | 3.1 | ||
Independent | David Renn | 54 | 1.0 | ||
Total formal votes | 5,496 | 97.2 | |||
Informal votes | 161 | 2.8 | |||
Turnout | 5,657 | 90.4 |
Elected councillor | Party | |
---|---|---|
Bob Kirk | Independent | |
Jason Shephard | Labor | |
Michael Prevedello | Independent | |
Daniel Strickland | Independent | |
Andy Wood | SFF | |
James Carol | Independent | |
Peter Walker | Independent | |
Steven Ruddell | Independent | |
Andrew Banfield | Independent |
Party | Candidate | Votes | % | ±% | |
---|---|---|---|---|---|
Independent | Bob Kirk | 4,000 | 23.0 | ||
Labor | 3,017 | 17.3 | |||
Independent | Michael Prevedello | 1,554 | 8.9 | ||
Independent | Daniel Strickland | 1,425 | 8.2 | ||
Shooters, Fishers, Farmers | Andy Wood | 1,268 | 7.3 | ||
Independent | James Carol | 1,056 | 6.1 | ||
Independent | Peter Walker | 1,030 | 5.9 | ||
Independent | Steven Ruddell | 1,003 | 5.8 | ||
Independent | Andrew Banfield | 878 | 5.0 | ||
Greens | Leah Ferrara | 816 | 4.7 | ||
Independent | Margaret O'Neill | 774 | 4.4 | ||
Independent | Timothy Dally | 382 | 2.2 | ||
Independent | Adam Milani | 191 | 1.1 | ||
Total formal votes | 17,394 | 92.0 | |||
Informal votes | 1,519 | 8.0 | |||
Turnout | 18,913 | 87.8 | |||
Party total seats | Seats | ± | |||
Independent | 7 | 1 | |||
Labor | 1 | 1 | |||
Shooters, Fishers, Farmers | 1 | 1 | |||
Greens | 0 | 1 | |||
Party | Votes | % | Swing | Seats | Change | ||
---|---|---|---|---|---|---|---|
Independent | 4,037 | 100.0 | 9 | ||||
Formal votes | 4,037 | 95.60 | |||||
Informal votes | 186 | 4.40 | |||||
Total | 4,223 | 100.00 |
Party | Candidate | Votes | % | ±% | |
---|---|---|---|---|---|
Independent | Lea Parker (elected) | unopposed | |||
Independent | Tony Quinn (elected) | unopposed | |||
Independent | Heather Wilton (elected) | unopposed | |||
Registered electors | 2,554 |
Party | Candidate | Votes | % | ±% | |
---|---|---|---|---|---|
Independent | Doug Meyer (elected) | 707 | 34.5 | ||
Independent | Annette Schilg (elected) | 601 | 29.3 | ||
Independent | Ian Forrest (elected) | 389 | 19.0 | ||
Independent | Karen Schoff | 351 | 17.1 | ||
Total formal votes | 2,048 | 96.1 | |||
Informal votes | 84 | 3.9 | |||
Turnout | 2,132 | 78.4 |
Party | Candidate | Votes | % | ±% | |
---|---|---|---|---|---|
Independent | Jenny O'Neill (elected) | 633 | 31.8 | ||
Independent | Ashley Linder (elected) | 542 | 27.2 | ||
Independent | Matt Hicks (elected) | 375 | 18.9 | ||
Independent | Jonathon Howard | 198 | 10.0 | ||
Independent | Bradley Hore | 135 | 6.8 | ||
Independent | Barbara Chenoweth | 106 | 5.3 | ||
Total formal votes | 1,989 | 95.1 | |||
Informal votes | 102 | 4.9 | |||
Turnout | 2,091 | 84.9 |
Elected councillor | Party | |
---|---|---|
Laurie Testoni | Independent (Group B) | |
Shari Blumer | Independent (Group B) | |
Chris Sutton | Chris Sutton Team | |
Melissa Marin | Chris Sutton Team | |
Anne Napoli | Anne Napoli Group | |
Dino Zappacosta | Independent (Group D) | |
Manjit Singh Lally | Independent (Group D) | |
Simon Croce | Independent (Group C) | |
Jenny Ellis | Independent |
Party | Candidate | Votes | % | ±% | |
---|---|---|---|---|---|
Independent (Group B) | 3,589 | 28.6 | |||
Chris Sutton Team | 2,580 | 20.5 | |||
Anne Napoli Group | 1,850 | 14.7 | |||
Independent (Group D) | 1,171 | 9.3 | |||
Independent (Group C) | 779 | 6.2 | |||
Independent (Group E) | 664 | 5.3 | |||
Independent | Jenny Ellis | 536 | 4.3 | ||
Independent (Group G) | 530 | 4.2 | |||
Independent | Rina Mercuri | 445 | 3.5 | ||
Independent | Michael Crump | 334 | 2.7 | ||
Independent | Robert Campbell | 78 | 0.6 | ||
Total formal votes | 12,556 | 84.8 | |||
Informal votes | 2,250 | 15.2 | |||
Turnout | 14,806 | 88.1 |
Party | Candidate | Votes | % | ±% | |
---|---|---|---|---|---|
Independent | Jamie Chaffey (elected) | 2,041 | 28.5 | ||
Independent | Colleen Fuller (elected) | 1,926 | 26.9 | ||
Independent Labor | Kate McGrath (elected) | 573 | 8.0 | ||
Independent National | Murray O'Keefe (elected) | 551 | 7.7 | ||
Independent | David Moses (elected) | 434 | 6.1 | ||
Independent National | Juliana McArthur (elected) | 334 | 4.7 | ||
Independent | Ann Luke (elected) | 330 | 4.4 | ||
Independent | Robert Hoddle (elected) | 235 | 3.3 | ||
Independent | Robert Hooke (elected) | 234 | 3.3 | ||
Independent | Peter Wills | 227 | 3.2 | ||
Independent | Michael Silver | 188 | 2.6 | ||
Independent | Wendy Eriksen | 91 | 1.3 | ||
Total formal votes | 7,164 | 95.9 | |||
Informal votes | 309 | 4.1 | |||
Turnout | 7,473 | 82.5 | |||
Party total votes | |||||
Independent | 5,706 | 79.7 | |||
Independent National | 885 | 12.3 | |||
Independent Labor | 573 | 8.0 | |||
Party | Candidate | Votes | % | ±% | |
---|---|---|---|---|---|
Independent National | John Coulton (elected) | 617 | 21.0 | ||
Independent | Tiffany Galvin (elected) | 449 | 15.3 | ||
Independent | Chris Matthews (elected) | 381 | 13.0 | ||
Independent | Marilyn Dixon (elected) | 293 | 10.0 | ||
Independent | David Coulton (elected) | 262 | 8.9 | ||
Independent | Lyndon Mulligan (elected) | 245 | 8.3 | ||
Independent | Jim (Curly) Moore (elected) | 236 | 8.0 | ||
Independent | Catherine Egan (elected) | 200 | 6.8 | ||
Independent | Geoffrey Smith (elected) | 173 | 5.9 | ||
Independent | Frances Young | 84 | 2.9 | ||
Total formal votes | 2,940 | 95.7 | |||
Informal votes | 133 | 4.3 | |||
Turnout | 3,073 | 81.5 | |||
Party total votes | |||||
Independent | 2,323 | 79.0 | |||
Independent National | 617 | 21.0 | |||
Elected councillor | Party | |
---|---|---|
Sarah McMahon | Liberal | |
Patrick Conolly | Liberal | |
Paul Veigel | Liberal | |
Jill Reardon | Liberal | |
Barry Calvert | Labor | |
Amanda Kotlash | Labor | |
Mary Lyons-Buckett | People Not Parties | |
Nathan Zamprogno | Ind. Liberal | |
Les Sheather | Les and The Doc | |
Shane Djuric | SFF | |
Danielle Wheeler | Greens | |
Eddie Dogramaci | Small Business |
Party | Candidate | Votes | % | ±% | |
---|---|---|---|---|---|
Liberal | 13,577 | 34.3 | +6.0 | ||
Labor | 4,783 | 12.1 | −4.3 | ||
People Not Parties | 3,846 | 9.7 | |||
Independent Liberal | 3,357 | 8.5 | |||
Les and The Doc | 2,916 | 7.4 | |||
Shooters, Fishers, Farmers | 2,821 | 7.1 | +7.1 | ||
Greens | 2,795 | 7.1 | −0.8 | ||
Small Business | 1,899 | 4.8 | +4.8 | ||
Andrew Cadman Group | 1,070 | 2.7 | |||
Independent | 947 | 2.4 | |||
Hawkesbury Alliance | 944 | 2.4 | |||
The Locals | 448 | 1.1 | |||
Independent | John Ross | 85 | 0.2 | ||
Total formal votes | 39,488 | 94.9 | |||
Informal votes | 2,135 | 5.1 | |||
Turnout | 41,623 | 86.1 |
Party | Candidate | Votes | % | ±% | |
---|---|---|---|---|---|
Independent | Jenny Dwyer (elected) | 491 | 28.1 | ||
Independent | Martyn Quinn (elected) | 264 | 15.1 | ||
Independent | Peter Handford (elected) | 198 | 11.3 | ||
Independent | Peter Dwyer (elected) | 190 | 10.9 | ||
Independent | Carol Oataway (elected) | 117 | 6.7 | ||
Independent | Lionel Garner (elected) | 103 | 5.9 | ||
Independent | Geoff Chapman (elected) | 90 | 5.2 | ||
Independent | John Perry | 64 | 3.7 | ||
Independent | Darren Clarke | 62 | 3.5 | ||
Independent | Paul Porter (elected) | 57 | 3.3 | ||
Independent | Beverley McRae | 48 | 2.7 | ||
Independent | David Townsend | 33 | 1.9 | ||
Independent | Megan Ruska | 30 | 1.7 | ||
Total formal votes | 1,747 | 97.4 | |||
Informal votes | 47 | 2.6 | |||
Turnout | 1,794 | 83.6 |
Party | Candidate | Votes | % | ±% | |
---|---|---|---|---|---|
Independent | Alison Foreman (elected) | 1,769 | 16.1 | ||
Independent | Margaret Roles (elected) | 1,450 | 13.2 | ||
Independent | Matthew Stadtmiller (elected) | 1,436 | 13.0 | ||
Independent | Brian Ingram (elected) | 999 | 9.1 | ||
Independent | John Piper (elected) | 952 | 8.6 | ||
Independent | Joanne Mackay (elected) | 869 | 7.9 | ||
Independent | Tony Flanery (elected) | 798 | 7.2 | ||
Independent | Mary Dodd (elected) | 567 | 5.1 | ||
Independent | Tony Hewson (elected) | 482 | 4.4 | ||
Independent | Greg Armstrong (elected) | 462 | 4.2 | ||
Independent | Patrick Fitzgerald (elected) | 452 | 4.1 | ||
Independent | John Horton | 413 | 3.7 | ||
Independent | John Niven | 372 | 3.4 | ||
Total formal votes | 11,021 | 93.3 | |||
Informal votes | 788 | 6.7 | |||
Turnout | 11,809 | 82.5 |
Party | Votes | % | Swing | Seats | Change | ||
---|---|---|---|---|---|---|---|
Liberal | 42,748 | 50.2 | +6.3 | 6 | 4 | ||
Greens | 23,904 | 28.1 | +9.1 | 3 | 1 | ||
Labor | 11,755 | 13.0 | −3.8 | 0 | 2 | ||
Independent | 6,664 | 7.8 | −12.3 | 0 | 1 | ||
Formal votes | 85,071 | 96.89 | |||||
Informal votes | 2,732 | 3.11 | |||||
Total | 87,803 | 100.00 |
Elected councillor | Party | |
---|---|---|
Nathan Tilbury | Liberal | |
Warren Waddell | Liberal | |
Tania Salitra | Greens |
Party | Candidate | Votes | % | ±% | |
---|---|---|---|---|---|
Liberal | 14,496 | 50.4 | |||
Greens | 6,368 | 22.2 | |||
Labor | 5,145 | 17.9 | |||
Independent | 2,725 | 9.5 | |||
Total formal votes | 28,734 | 96.3 | |||
Informal votes | 1,111 | 3.7 | |||
Turnout | 29,845 | 88.8 |
Elected councillor | Party | |
---|---|---|
Sallianne McClelland | Liberal | |
Monika Ball | Greens | |
Janelle McIntosh | Labor |
Party | Candidate | Votes | % | ±% | |
---|---|---|---|---|---|
Liberal | 13,733 | 48.6 | |||
Greens | 7,930 | 28.0 | |||
Labor | 6,610 | 23.4 | |||
Total formal votes | 28,273 | 97.2 | |||
Informal votes | 817 | 2.8 | |||
Turnout | 29,090 | 86.5 |
Elected councillor | Party | |
---|---|---|
Verity Greenwood | Liberal | |
Sreeni Pillamarri | Liberal | |
Emma Heyde | Greens |
Party | Candidate | Votes | % | ±% | |
---|---|---|---|---|---|
Liberal | 14,519 | 51.7 | |||
Greens | 9,606 | 34.2 | |||
Independent | 3,939 | 14.0 | |||
Total formal votes | 28,064 | 97.2 | |||
Informal votes | 804 | 2.8 | |||
Turnout | 28,868 | 89.6 |
Party | Votes | % | Swing | Seats | Change | ||
---|---|---|---|---|---|---|---|
Independent | 3,372 | 41.0 | 3 | ||||
Liberal | 3,171 | 38.5 | +2.1 | 3 | |||
Team Ross | 1,260 | 15.3 | 1 | ||||
Greens | 431 | 5.2 | +5.2 | 0 | |||
Formal votes | 8,234 | 96.33 | |||||
Informal votes | 314 | 3.67 | |||||
Total | 8,548 | 100.00 |
Elected councillor | Party | |
---|---|---|
Julia Prieston | Liberal | |
Ross Williams | Team Ross | |
Elizabeth Krassoi | Independent (Group A) |
Party | Candidate | Votes | % | ±% | |
---|---|---|---|---|---|
Liberal | 1,576 | 37.8 | |||
Team Ross | 1,260 | 30.2 | |||
Independent (Group A) | 960 | 23.0 | |||
Independent (Group B) | 376 | 9.0 | |||
Total formal votes | 4,172 | 95.6 | |||
Informal votes | 193 | 4.4 | |||
Turnout | 4,365 | 85.9 |
Elected councillor | Party | |
---|---|---|
Tatyana Virgara | Liberal | |
Richard Quinn | Independent (Group F) | |
Jim Sanderson | Independent (Group B) |
Party | Candidate | Votes | % | ±% | |
---|---|---|---|---|---|
Liberal | 1,595 | 39.3 | |||
Independent (Group F) | 859 | 21.1 | |||
Independent (Group B) | 848 | 20.9 | |||
Greens | 431 | 10.6 | +10.6 | ||
Independent (Group D) | 263 | 6.5 | |||
Independent (Group C) | 66 | 1.6 | |||
Total formal votes | 4,062 | 97.1 | |||
Informal votes | 121 | 2.9 | |||
Turnout | 4,183 | 86.5 |
The Liberal Party did not endorse any candidates, including its two councillors elected in 2017. [79]
Party | Votes | % | Swing | Seats | Change | ||
---|---|---|---|---|---|---|---|
Labor | 40,113 | 38.6 | +4.7 | 8 | 3 | ||
Greens | 37,499 | 36.0 | +7.2 | 5 | |||
Independent | 15,967 | 15.3 | −2.7 | 2 | 1 | ||
Independent Liberal | 6,738 | 6.5 | −11.1 [lower-alpha 5] | 0 | 2 [lower-alpha 5] | ||
Community Independents | 1,195 | 1.1 | 0 | ||||
Community Independent | 898 | 0.9 | 0 | ||||
Animal Justice | 876 | 0.8 | +0.8 | 0 | |||
Socialist Alliance | 749 | 0.8 | –0.2 | 0 | |||
Formal votes | 104,035 | 96.49 | |||||
Informal votes | 3,795 | 3.51 | |||||
Total | 107,830 | 100.00 |
Elected councillor | Party | |
---|---|---|
Mark Drury | Labor | |
Dylan Griffiths | Greens | |
Jessica D'Arienzo | Labor |
Party | Candidate | Votes | % | ±% | |
---|---|---|---|---|---|
Labor | 8,294 | 38.9 | |||
Greens | 7,726 | 36.3 | |||
Independent | 2,243 | 20.5 | |||
Independent Liberal | 1,852 | 8.7 | |||
Community Independents | 1,195 | 5.6 | |||
Total formal votes | 21,310 | 95.9 | |||
Informal votes | 904 | 4.1 | |||
Turnout | 22,214 | 83.7 |
Elected councillor | Party | |
---|---|---|
Darcy Byrne | Labor | |
Kobi Shetty | Greens | |
John Stamolis | Independent |
Party | Candidate | Votes | % | ±% | |
---|---|---|---|---|---|
Labor | 7,751 | 36.5 | |||
Greens | 7,220 | 34.0 | |||
Independent | 3,814 | 18.0 | |||
Independent Liberal | 1,557 | 7.3 | |||
Community Independent | 898 | 4.2 | |||
Total formal votes | 21,240 | 97.5 | |||
Informal votes | 555 | 2.5 | |||
Turnout | 21,795 | 81.2 |
Elected councillor | Party | |
---|---|---|
Philippa Scott | Labor | |
Marghanita Da Cruz | Greens | |
Tim Stephens | Labor |
Party | Candidate | Votes | % | ±% | |
---|---|---|---|---|---|
Labor | 8,200 | 39.5 | |||
Greens | 7,508 | 36.1 | |||
Independent Liberal | 3,329 | 16.0 | |||
Animal Justice | 876 | +4.2 | +4.2 | ||
Independent | 870 | 4.2 | |||
Total formal votes | 20,783 | 95.8 | |||
Informal votes | 900 | 4.2 | |||
Turnout | 21,683 | 83.2 |
Elected councillor | Party | |
---|---|---|
Mat Howard | Labor | |
Justine Langford | Greens | |
Zoi Tsardoulias | Labor |
Party | Candidate | Votes | % | ±% | |
---|---|---|---|---|---|
Labor | 8,905 | 43.8 | |||
Greens | 7,293 | 35.8 | |||
Independent | 4,149 | 20.4 | |||
Total formal votes | 20,347 | 96.5 | |||
Informal votes | 731 | 3.5 | |||
Turnout | 21,078 | 80.4 |
Elected councillor | Party | |
---|---|---|
Liz Atkins | Greens | |
Chloe Smith | Labor | |
Pauline Lockie | Independent |
Party | Candidate | Votes | % | ±% | |
---|---|---|---|---|---|
Greens | 7,752 | 38.1 | |||
Labor | 6,963 | 34.2 | |||
Independent | 4,634 | 22.8 | |||
Socialist Alliance | 749 | 3.7 | |||
Independent | Daniel Ribarovski | 257 | 1.3 | ||
Total formal votes | 20,355 | 96.7 | |||
Informal votes | 705 | 3.3 | |||
Turnout | 21,060 | 78.9 |
Party | Candidate | Votes | % | ±% | |
---|---|---|---|---|---|
Independent (Group B) | 1. Paul Harmon (elected) 2. Kate Dight (elected) | 3,271 | 33.1 | ||
Di Baker & Jo Williams | 1. Di Baker (elected) 2. Jo Williams (elected) | 2,947 | 29.8 | ||
Independent (Group C) | 1. Paul King (elected) 2. Wendy Wilks (elected) | 1,264 | 12.8 | ||
Independent | Nicky Lavender (elected) | 665 | 6.7 | ||
Independent | Stewart Berryman (elected) | 592 | 6.0 | ||
Independent | John (Jacko) Ross (elected) | 481 | 4.9 | ||
Independent | Phil Girle | 347 | 3.5 | ||
Independent | Jacki Watts | 320 | 3.2 | ||
Total formal votes | 9,887 | 93.3 | |||
Informal votes | 705 | 6.7 | |||
Turnout | 10,592 | 82.3 |
Party | Candidate | Votes | % | ±% | |
---|---|---|---|---|---|
Independent | Neil Smith (elected) | 795 | 24.4 | ||
Independent | Pam Halliburton (elected) | 476 | 14.6 | ||
Independent | Matt Austin (elected) | 433 | 13.3 | ||
Independent | David Carter (elected) | 303 | 9.3 | ||
Independent | Andrew Clinton (elected) | 253 | 7.8 | ||
Independent | Robin Asmus (elected) | 180 | 5.5 | ||
Independent | Mark Cook (elected) | 179 | 5.5 | ||
Independent | Marie Knight (elected) | 160 | 4.9 | ||
Independent | Anna Lashbrook | 158 | 4.8 | ||
Independent | Maggie Salisbury | 108 | 3.3 | ||
Independent | Bob Callow (elected) | 107 | 3.3 | ||
Independent | Linda Calis | 57 | 1.7 | ||
Independent | Robert Minister | 53 | 1.3 | ||
Total formal votes | 3,262 | 95.9 | |||
Informal votes | 138 | 4.1 | |||
Turnout | 3,400 | 85.1 |
Elected councillor | Party | |
---|---|---|
Simon Fergusson | Independent (Group A) | |
Joshua Freeman | Independent (Group A) | |
Liz Campbell | Independent | |
Vijay Craigie | Independent (Group B) | |
Arthur Bain | Greens | |
Alexandra Wyatt | Independent | |
Kerri Riddington | Independent | |
Anthony Patterson | Independent |
This election was re-run in July 2022 after the New South Wales Electoral Commission's online voting system crashed. [84]
Party | Candidate | Votes | % | ±% | |
---|---|---|---|---|---|
Independent (Group A) | 3,440 | 21.2 | |||
Independent | Liz Campbell | 1,912 | 11.8 | ||
Independent (Group B) | 1,886 | 11.6 | |||
Greens | Arthur Bain | 1,649 | 10.2 | ||
Independent | Alexandra Wyatt | 1,299 | 8.0 | ||
Independent | Kerri Riddington | 934 | 5.8 | ||
Independent | Kinne Ring | 704 | 4.3 | ||
Independent | Dean Saul | 685 | 4.2 | ||
Independent | Mark Baxter | 618 | 3.8 | ||
Independent | Anthony Patterson | 558 | 3.4 | ||
Independent SFF | Troy Irwin | 537 | 3.3 | ||
Independent | Sue McGinn | 509 | 3.1 | ||
Independent | Byron Fegan | 416 | 2.6 | ||
Independent | Bruce Raeburn | 397 | 2.5 | ||
Independent | Andrew Evans | 331 | 2.0 | ||
Independent | Noel Selby | 329 | 2.0 | ||
Total formal votes | 16,204 | 87.6 | |||
Informal votes | 2,289 | 12.4 | |||
Turnout | 18,493 | 81.3 |
Elected councillor | Party | |
---|---|---|
Kathy Rice | Greens | |
Imogen Draisma | Labor | |
Mark Croxford | YCC | |
Karen Renkema-Lang | S.A.F.E. | |
Neil Reilly | Team Reilly | |
Matt Brown | WLKGJ | |
Jodi Keast | Greens | |
Stuart Larkins | Labor | |
Warren Steel | Independent |
Party | Candidate | Votes | % | ±% | |
---|---|---|---|---|---|
Greens | 4,070 | 27.1 | +3.3 | ||
Labor | 2,553 | 17.0 | +17.0 | ||
Your Community Candidates | 2,030 | 13.5 | |||
You're in S.A.F.E. Hands | 1,963 | 13.1 | |||
We Love Kiama Gerringong Jamberoo | 1,706 | 11.4 | |||
Team Reilly | 1,675 | 11.2 | |||
Independent | 1,019 | 6.8 | |||
Total formal votes | 15,016 | 96.0 | |||
Informal votes | 628 | 4.0 | |||
Turnout | 15,644 | 86.9 |
Party | Votes | % | Swing | Seats | Change | ||
---|---|---|---|---|---|---|---|
Independent | 649 | 100.0 | +0.0 | 10 | |||
Formal votes | 649 | 98.2 | |||||
Informal votes | 12 | 1.8 | |||||
Total | 661 | 100.0 | |||||
Registered voters / turnout | 4,366 | 15.14 |
Party | Candidate | Votes | % | ±% | |
---|---|---|---|---|---|
Independent | John Medcalf (elected) | unopposed | |||
Independent | Megan Mortimer (elected) | unopposed | |||
Registered electors | 859 |
Party | Candidate | Votes | % | ±% | |
---|---|---|---|---|---|
Independent | Melissa Blewitt (elected) | unopposed | |||
Independent | Melissa Rees (elected) | unopposed | |||
Registered electors | 846 |
Party | Candidate | Votes | % | ±% | |
---|---|---|---|---|---|
Independent | Dave Carter (elected) | unopposed | |||
Independent | Peter Harris (elected) | unopposed | |||
Registered electors | 839 |
Party | Candidate | Votes | % | ±% | |
---|---|---|---|---|---|
Independent | Elaine Bendall (elected) | unopposed | |||
Independent | Dennis Brady (elected) | unopposed | |||
Registered electors | 906 |
Party | Candidate | Votes | % | ±% | |
---|---|---|---|---|---|
Independent | Judith Bartholomew (elected) | 281 | 43.3 | ||
Independent | Paul Phillips (elected) | 239 | 36.8 | ||
Independent | Allan Johnston | 73 | 11.2 | ||
Independent | Mark Hall | 56 | 8.6 | ||
Total formal votes | 649 | 98.2 | |||
Informal votes | 12 | 1.8 | |||
Turnout | 661 | 72.2 |
Party | Votes | % | Swing | Seats | Change | ||
---|---|---|---|---|---|---|---|
Labor | 50,340 | 39.2 | 6 | 1 | |||
Liberal | 33,078 | 25.7 | 3 | ||||
Lake Mac Independents | 24,922 | 19.4 | 3 | ||||
Greens | 12,571 | 9.8 | 0 | ||||
Independent | 4,661 | 3.6 | 0 | ||||
Shooters, Fishers, Farmers | 29,80 | 2.3 | 0 | ||||
Formal votes | 128,552 |
Elected councillor | Party | |
---|---|---|
Adam Shultz | Labor | |
Nick Jones | Liberal | |
Kate Warner | LMI | |
Christine Buckley | Labor |
Party | Candidate | Votes | % | ±% | |
---|---|---|---|---|---|
Labor | 17,397 | 41.8 | |||
Liberal | 10,997 | 26.4 | |||
Lake Mac Independents | 6,884 | 16.6 | |||
Greens | 3,675 | 8.8 | |||
Independent (Group A) | 2,438 | 5.9 | |||
Independent | Alan Ellis | 202 | 0.5 | ||
Total formal votes | 41,593 | 94.7 | |||
Informal votes | 2,311 | 5.3 | |||
Turnout | 43,904 | 85.2 |
Elected councillor | Party | |
---|---|---|
Brian Adamthwaite | Labor | |
Jack Antcliff | Liberal | |
Colin Grigg | LMI | |
Keara Conroy | Labor |
Party | Candidate | Votes | % | ±% | |
---|---|---|---|---|---|
Labor | 18,014 | 42.6 | |||
Liberal | 9,237 | 21.8 | |||
Lake Mac Independents | 6,485 | 15.3 | |||
Greens | 5,007 | 11.8 | |||
Shooters, Fishers, Farmers | 2,980 | 7.0 | |||
Independent | Bryce Ham | 593 | 1.4 | ||
Total formal votes | 42,316 | 95.2 | |||
Informal votes | 2,147 | 4.8 | |||
Turnout | 44,463 | 85.5 |
Elected councillor | Party | |
---|---|---|
David Belcher | Labor | |
Jason Pauling | Liberal | |
Luke Cubis | LMI | |
Madeline Bishop | Labor |
Party | Candidate | Votes | % | ±% | |
---|---|---|---|---|---|
Labor | 14,929 | 33.4 | |||
Liberal | 12,844 | 28.8 | |||
Lake Mac Independents | 11,553 | 25.9 | |||
Greens | 3,889 | 8.7 | |||
Independent | Rosmairi Dawson | 1,428 | 3.2 | ||
Total formal votes | 44,643 | 94.4 | |||
Informal votes | 2,665 | 5.6 | |||
Turnout | 47,308 | 82.0 |
Elected councillor | Party | |
---|---|---|
Peter Colby | Steve Krieg | |
Jeri Hall | Steve Krieg | |
Andrew Gordon | Steve Krieg | |
Electra Jensen | Steve Krieg | |
Andrew Bing | Steve Krieg | |
Vanessa Grindon-Ekins | Greens | |
Adam Guise | Greens | |
Darlene Cook | Labor | |
Elly Bird | OSF | |
Big Rob | Independent |
Party | Candidate | Votes | % | ±% | |
---|---|---|---|---|---|
Steve Krieg for Lismore | 12,766 | 49.2 | +49.2 | ||
Greens | 3,820 | 14.7 | +0.8 | ||
Labor | 3,195 | 12.3 | −10.3 | ||
Our Sustainable Future | 2,769 | 10.7 | +0.0 | ||
Independent | 1,948 | 7.5 | |||
Independent Lismore | 797 | 3.1 | |||
Animal Justice | 653 | 2.5 | +2.5 | ||
Total formal votes | 25,948 | 95.8 | |||
Informal votes | 1,140 | 4.2 | |||
Turnout | 27,088 | 85.9 |
Elected councillor | Party | |
---|---|---|
Maree Stratham | Team Maree | |
Col O'Connor | Team Maree | |
Stuart McGhie | Team Maree | |
Almudena Bryce | Team Maree | |
Darryl Goodwin | Good for Council | |
Deanna Goodsell | Good for Council | |
Cass Coleman | Cass Coleman | |
Eric Mahony | Cass Coleman | |
Stephen Lesslie | Independent |
Party | Candidate | Votes | % | ±% | |
---|---|---|---|---|---|
Team Maree | 5,502 | 42.1 | |||
Good for Council | 2,496 | 19.1 | |||
Cass Coleman Community Team | 2,147 | 16.4 | |||
Independent | 1,665 | 12.7 | |||
Ring's Independent Lithgow | 633 | 4.8 | |||
Lithgow First | 618 | 4.7 | |||
Total formal votes | 13,061 | 95.4 | |||
Informal votes | 636 | 4.6 | |||
Turnout | 13,697 | 86.4 |
Party | Candidate | Votes | % | ±% | |
---|---|---|---|---|---|
Independent | Rhonda Hoban | 5,161 | 42.9 | ||
Labor | Susan Jenvey (elected) | 1,984 | 16.5 | ||
Independent | James Angel (elected) | 828 | 6.9 | ||
Independent | Ricky Buchanan (elected) | 602 | 5.0 | ||
Independent | Trevor Ballangarry (elected) | 524 | 4.4 | ||
Independent | David Hall | 498 | 4.1 | ||
Independent | David Jones (elected) | 415 | 3.4 | ||
Independent | Martin Ballangarry (elected) | 414 | 3.4 | ||
Independent | Barry Clow | 365 | 3.0 | ||
Independent | Peter Sobey | 352 | 2.9 | ||
Independent | Michael Scafidi | 345 | 2.9 | ||
Independent | Troy Vance (elected) | 342 | 2.8 | ||
Independent | John Wilson (elected) | 213 | 1.8 | ||
Total formal votes | 12,043 | 93.9 | |||
Informal votes | 783 | 6.1 | |||
Turnout | 12,826 | 80.4 |
Party | Candidate | Votes | % | ±% | |
---|---|---|---|---|---|
Independent | Mark Kellam (elected) | 570 | 17.7 | ||
Independent | Clive McCarthy (elected) | 435 | 13.5 | ||
Independent | Ian Tucker (elected) | 352 | 10.9 | ||
Independent | Katy Graham (elected) | 301 | 9.4 | ||
Independent | Mick McKechnie (elected) | 252 | 7.8 | ||
Independent | Andrew McKibbin (elected) | 249 | 7.7 | ||
Independent | Lauren Trembath (elected) | 220 | 6.8 | ||
Independent | Bruce Watt (elected) | 213 | 6.6 | ||
Independent | Helen Hayden (elected) | 155 | 4.8 | ||
Independent | Sig Sovik | 143 | 4.4 | ||
Independent | Neil Francis | 121 | 3.8 | ||
Independent | Gregory Bourne | 113 | 3.5 | ||
Independent | Margaret Kilby | 91 | 2.8 | ||
Total formal votes | 3,215 | 95.5 | |||
Informal votes | 153 | 4.5 | |||
Turnout | 3,368 | 84.4 |
Elected councillor | Party | |
---|---|---|
Tony Mileto | For Our Future | |
Jack Evans | For Our Future | |
Tammy Greenhalgh | Team Hamling | |
Glenn Floyd | SFF | |
Steven Peterson | Refresh Orange | |
Kevin Duffy | Independent (Group F) | |
David Mallard | Greens | |
Melanie McDonell | McDonell Team | |
Jeffery Whitton | Ind. Labor | |
Frances Kinghorne | ORRAP | |
Gerald Power | Independent (Group I) |
Party | Candidate | Votes | % | ±% | |
---|---|---|---|---|---|
For Our Future | 3,786 | 15.9 | |||
Team Hamling | 3,155 | 13.3 | |||
Shooters, Fishers, Farmers | 2,928 | 12.3 | |||
Refresh Orange | 2,469 | 10.4 | |||
Independent (Group F) | 2,351 | 9.9 | |||
Greens | 2,185 | 9.2 | |||
McDonell Team | 1,870 | 7.9 | |||
Independent Labor | 1,786 | 7.5 | |||
Orange Residents and Ratepayers Association | 1,408 | 5.9 | |||
Independent (Group I) | 846 | 3.6 | |||
Independent | Amanda Spalding | 347 | 1.5 | ||
Independent | Geoff Naughton | 266 | 1.1 | ||
Independent | Lesley Smith | 192 | 0.8 | ||
Independent | Scott Munro | 105 | 0.4 | ||
Independent | Josh Girle-Bennett | 46 | 0.2 | ||
Total formal votes | 23,740 | 93.4 | |||
Informal votes | 1,684 | 6.6 | |||
Turnout | 25,424 | 84.4 |
Elected councillor | Party | |
---|---|---|
Glenn Wilson | Independent (Group A) | |
Ken Keith | Independent | |
Louise O'Leary | Independent | |
Neil Westcott | Independent | |
Bill Jayet | Independent | |
Jacob Cass | Independent | |
Marg Applebee | Independent | |
Kenny McGrath | Independent | |
George Pratt | Independent | |
Daniel Weber | Independent (Group A) |
Party | Candidate | Votes | % | ±% | |
---|---|---|---|---|---|
independent (Group A) | 1,596 | 19.9 | |||
Independent | Ken Keith | 1,172 | 14.6 | ||
Independent | Louise O'Leary | 786 | 9.8 | ||
Independent | Neil Westcott | 708 | 8.8 | ||
Independent | Bill Jayet | 707 | 8.8 | ||
Independent | Jacob Cass | 650 | 8.1 | ||
Independent | Marg Applebee | 573 | 7.1 | ||
Independent | Kenny McGrath | 496 | 6.2 | ||
Independent | George Pratt | 431 | 5.4 | ||
Independent National | John Southon | 332 | 4.1 | ||
Independent | Johanne Burke | 213 | 2.7 | ||
Independent | Cathy Francis | 160 | 2.0 | ||
Independent | John Coulston | 156 | 1.9 | ||
Independent | Sean White | 47 | 0.6 | ||
Total formal votes | 8,027 | 91.0 | |||
Informal votes | 797 | 9.0 | |||
Turnout | 8,824 | 83.8 | |||
Party total votes | |||||
Independent | 7,695 | 95.9 | |||
Independent National | 332 | 4.1 | |||
Party total seats | Seats | ± | |||
Independent | 10 | ||||
The Liberal Party did not endorse any candidates, including its six councillors elected in 2017. [101]
Party | Votes | % | Swing | Seats | Change | ||
---|---|---|---|---|---|---|---|
Labor | 46,022 | 41.5 | +10.3 | 7 | 2 | ||
Our Local Community | 21,476 | 19.4 | +12.3 | 4 | 2 | ||
Greens | 11,233 | 10.1 | +2.7 | 1 | |||
Lorraine Wearne Independents | 9,423 | 8.5 | +4.4 | 1 | |||
Independent Liberal | 6,310 | 5.7 | −30.8 [lower-alpha 6] | 1 | 5 [lower-alpha 6] | ||
Kellie Darley Independents | 4,637 | 4.2 | +4.2 | 1 | 1 | ||
Lee Malkoun Independents | 3,489 | 3.1 | −5.9 [lower-alpha 7] | 0 | [lower-alpha 7] | ||
Small Business | 3,126 | 2.8 | +2.8 | 0 | |||
Liberal Democrats | 2,161 | 2.0 | +2.0 | 0 | |||
Independent | 1,882 | 1.7 | 0 | ||||
Community Need Not Corporate Greed | 1,026 | 0.9 | +0.9 | 0 | |||
Formal votes | 110,785 | 95.23 | |||||
Informal votes | 5,547 | 4.77 | |||||
Total | 116,332 | 100.0 |
Elected councillor | Party | |
---|---|---|
Pierre Esber | Labor | |
Michelle Garrard | OLC | |
Kellie Darley | Kellie Darley Inds |
Party | Candidate | Votes | % | ±% | |
---|---|---|---|---|---|
Labor | 8,278 | 37.5 | |||
Our Local Community | 5,672 | 25.7 | |||
Kellie Darley Independents | 4,637 | 21.0 | +21.0 | ||
Lee Malkoun Independents | 3,489 | 15.8 | +1.9 [lower-alpha 7] | ||
Total formal votes | 22,076 | 94.33 | |||
Informal votes | 1,327 | 5.67 | |||
Turnout | 23,403 | 83.55 |
Elected councillor | Party | |
---|---|---|
Donna Davis | Labor | |
Lorraine Wearne | Lorraine Wearne Inds | |
Cameron Maclean | Labor |
Party | Candidate | Votes | % | ±% | |
---|---|---|---|---|---|
Labor | 12,156 | 51.8 | |||
Lorraine Wearne Independents | 9,423 | 40.2 | |||
Independent | Jean Pierre Abood | 1,882 | 8.0 | ||
Total formal votes | 23,461 | 95.49 | |||
Informal votes | 1,108 | 4.51 | |||
Turnout | 24,569 | 87.93 |
Elected councillor | Party | |
---|---|---|
Angela Humphries | Labor | |
Georgina Valjak | Ind. Liberal | |
Donna Wang | OLC |
Party | Candidate | Votes | % | ±% | |
---|---|---|---|---|---|
Labor | 7,541 | 33.5 | |||
Independent Liberal | 6,310 | 28.0 | −20.2 [lower-alpha 6] | ||
Our Local Community | 5,528 | 24.5 | |||
Greens | 3,146 | 14.0 | |||
Total formal votes | 22,525 | 95.95 | |||
Informal votes | 949 | 4.04 | |||
Turnout | 23,474 | 87.52 |
Elected councillor | Party | |
---|---|---|
Sameer Pandey | Labor | |
Henry Green | OLC | |
Phil Bradley | Greens |
Party | Candidate | Votes | % | ±% | |
---|---|---|---|---|---|
Labor | 8,412 | 41.2 | |||
Our Local Community | 5,749 | 28.1 | |||
Greens | 4,118 | 20.1 | |||
Liberal Democrats | 2,161 | 10.6 | +10.6 | ||
Total formal votes | 20,440 | 94.71 | |||
Informal votes | 1,141 | 5.29 | |||
Turnout | 21,581 | 80.98 |
Elected councillor | Party | |
---|---|---|
Patricia Prociv | Labor | |
Dan Siviero | OLC | |
Paul Noack | Labor |
Party | Candidate | Votes | % | ±% | |
---|---|---|---|---|---|
Labor | 9,635 | 43.2 | |||
Our Local Community | 4,527 | 20.3 | |||
Greens | 3,969 | 17.8 | |||
Small Business | 3,126 | 14.0 | +14.0 | ||
Community Need Not Corporate Greed | 1,026 | 4.6 | +4.6 | ||
Total formal votes | 22,283 | 95.61 | |||
Informal votes | 1,022 | 4.39 | |||
Turnout | 23,305 | 78.53 |
The election was conducted by the Australian Election Company. [104]
Party | Votes | % | Swing | Seats | Change | ||
---|---|---|---|---|---|---|---|
Labor | 36,376 | 34.5 | –6.2 | 5 | |||
Liberal | 35,081 | 33.3 | +2.9 | 6 | |||
Independent | 10,336 | 9.8 | |||||
Sue Day - Independent | 6,859 | 6.5 | 1 | ||||
The North Ward Independents | 5,820 | 5.5 | 1 | ||||
MARCUS CORNISH | 3,868 | 3.7 | |||||
WE DESERVE BETTER | 3,073 | 2.9 | 1 | ||||
Australia First | 2,549 | 2.4 | +2.4 | ||||
People Before Politics | 1,534 | 1.5 | |||||
Formal votes | 105,496 |
Elected councillor | Party | |
---|---|---|
Bernard Bratusa | Liberal | |
Tricia Hitchen | Liberal | |
Todd Carney | Labor | |
Robin Cook | Labor | |
Marlene Shipley | WE DESERVE BETTER |
Party | Candidate | Votes | % | ±% | |
---|---|---|---|---|---|
Labor | 13,227 | 39.9 | |||
Liberal | 10,456 | 31.5 | |||
WE DESERVE BETTER | 3,073 | 9.3 | |||
Australia First | 2,549 | 7.7 | |||
Independent | 2,330 | 7.0 | |||
People Before Politics | 1,534 | 4.6 | |||
Total formal votes | 33,169 | ||||
Elected councillor | Party | |
---|---|---|
Ross Fowler | Liberal | |
Glenn Gardiner | Liberal | |
John Thain | Labor | |
Jonathan Pullen | Labor | |
Kevin Crameri | North Ward Inds |
Party | Candidate | Votes | % | ±% | |
---|---|---|---|---|---|
Labor | 12,455 | 33.8 | |||
Liberal | 12,207 | 33.2 | |||
The North Ward Independents | 5,820 | 15.8 | |||
MARCUS CORNISH | 3,868 | 10.5 | |||
Independent | 2,455 | 6.7 | |||
Total formal votes | 36,805 | 72.7 | |||
Elected councillor | Party | |
---|---|---|
Mark Davies | Liberal | |
Mark Rusev | Liberal | |
Karen McKeown | Labor | |
Sue Day | Sue Day | |
Jim Aitken | Independent |
Party | Candidate | Votes | % | ±% | |
---|---|---|---|---|---|
Liberal | 12,418 | 35.0 | |||
Labor | 10,694 | 30.1 | |||
Sue Day - Independent | 6,859 | 19.3 | |||
Independent | 5,441 | 15.3 | |||
Independent | Abigail Nash | 110 | 0.3 | ||
Total formal votes | 35,522 | 74.8 | |||
Elected councillor | Party | |
---|---|---|
Peta Pinson | Team Pinson | |
Adam Roberts | Team Pinson | |
Danielle Maltman | Team Pinson | |
Josh Slade | Team Pinson | |
Sharon Griffiths | Team Pinson | |
Lisa Intemann | Fighters | |
Rachel Sheppard | Sheppard Team | |
Lauren Edwards | Greens | |
Nik Lipovac | Hastings First |
Party | Candidate | Votes | % | ±% | |
---|---|---|---|---|---|
Team Pinson | 24,571 | 46.8 | |||
Fighters For Our Region | 9,077 | 17.3 | |||
The Sheppard Team for Sensible, Sustainable Progress | 8,046 | 15.3 | |||
Greens | 4,704 | 9.0 | |||
Hastings First | 4,398 | 8.4 | |||
Independent | Jon Bailey | 1,721 | 3.3 | ||
Total formal votes | 52,517 | 92.3 | |||
Informal votes | 4,402 | 7.7 | |||
Turnout | 56,919 | 85.6 |
Party | Votes | % | Swing | Seats | Change | ||
---|---|---|---|---|---|---|---|
Independent | 21,335 | 45.9 | −36.7 | 4 | |||
Labor | 19,372 | 41.6 | +24.2 | 4 | 3 | ||
Liberal | 4,255 | 9.1 | +3.6 [lower-alpha 8] | 1 | 1 | ||
Greens | 1,565 | 3.4 | +3.4 | 0 | |||
Formal votes | 46,527 | 93.8 | |||||
Informal votes | 3,073 | 6.2 | |||||
Turnout | 49,600 | 86.1 |
Elected councillor | Party | |
---|---|---|
Jason Wells | Labor | |
Chris Doohan | Independent (Group B) | |
Steve Tucker | Independent (Group A) |
Party | Candidate | Votes | % | ±% | |
---|---|---|---|---|---|
Independent (Group B) | 4,686 | 28.8 | |||
Independent (Group A) | 4,226 | 25.9 | |||
Labor | 5,618 | 34.5 | +19.6 | ||
Greens | 1,565 | 9.6 | +9.6 | ||
Independent | Bill Doran | 194 | 1.2 | ||
Total formal votes | 16,289 | 92.7 | +2.4 | ||
Informal votes | 1,286 | 7.3 | −2.4 | ||
Turnout | 17,575 | 86.9 | +1.6 |
Elected councillor | Party | |
---|---|---|
Leah Anderson | Labor | |
Glen Dunkley | Independent | |
Matthew Bailey | Liberal |
Party | Candidate | Votes | % | ±% | |
---|---|---|---|---|---|
Labor | 5,850 | 39.5 | +31.6 | ||
Independent | 4,708 | 31.8 | |||
Liberal | 4,255 | 28.7 | +12.0 | ||
Total formal votes | 14,813 | 95.7 | +2.5 | ||
Informal votes | 669 | 4.3 | −2.5 | ||
Turnout | 15,482 | 84.8 | +0.9 |
Elected councillor | Party | |
---|---|---|
Arnott Giacomo | Labor | |
Peter Francis | Labor | |
Peter Kafer | Independent (Group A) |
Party | Candidate | Votes | % | ±% | |
---|---|---|---|---|---|
Labor | 7,904 | 51.2 | +22.7 | ||
Independent (Group A) | 6,608 | 42.8 | |||
Independent | Danielle Le Mottee | 266 | 1.7 | ||
Independent | Monique Malone | 239 | 1.5 | ||
Independent | Christopher Baguley | 209 | 1.4 | ||
Independent | Andrew Dole | 199 | 1.3 | ||
Total formal votes | 15,425 | 93.4 | +0.2 | ||
Informal votes | 1,088 | 6.6 | −0.2 | ||
Turnout | 16,513 | 86.1 | +2.2 |
Elected councillor | Party | |
---|---|---|
Bryce Wilson | Labor | |
Esma Livermore | Labor | |
John Preston | Labor | |
Kenrick Winchester | Ind. Labor (Group F) | |
Edwina Webster | Independent (Group F) | |
Louise Burton | Liberal | |
Jacqueline Ternouth | Liberal | |
Katrina Willis | Greens | |
Mareeta Grundy | Independent (Group B) | |
Steve Taskovski | Independent (Group D) | |
Michele Biscotti | Independent (Group G) |
Party | Candidate | Votes | % | ±% | |
---|---|---|---|---|---|
Labor | 7,398 | 21.9 | +8.2 | ||
Independent Labor/Independent joint ticket (Group F) | 5,847 | 17.3 | |||
Liberal | 5,829 | 17.2 | +8.0 | ||
Greens | 3,389 | 10.0 | +3.5 | ||
Independent (Group B) | 3,168 | 9.4 | |||
Independent (Group D) | 2,518 | 7.4 | |||
Independent (Group G) | 2,205 | 6.5 | |||
Independent | Bill Waterhouse | 1,181 | 3.5 | ||
Independent (Group H) | 1,021 | 3.0 | |||
Independent (Group C) | 1,004 | 3.0 | |||
Independent | Ginevra Peisley | 93 | 0.3 | ||
Independent (Group E) | 87 | 0.3 | |||
Independent | James Holgate | 43 | 0.1 | ||
Independent | Kyol Booth-Hunt | 31 | 0.1 | ||
Total formal votes | 33,813 | 95.3 | +1.1 | ||
Informal votes | 1,684 | 4.7 | −1.1 | ||
Turnout | 35,497 | 86.1 | +7.8 |
Elected councillor | Party | |
---|---|---|
Steve Morrissey | Independent (Group B) | |
Sam Cornish | Independent (Group B) | |
Sandra Humphrys | Independent (Group B) | |
Debra McGillan | Independent (Group B) | |
Patrick Deegan | Labor | |
Robert Hayes | Independent (Group D) |
Party | Candidate | Votes | % | ±% | |
---|---|---|---|---|---|
Independent (Robert Mustow's Group B) | 7,346 | 57.6 | |||
Labor | 1,769 | 13.9 | |||
Independent (Group D) | 1,457 | 11.4 | |||
Independent (Group A) | 1,281 | 10.0 | |||
Independent (Group C) | 776 | 6.1 | |||
Independent | Robyn Kapeen | 127 | 1.0 | ||
Total formal votes | 12,756 | 90.7 | |||
Informal votes | 1,313 | 9.3 | |||
Turnout | 14,069 | 85.4 |
Party | Candidate | Votes | % | ±% | |
---|---|---|---|---|---|
Team Clover | 1. Clover Moore 2. Jess Scully (elected 1) 3. Robert Kok (elected 5) 4. Emelda Davis (elected 6) 5. William Chan (elected 7) 6. Adam Worling 7. Mike Galvin 8. Elaine Czulkowski 9. Philip Thalis 10. Jess Miller | 47,877 | 40.8 | −14.13 | |
Liberal | 1. Shauna Jarrett (elected 2) 2. Lyndon Gannon (elected 8) 3. Sam Danieli 4. Phyllisse Stanton 5. Richard Hicklin 6. Ricky Lee | 20,432 | 17.4 | −2.3 | |
Labor | 1. Linda Scott (elected 4) 2. Damien Minton 3. Norma Ingram 4. Tamira Stevensen 5. Tony Pooley 6. Meagan Lawson 7. Ian Roberts 8. Frier Bentley | 18,077 | 14.7 | +3.07 | |
Greens | 1. Sylvie Ellsmore (elected 3) 2. Dejay Toborek 3. Caroline Alcorso 4. Chetan Sahai 5. Mark Smith | 12,972 | 11.1 | +5.12 | |
Unite for Sydney | 1. Yvonne Weldon (elected 9) 2. Karen Freyer 3. Stephen Conlon 4. Meead Saberi Kalaee 5. Kiran De Silva 6. Mark Hodge | 10,577 | 9.0 | +9.0 | |
Small Business | 1. Angela Vithoulkas 2. Paul Crossin 3. Tatiana Coulter 4. Phillip Joel 5. Allan Sudale 5. Lisa Jayne 7. Nicole Santer | 7,219 | 6.2 | −1.15 [lower-alpha 9] | |
Independent | Wen Zhou | 133 | 0.1 | ||
Independent | John McFadden | 75 | 0.1 | ||
Total formal votes | 118,511 | 98.6 | |||
Informal votes | 1,675 | 1.4 | |||
Turnout | 120,186 | 68.7 | |||
Party total seats | Seats | ± | |||
Team Clover | 4 | 1 | |||
Liberal | 2 | ||||
Labor | 2 | ||||
Greens | 1 | 1 | |||
Independent | 1 | 1 | |||
Small Business | 0 | 1 | |||
Elected councillor | Party | |
---|---|---|
Michael Henderson | Clean Out Council | |
Richard Foley | Clean Out Council | |
Dan Hayes | Labor | |
Amelia Parkins | Labor | |
Rod Kendall | Independent (Group D) | |
Dallas Tout | Community First | |
Jenny McKinnon | Greens | |
Tim Koschel | Here For You | |
Georgie Davis | Getting It Done |
Party | Candidate | Votes | % | ±% | |
---|---|---|---|---|---|
Clean Out Council | 9,201 | 25.6 | |||
Labor | 8,279 | 23.1 | +6.1 | ||
Independent (Group D) | 4,416 | 12.3 | |||
Community First | 3,576 | 10.0 | |||
Greens | 3,347 | 9.3 | +5.0 | ||
Here For You | 2,808 | 7.8 | |||
Getting It Done | 2,291 | 6.4 | |||
Independent (Group F) | 837 | 2.3 | +2.3 | ||
Independent Liberal | Robert Sinclair | 572 | 1.6 | ||
Independent Liberal | Rosina Gordon | 287 | 0.8 | ||
Independent | Richard Salcole | 235 | 0.7 | ||
Independent Liberal | Robin Dennis | 20 | 0.1 | ||
Independent Liberal | Daniel Vieria | 16 | 0.0 | ||
Total formal votes | 35,885 | 93.2 | |||
Informal votes | 2,634 | 6.8 | |||
Turnout | 38,519 | 83.3 |
The Division of Fowler is an Australian electoral division in the state of New South Wales.
The Division of Riverina is an Australian electoral division in the state of New South Wales.
The 2007 New South Wales state election was held on Saturday, 24 March 2007. The entire Legislative Assembly and half of the Legislative Council was up for election. The Labor Party led by Morris Iemma won a fourth four-year term against the Liberal-National coalition led by Peter Debnam.
Maxwell Shayne Mallard is an Australian politician. He was a Liberal Party member of the New South Wales Legislative Council from 2015 until 2023. He was formerly a councillor of the City of South Sydney from 2000 to 2004, and of the City of Sydney from 2004 to 2012.
Bart Edward Bassett is an Australian politician. He was a member of the New South Wales Legislative Assembly from 2011 to 2015, representing the electorate of Londonderry. He was elected as a member of the Liberal Party, but resigned to sit as an independent in August 2014 following revelations about his conduct at hearings of the New South Wales Independent Commission Against Corruption (ICAC). He was formerly mayor of the City of Hawkesbury from 2007 until 2012.
Melanie Rhonda Gibbons is an Australian politician who was a member of the New South Wales Legislative Assembly representing Menai from 2011 to 2015 and Holsworthy for the Liberal Party from 2015 to 2023.
This article provides details on candidates for the 2015 New South Wales state election, held on 28 March 2015.
CountryMinded was an Australian political party formed in 2014 that claimed to represent the interests of regional Australians whose livelihoods depend either directly or indirectly on agricultural production. The party was founded by a group of people looking for accountable regional representation, including two brothers from New South Wales, David and Peter Mailler as the Country Party of Australia, and changed its name to CountryMinded in September 2015. In 2018, the party merged with the Australian Democrats.
The 2019 New South Wales state election was held on Saturday 23 March 2019 to elect the 57th Parliament of New South Wales, including all 93 seats in the Legislative Assembly and 21 of the 42 seats in the Legislative Council. The election was conducted by the New South Wales Electoral Commission (NSWEC).
A by-election was held in the New South Wales state electoral district of Wagga Wagga on 8 September 2018. The by-election was triggered by the resignation of Daryl Maguire, a Liberal-turned-independent. Maguire resigned from Parliament the previous month after admitting to a corruption inquiry that he sought payment over a property deal.
The 2023 New South Wales state election was held on 25 March 2023 to elect the 58th Parliament of New South Wales, including all 93 seats in the Legislative Assembly and 21 of the 42 seats in the Legislative Council. The election was conducted by the New South Wales Electoral Commission (NSWEC).
Elections to Perth and Kinross Council were held on 5 May 2022 as part of the 2022 Scottish local elections. 40 Councillors were elected from 12 multi-members electoral wards under the Single Transferable Vote electoral system. The Scottish Conservatives had run Perth and Kinross Council as a minority administration immediately prior to the election, with a previous coalition with the Scottish Liberal Democrats collapsing mid-way through the term. Twelve incumbent Councillors, including two group leaders, decided not to seek re-election whilst others stood again but lost their seats.
The 2021 Sydney City Council election was held on 4 December 2021 to elect nine councillors and a lord mayor to the City of Sydney. The election was held as part of the statewide local government elections in New South Wales, Australia.
The 2021 New South Wales local elections were held on 4 December 2021 to elect the councils of 161 of the 168 local government areas (LGAs) in New South Wales. Several councils also held mayoral elections and/or referendums.
The 2017 New South Wales local elections were held on 9 September 2017 to elect the councils of 46 of the 168 local government areas (LGAs) in New South Wales. Several councils also held mayoral elections and/or referendums.
The 2012 New South Wales local elections were held on 8 September 2012 to elect the councils of 150 of the 152 local government areas (LGAs) of New South Wales. Several councils also held mayoral elections and/or referendums.
Our Local Community (OLC) is an Australian political party that competes in local elections in New South Wales. The party was formed in 2013 by former Parramatta mayor Paul Garrard, and is currently registered with the New South Wales Electoral Commission.
The 2024 New South Wales local elections are scheduled to be held on 14 September 2024 to elect the councils of the 126 local government areas (LGAs) in New South Wales. Several councils will also hold mayoral elections.
This is a list of local government area results for the 2017 New South Wales local elections.
I am a member of [...] the Liberal Party of Australia NSW Division
Cr Winchester, who is a member of the Labor Party but sits on council as an independent