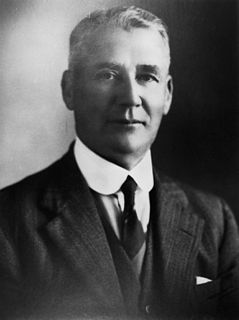
Queensland state election, 29 March 1941 [1] Contents
| ||||||
---|---|---|---|---|---|---|
Enrolled voters | 586,147 [1] | |||||
Votes cast | 529,247 | Turnout | 90.29 | –2.22 | ||
Informal votes | 9,520 | Informal | 1.80 | +0.49 | ||
Summary of votes by party | ||||||
Party | Primary votes | % | Swing | Seats | Change | |
Labor | 267,206 | 51.41 | +4.24 | 41 | – 3 | |
Country | 108,604 | 20.90 | –1.75 | 14 | + 1 | |
United Australia | 81,109 | 15.61 | +1.64 | 4 | ± 0 | |
Independent Socialist [2] | 16,044 | 3.09 | +1.49 | 0 | ± 0 | |
Independent Democrat | 10,406 | 2.00 | +2.00 | 2 | + 2 | |
Protestant Labor | 9,038 | 1.74 | –7.01 | 0 | – 1 | |
Independent Labor QLD | 5,476 | 1.05 | +1.05 | 1 | + 1 | |
Independent | 21,844 | 4.20 | +3.56 | 0 | ± 0 | |
Total | 519,727 | 62 | ||||
This is a list of electoral district results for the 1941 Queensland state election for electorates from A to K.
This is a list of current and former electoral divisions for the Legislative Assembly of Queensland, the state legislature for Queensland, Australia.
At the time, the voting system in Queensland was based on contingency voting, which was similar to the modern optional preferential voting system. In electorates with 3 or more candidates, preferences were not distributed if a candidate received more than 50% of the primary vote.
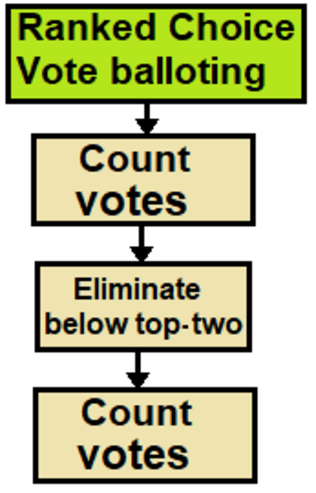
The contingent vote is an electoral system used to elect a single winner. It is a variation of instant-runoff voting, in which the voter ranks the candidates in order of preference.
If none received more than 50%, all except the top two candidates were eliminated from the count and their preferences distributed between the two leaders, with the one receiving the most votes declared the winner.
Party | Candidate | Votes | % | ± | |
---|---|---|---|---|---|
Country | Tom Plunkett | 5,617 | 62.4 | +21.9 | |
Labor | John Bray | 3,386 | 37.6 | +9.0 | |
Total formal votes | 9,003 | 98.3 | -0.7 | ||
Informal votes | 156 | 1.7 | +0.7 | ||
Turnout | 9,159 | 87.3 | -5.1 | ||
Country hold | Swing | +7.5 | |||
Party | Candidate | Votes | % | ± | |
---|---|---|---|---|---|
Country | Jim Sparkes | 5,451 | 63.3 | -2.4 | |
Labor | Adolphus Baker | 3,163 | 36.7 | +12.7 | |
Total formal votes | 8,614 | 99.4 | +0.5 | ||
Informal votes | 50 | 0.6 | -0.5 | ||
Turnout | 8,664 | 93.0 | +0.4 | ||
Country hold | Swing | -9.9 | |||
Party | Candidate | Votes | % | ± | |
---|---|---|---|---|---|
Labor | Frank Bulcock | 4,809 | 79.6 | -20.4 | |
Country | Robert McGeoch | 1,229 | 20.4 | +20.4 | |
Total formal votes | 6,038 | 97.1 | |||
Informal votes | 181 | 2.9 | |||
Turnout | 6,219 | 80.2 | |||
Labor hold | Swing | N/A | |||
Frank William Bulcock was a Member of the Queensland Legislative Assembly.
Party | Candidate | Votes | % | ± | |
---|---|---|---|---|---|
Labor | Ned Davis | 3,686 | 67.6 | -12.0 | |
Independent Labor | J. Howe | 1,062 | 19.5 | +19.5 | |
Independent | O.P.J. O'Beirne | 704 | 12.9 | +12.9 | |
Total formal votes | 5,452 | 98.7 | +1.6 | ||
Informal votes | 70 | 1.3 | -1.6 | ||
Turnout | 5,522 | ||||
Labor hold | Swing | N/A | |||
Party | Candidate | Votes | % | ± | |
---|---|---|---|---|---|
Labor | Bill Power | 5,317 | 59.9 | +10.3 | |
United Australia | Cecil Noble | 3,564 | 40.1 | +17.3 | |
Total formal votes | 8,881 | 97.6 | -1.1 | ||
Informal votes | 219 | 2.4 | +1.1 | ||
Turnout | 9,100 | 89.6 | -2.8 | ||
Labor hold | Swing | N/A | |||
Party | Candidate | Votes | % | ± | |
---|---|---|---|---|---|
Labor | Ernest Riordan | 4,152 | 52.7 | +13.5 | |
Independent Socialist | Fred Paterson | 3,733 | 47.3 | +18.0 | |
Total formal votes | 7,885 | 96.6 | -2.6 | ||
Informal votes | 275 | 3.4 | +2.6 | ||
Turnout | 8,160 | 91.0 | -3.6 | ||
Labor hold | Swing | -4.5 | |||
Party | Candidate | Votes | % | ± | |
---|---|---|---|---|---|
Labor | Frank Cooper | 7,141 | 83.5 | +0.1 | |
Independent Socialist | Geordie Burns | 1,411 | 16.5 | -0.1 | |
Total formal votes | 8,552 | 97.2 | +0.3 | ||
Informal votes | 249 | 2.8 | -0.3 | ||
Turnout | 8,801 | 94.0 | -1.0 | ||
Labor hold | Swing | +0.1 | |||
Party | Candidate | Votes | % | ± | |
---|---|---|---|---|---|
Labor | Johnno Mann | 4,749 | 57.4 | -8.6 | |
United Australia | Neville Fogerty | 2,856 | 34.5 | +0.5 | |
Independent Socialist | Claude Jones | 670 | 8.1 | +8.1 | |
Total formal votes | 8,275 | 97.6 | -0.7 | ||
Informal votes | 199 | 2.4 | +0.7 | ||
Turnout | 8,474 | 86.8 | -1.4 | ||
Labor hold | Swing | -3.6 | |||
Party | Candidate | Votes | % | ± | |
---|---|---|---|---|---|
Labor | George Marriott | 7,181 | 70.1 | +10.3 | |
United Australia | Daniel Miller | 3,067 | 29.9 | +8.1 | |
Total formal votes | 10,248 | 97.4 | -0.2 | ||
Informal votes | 275 | 2.6 | +0.2 | ||
Turnout | 10,523 | 93.7 | -1.7 | ||
Labor hold | Swing | -3.2 | |||
Party | Candidate | Votes | % | ± | |
---|---|---|---|---|---|
Independent Labor | Frank Barnes | 5,476 | 51.1 | +51.1 | |
Labor | Bernard McLean | 4,356 | 48.9 | +4.8 | |
Total formal votes | 10,715 | 97.8 | -1.4 | ||
Informal votes | 246 | 2.2 | +1.4 | ||
Turnout | 10,961 | 93.4 | -2.1 | ||
Independent Labor gain from Labor | Swing | N/A | |||
Party | Candidate | Votes | % | ± | |
---|---|---|---|---|---|
Labor | Ted Hanson | 5,745 | 56.9 | +6.0 | |
United Australia | Hector Annat | 4,345 | 43.1 | +19.2 | |
Total formal votes | 10,090 | 97.9 | -0.6 | ||
Informal votes | 216 | 2.1 | +0.6 | ||
Turnout | 10,306 | 91.5 | -2.6 | ||
Labor hold | Swing | -11.1 | |||
Party | Candidate | Votes | % | ± | |
---|---|---|---|---|---|
Labor | John O'Keefe | 5,003 | 55.4 | -0.9 | |
Country | William Griffen | 3,193 | 35.3 | +12.9 | |
Independent | Alan Tucker | 835 | 9.3 | +9.3 | |
Total formal votes | 9,031 | 98.5 | -0.3 | ||
Informal votes | 135 | 1.5 | +0.3 | ||
Turnout | 9,166 | 87.0 | -3.6 | ||
Labor hold | Swing | -10.5 | |||
John O'Keefe was an Australian politician. He was a Labor member of the Legislative Assembly of Queensland, representing Chillagoe from 1926 to 1929 and Cairns from 1930 to 1942. He was Attorney-General from 1940 to 1941.
Party | Candidate | Votes | % | ± | |
---|---|---|---|---|---|
Labor | David Crowley | 2,169 | 31.5 | -23.9 | |
Independent Labor | Lou Barnes | 2,101 | 30.5 | +30.5 | |
Independent | Herbert Tucker | 1,776 | 25.7 | +16.4 | |
Independent | William Griffin | 851 | 12.3 | +12.3 | |
Total formal votes | 6,897 | 99.1 | +0.6 | ||
Informal votes | 58 | 0.9 | -0.6 | ||
Turnout | 6,955 | 67.5 | -19.5 | ||
Two-candidate-preferred result | |||||
Independent Labor | Lou Barnes | 2,536 | 52.1 | ||
Labor | David Crowley | 2,334 | 47.9 | ||
Independent Labor gain from Labor | Swing | N/A | |||
Party | Candidate | Votes | % | ± | |
---|---|---|---|---|---|
Labor | Paul Hilton | unopposed | |||
Labor hold | Swing | ||||
Party | Candidate | Votes | % | ± | |
---|---|---|---|---|---|
Labor | Norm Smith | 3,054 | 51.8 | -4.0 | |
Independent | James Boyd | 2,838 | 48.2 | +48.2 | |
Total formal votes | 5,892 | 98.6 | -0.2 | ||
Informal votes | 83 | 1.4 | +0.2 | ||
Turnout | 5,975 | 72.7 | -7.1 | ||
Labor hold | Swing | N/A | |||
Party | Candidate | Votes | % | ± | |
---|---|---|---|---|---|
Labor | Arthur Jones | 4,023 | 63.2 | -36.8 | |
Protestant Labor | Syd Williams | 2,344 | 36.8 | +36.8 | |
Total formal votes | 6,367 | 98.6 | |||
Informal votes | 89 | 1.4 | |||
Turnout | 6,456 | 82.9 | |||
Labor hold | Swing | N/A | |||
Party | Candidate | Votes | % | ± | |
---|---|---|---|---|---|
Labor | Harold Collins | 4,388 | 57.0 | -2.0 | |
Country | James McDonald | 3,315 | 43.0 | +9.2 | |
Total formal votes | 7,703 | 95.4 | -2.6 | ||
Informal votes | 368 | 4.6 | +2.6 | ||
Turnout | 8,071 | 89.0 | -1.4 | ||
Labor hold | Swing | -6.5 | |||
Party | Candidate | Votes | % | ± | |
---|---|---|---|---|---|
Country | Harry Walker | unopposed | |||
Country hold | Swing | ||||
Party | Candidate | Votes | % | ± | |
---|---|---|---|---|---|
Independent Country | William Deacon | 4,062 | 47.4 | +47.4 | |
Labor | John Hilton | 2,806 | 32.7 | +32.7 | |
Country | Herbert Castles | 1,704 | 19.9 | -80.1 | |
Total formal votes | 8,572 | 99.2 | |||
Informal votes | 66 | 0.8 | |||
Turnout | 8,638 | 92.1 | |||
Two-candidate-preferred result | |||||
Independent Country | William Deacon | 5,492 | 65.8 | -34.2 | |
Labor | John Hilton | 2,860 | 34.2 | +34.2 | |
Independent Country gain from Country | Swing | N/A | |||
Party | Candidate | Votes | % | ± | |
---|---|---|---|---|---|
Labor | Aubrey Slessar | 5,434 | 56.0 | +5.7 | |
Country | Godfrey Morgan | 4,262 | 44.0 | -5.7 | |
Total formal votes | 9,696 | 99.2 | +0.3 | ||
Informal votes | 74 | 0.8 | -0.3 | ||
Turnout | 9,770 | 87.1 | -4.6 | ||
Labor hold | Swing | +5.7 | |||
Party | Candidate | Votes | % | ± | |
---|---|---|---|---|---|
Country | Herbert Yeates | 4,623 | 54.2 | +23.1 | |
Labor | James Kane | 3,906 | 45.8 | +0.4 | |
Total formal votes | 8,529 | 98.1 | -0.5 | ||
Informal votes | 167 | 1.9 | +0.5 | ||
Turnout | 8,696 | 93.5 | +3.4 | ||
Country hold | Swing | +2.8 | |||
Party | Candidate | Votes | % | ± | |
---|---|---|---|---|---|
Labor | George Taylor | 5,597 | 50.5 | -4.2 | |
United Australia | Ernest Lanham | 4,786 | 43.1 | +20.8 | |
Independent | Mabel Matyer | 708 | 6.4 | +6.4 | |
Total formal votes | 11,091 | 98.3 | -0.9 | ||
Informal votes | 193 | 1.7 | +0.9 | ||
Turnout | 11,284 | 93.4 | -1.5 | ||
Labor hold | Swing | -16.5 | |||
Party | Candidate | Votes | % | ± | |
---|---|---|---|---|---|
Country | Alf Muller | 5,981 | 64.7 | -2.6 | |
Labor | Peter Nelson | 3,265 | 35.3 | +2.6 | |
Total formal votes | 9,246 | 97.8 | -0.8 | ||
Informal votes | 212 | 2.2 | +0.8 | ||
Turnout | 9,458 | 93.0 | -1.7 | ||
Country hold | Swing | -2.6 | |||
Party | Candidate | Votes | % | ± | |
---|---|---|---|---|---|
Labor | Jim Clark | unopposed | |||
Labor hold | Swing | ||||
Party | Candidate | Votes | % | ± | |
---|---|---|---|---|---|
Labor | Samuel Brassington | 5,005 | 56.5 | +0.1 | |
United Australia | Ernest Downey | 3,851 | 43.5 | +16.1 | |
Total formal votes | 8,856 | 98.0 | -0.7 | ||
Informal votes | 180 | 2.0 | +0.7 | ||
Turnout | 9,036 | 90.4 | -2.9 | ||
Labor hold | Swing | -10.5 | |||
Party | Candidate | Votes | % | ± | |
---|---|---|---|---|---|
Labor | George Devries | 2,709 | 54.2 | -10.7 | |
Independent | Charles Brown | 2,291 | 45.8 | +45.8 | |
Total formal votes | 5,000 | 97.3 | -0.6 | ||
Informal votes | 136 | 2.7 | +0.6 | ||
Turnout | 5,136 | 72.6 | -8.8 | ||
Labor gain from Independent | Swing | N/A | |||
Party | Candidate | Votes | % | ± | |
---|---|---|---|---|---|
Labor | Thomas Dunstan | 3,738 | 52.4 | +9.4 | |
United Australia | Ronald Witham | 2,142 | 30.0 | +30.0 | |
Country | William Kidd | 1,251 | 17.5 | -4.1 | |
Total formal votes | 7,131 | 99.5 | +0.2 | ||
Informal votes | 39 | 0.5 | -0.2 | ||
Turnout | 7,170 | 93.3 | -0.4 | ||
Labor hold | Swing | N/A | |||
Party | Candidate | Votes | % | ± | |
---|---|---|---|---|---|
Independent | Bruce Pie | 6,221 | 63.8 | +63.8 | |
United Australia | Hugh Russell | 3,538 | 36.2 | -32.5 | |
Total formal votes | 9,759 | 98.0 | -0.7 | ||
Informal votes | 194 | 2.0 | +0.7 | ||
Turnout | 9,953 | 91.5 | -2.8 | ||
Independent gain from United Australia | Swing | N/A | |||
Arthur Bruce Pie was an Australian politician who served in the Legislative Assembly of Queensland.
Party | Candidate | Votes | % | ± | |
---|---|---|---|---|---|
People's Party | John Chandler | 5,069 | 54.7 | +18.5 | |
Country | Graham Hart | 2,231 | 24.1 | +24.1 | |
Labor | Frank Roberts | 1,967 | 21.2 | +21.2 | |
Total formal votes | 9,267 | 99.3 | +1.3 | ||
Informal votes | 62 | 0.7 | -1.3 | ||
Turnout | 9,329 | ||||
People's Party gain from Independent | Swing | N/A | |||
Party | Candidate | Votes | % | ± | |
---|---|---|---|---|---|
Labor | Stephen Theodore | 5,182 | 56.2 | +3.3 | |
Country | Alfred Moule | 2,417 | 26.2 | +8.3 | |
Independent Socialist | Jack Wells | 1,617 | 17.5 | +0.5 | |
Total formal votes | 9,216 | 98.2 | -0.2 | ||
Informal votes | 166 | 1.8 | +0.2 | ||
Turnout | 9,382 | 91.7 | +4.5 | ||
Labor hold | Swing | -6.5 | |||
Party | Candidate | Votes | % | ± | |
---|---|---|---|---|---|
Labor | David Gledson | 6,630 | 66.8 | +0.8 | |
Country | John Cantwell | 2,534 | 25.5 | +25.5 | |
Independent Socialist | Merv Welsby | 756 | 7.6 | +7.6 | |
Total formal votes | 9,920 | 98.3 | -0.1 | ||
Informal votes | 171 | 1.7 | +0.1 | ||
Turnout | 10,091 | 95.1 | -0.8 | ||
Labor hold | Swing | +6.3 | |||
Party | Candidate | Votes | % | ± | |
---|---|---|---|---|---|
Country | William Brand | 4,979 | 59.1 | -5.6 | |
Labor | William Ivey | 3,439 | 40.9 | +5.6 | |
Total formal votes | 8,418 | 97.8 | -0.8 | ||
Informal votes | 190 | 2.2 | +0.8 | ||
Turnout | 8,608 | 95.5 | +0.8 | ||
Country hold | Swing | -5.6 | |||
Party | Candidate | Votes | % | ± | |
---|---|---|---|---|---|
Labor | Ned Hanlon | 6,155 | 56.9 | +7.0 | |
Independent | Alexander Jolly | 4,174 | 38.6 | +38.6 | |
Independent Socialist | Ted Bacon | 495 | 4.6 | +4.6 | |
Total formal votes | 10,824 | 98.6 | -0.5 | ||
Informal votes | 158 | 1.4 | +0.5 | ||
Turnout | 10,982 | 93.2 | -1.6 | ||
Labor hold | Swing | N/A | |||
Party | Candidate | Votes | % | ± | |
---|---|---|---|---|---|
Labor | Bert Turner | 5,449 | 50.7 | +8.2 | |
Independent UAP | Richard Hill | 2,654 | 24.7 | +24.7 | |
Independent | George Morris | 2,646 | 24.6 | +24.6 | |
Total formal votes | 10,749 | 98.7 | -0.8 | ||
Informal votes | 142 | 1.3 | +0.8 | ||
Turnout | 10,891 | 92.3 | -3.0 | ||
Labor gain from Independent | Swing | N/A | |||
Party | Candidate | Votes | % | ± | |
---|---|---|---|---|---|
Labor | Cecil Jesson | 5,210 | 57.7 | -6.1 | |
Country | Aubrey Jurd | 2,833 | 31.4 | -4.8 | |
Independent Socialist | Florence Milburn | 980 | 10.9 | +10.9 | |
Total formal votes | 9,023 | 98.2 | +0.3 | ||
Informal votes | 161 | 1.8 | -0.3 | ||
Turnout | 9,184 | 88.4 | -1.7 | ||
Labor hold | Swing | +1.0 | |||
Party | Candidate | Votes | % | ± | |
---|---|---|---|---|---|
Country | David Daniel | 4,417 | 53.0 | -1.2 | |
Labor | Walter Ingram | 3,206 | 38.5 | +38.5 | |
Independent | Ezra Shorley | 714 | 8.6 | +8.6 | |
Total formal votes | 8,337 | 98.9 | +0.2 | ||
Informal votes | 90 | 1.1 | -0.2 | ||
Turnout | 8,427 | 90.0 | -2.3 | ||
Country hold | Swing | N/A | |||
Party | Candidate | Votes | % | ± | |
---|---|---|---|---|---|
Labor | Kerry Copley | 4,556 | 48.4 | +1.6 | |
United Australia | Norman Brandon | 4,374 | 46.5 | +21.0 | |
Independent Socialist | Ruby McGrorty | 477 | 5.1 | +0.7 | |
Total formal votes | 9,407 | 98.4 | -0.2 | ||
Informal votes | 153 | 1.6 | +0.2 | ||
Turnout | 9,560 | 85.5 | -5.8 | ||
Two-party-preferred result | |||||
Labor | Kerry Copley | 4,629 | 50.9 | -5.2 | |
United Australia | Norman Brandon | 4,469 | 49.1 | +5.2 | |
Labor hold | Swing | -5.2 | |||
This is a list of candidates who stood for the 1944 Queensland state election. The election was held on 15 April 1944.
This is a list of candidates who stood for the 1929 Queensland state election. The election was held on 11 May 1929.
This is a list of candidates who stood for the 1963 Queensland state election. The election was held on 1 June 1963.
This is a list of electoral results for the electoral district of Logan in Queensland state elections.
This is a list of electoral results for the electoral district of Mackay in Queensland state elections.
The Queensland Party was a minor political party in Queensland that was active in the 1930s. It contested the 1932 Queensland state election. It was led by T.C. Brooks, its Party President.
This is a list of electoral results for the electoral district of Aubigny in Queensland state elections.
This is a list of electoral district results for the 1977 Queensland state election.
This is a list of electoral district results for the 1963 Queensland state election.
This is a list of electoral district results for the 1956 Queensland state election.
This is a list of electoral district results for the 1953 Queensland state election.
This is a list of electoral district results for the 1950 Queensland state election.
This is a list of electoral district results for the 1947 Queensland state election.
This is a list of electoral district results for the 1944 Queensland state election.
This is a list of electoral district results for the 1938 Queensland state election.
This is a list of electoral district results for the 1935 Queensland state election.
This is a list of electoral district results for the 1932 Queensland state election.
This is a list of electoral district results for the 1929 Queensland state election.
This is a list of electoral district results for the 1926 Queensland state election.
This is a list of electoral district results for the 1920 Queensland state election.