SharePoint Dashboard

Last updated
A SharePoint dashboard provides an at-a-glance snapshot of key data gathered from several sources. SharePoint Dashboard Bar Graph.jpg
A SharePoint dashboard provides an at-a-glance snapshot of key data gathered from several sources.

A dashboard is a document presenting the most significant information about a subject on a single page. [1] Microsoft SharePoint is a web application platform launched in 2001 as a centralized replacement for multiple web applications and supports various combinations of enterprise website requirements. A Microsoft SharePoint Dashboard is a feature of the Microsoft SharePoint platform that aggregates data from other systems and displays it in a browser-based location.

Dashboard control panel located directly ahead of a vehicles driver, displaying instrumentation and controls for the vehicles operation

A dashboard is a control panel usually located directly ahead of a vehicle's driver, displaying instrumentation and controls for the vehicle's operation.

A document is a written, drawn, presented, or memorialized representation of thought. The word originates from the Latin documentum, which denotes a "teaching" or "lesson": the verb doceō denotes "to teach". In the past, the word was usually used to denote a written proof useful as evidence of a truth or fact. In the computer age, "document" usually denotes a primarily textual computer file, including its structure and format, e.g. fonts, colors, and images. Contemporarily, "document" is not defined by its transmission medium, e.g., paper, given the existence of electronic documents. "Documentation" is distinct because it has more denotations than "document". Documents are also distinguished from "realia", which are three-dimensional objects that would otherwise satisfy the definition of "document" because they memorialize or represent thought; documents are considered more as 2 dimensional representations. While documents are able to have large varieties of customization, all documents are able to be shared freely, and have the right to do so, creativity can be represented by documents, also. History, events, examples, opinion, etc. all can be expressed in documents.

Web application application that uses a web browser as a client

In computing, a web application or web app is a client–server computer program that the client runs in a web browser. Common web applications include webmail, online retail sales, online banking, and online auction.

Contents

Key performance indicators

SharePoint dashboards are useful in displaying the status of Key Performance Indicators. SharePointDashboard.jpg
SharePoint dashboards are useful in displaying the status of Key Performance Indicators.

Key performance indicators (KPIs) are measurements of an organization's key success factors. KPIs are often established at the departmental level to achieve organizational goals. To be successfully implemented, KPIs should focus on metrics that are specific, measurable, and clearly communicated. [2] SharePoint Dashboards are ideal for displaying the status of KPIs, because their quantifiable data can be pulled from multiple systems and provide a graphical summary of what is stored within the quantifiable data systems. SharePoint dashboards are not meant to replace the proprietary systems.

Proprietary software, also known as closed-source software, is a non-free computer software for which the software's publisher or another person retains intellectual property rights—usually copyright of the source code, but sometimes patent rights.

SharePoint Dashboard Data Sources

This social media SharePoint dashboard aggregates data from several sources and graphically displays it in a browser-based location. SharePoint Dashboard Social Media Graphs.jpg
This social media SharePoint dashboard aggregates data from several sources and graphically displays it in a browser-based location.

SharePoint Dashboards certainly aggregate data stored in any edition of Microsoft SharePoint. SharePoint 2010, SharePoint Foundation, WSS, and MOSS are examples of widely implemented SharePoint editions that graphically display data stored in SharePoint document libraries and lists. The data may be configured in a variety of views and chart types with standard and custom features. [3]

Examples of other systems from which SharePoint dashboards can retrieve data [4] include:

Customer relationship management systems

Customer relationship management (CRM) systems enable organizations to record and organize their interactions with customers, vendors, sales leads, and other contacts. Key contact information such as email address, phone number, and company website as well as communication history and notes are examples of information that is typically stored in a CRM system.

Customer relationship management (CRM) is an approach to manage a company's interaction with current and potential customers. It uses data analysis about customers' history with a company to improve business relationships with customers, specifically focusing on customer retention and ultimately driving sales growth.

Commonly used CRM systems include Act!, GoldMine, Microsoft CRM, and Salesforce.

Act! CRM software

Act! is a customer relationship management (CRM) software application which is used to keep track of client and prospect details in a single database that can be shared by multiple users. It integrates with Microsoft Word, Excel, Outlook, Google Contacts, Gmail and other popular applications in order to generate and track communications with the contacts maintained in ACT!. It is developed by Swiftpage and has a user base of over 2.8 million registered users.

Microsoft Dynamics CRM is a customer relationship management software package developed by Microsoft. The product focuses mainly on sales, marketing, and service sectors, but Microsoft has been marketing Dynamics CRM as a CRM platform and has been encouraging partners to use its once proprietary, now Open Source framework to customize it. It is part of the Microsoft Dynamics family of business applications.

Salesforce.com American software company

Salesforce.com, Inc. is an American cloud-based software company headquartered in San Francisco, California. Though the bulk of its revenue comes from its customer-relationship management (CRM) service, Salesforce also sells a complementary suite of enterprise applications focused on customer service, marketing automation, analytics and application development.

Enterprise resource planning and accounting systems

Enterprise resource planning (ERP) systems use integrated software applications to combine organizational information cross-functionally for use across the organization. Accounting systems are responsible for reporting an organization's financial information.

Examples of ERP and Accounting systems include Microsoft Dynamics, Oracle Financials, Peachtree Accounting, QuickBooks, and SAP.

Marketing and social media resources

An organization's marketing resources aim to identify, communicate with, and deliver value to its customers. Social media resources employ the use of web-based and mobile applications to promote the exchange of user-generated content.

Popular Marketing and Social Media applications include Facebook, Google Analytics, Internet Marketing, and Twitter.

Selecting a data aggregation method

There are many means of aggregating information to be displayed in a SharePoint Dashboard. Some common methods include Application Programming Interface (API), Business Connectivity Service/Business Data Catalogue, Microsoft Excel, and Open Database Connectivity (ODBC).

Comparing Dashboard Options

SharePoint automatically aggregates data from various systems, displaying current information in a holistic dashboard view. SharePointDashboardSilverlight.jpg
SharePoint automatically aggregates data from various systems, displaying current information in a holistic dashboard view.

Automated aggregation

Excel

Many organisations[ who? ] use Microsoft Excel as a tool to collect data. This data is typically entered the spreadsheet manually.

SharePoint

Microsoft SharePoint can automatically gather data from a variety of systems and store the data in a central browser-based location. Any browser equipped device can then view the data.

Third-party tools

Third-party software components also offer automatic collection and display of data. Some tools are browser-enabled, but most require installation of software on a user's computer.

SQL Server Reporting Services (SSRS)

SQL Server Reporting Services provides user-friendly tools to format and report on data stored inside a SQL Server database.

Manual aggregation

Many organizations display internal goal progress manually on a whiteboard. Posting data centrally allows team members to view progress but requires continual updates. ManualDashboardThermometer.jpg
Many organizations display internal goal progress manually on a whiteboard. Posting data centrally allows team members to view progress but requires continual updates.

Whiteboard

Many organizations [ who? ] choose to display their internal goal progress manually on a whiteboard. Posting it in a central location enables all team members to monitor progress. The manual method requires one or more members to continually update the whiteboard with timely data. This is a simple dashboard approach, but it often gets out-of-date quickly.

Paper graphics

Simply printing out dashboard graphics on paper and displaying them in a central location can have a positive effect on internal goals. [5] The process of manually creating and posting paper dashboards, however, can become cumbersome to maintain on a regular basis. This is also a simple dashboard approach that often gets out of date quickly.

Promoting the use of dashboards

There are several strategies for promoting the use of dashboards and streamlining internal acceptance of the practice.

Automate data collection

Real-time results allow team members to track the latest data and focus on achieving internal goals rather than create manual dashboards. Although time must be spent up-front to set up dashboard automation, automating data collection is likely to save time in the long run. [5]

Celebrate victories

Announcing the achievement of departmental goals encourages a team to stay on track and continually progress toward desired organizational goals. Seeing results posted regularly on a dashboard also provides teams with motivation to achieve a goal target and see how their actions directly contribute to the achievement of a goal. [6]

Involve key stakeholders

Ensure key stakeholders are involved in the decision process for setting the critical Key Performance Indicators used in naming goals. This will motivate them to get their teams on board and offer a better chance of wide organizational adoption. Care should be taken to limit the number of KPIs tracked by any department to fewer than ten. If everything is important, nothing is.

Make it easy to share results

Display results in a transparent and easily accessible location. This will allow team members to see how their work affects the progress toward organizational goals. [6] SharePoint is one of the easiest and most effective tools for sharing dashboard results since it is browser-enabled and can be accessed from browser-equipped mobile devices. Dashboards displayed on LCD screens are also highly effective for sharing results.

Related Research Articles

Microsoft Access database manager that is part of the Microsoft Office package

Microsoft Access is a database management system (DBMS) from Microsoft that combines the relational Microsoft Jet Database Engine with a graphical user interface and software-development tools. It is a member of the Microsoft Office suite of applications, included in the Professional and higher editions or sold separately.

An intranet is a computer network for sharing corporate information, collaboration tools, operational systems, and other computing services only within an organization, and to the exclusion of access by outsiders to the organization. The term is used in contrast to public networks, such as the Internet, but uses most of the same technology based on the Internet Protocol Suite.

Microsoft Dynamics GP is a mid-market business accounting software or ERP software package marketed in North and South America, UK and Ireland, the Middle East, Singapore, Australia and New Zealand. It is used in many additional countries with partner supported localizations. It uses either Microsoft SQL Server 2005, 2008, 2012, 2014 or 2016 to store data. It is one of four accounting packages acquired by Microsoft that now share the Microsoft Dynamics Business Solutions brand. Dynamics GP is written in a language called Dexterity.

Windows Registry hierarchical database that stores configuration settings and options on Microsoft Windows operating systems

The Windows Registry is a hierarchical database that stores low-level settings for the Microsoft Windows operating system and for applications that opt to use the registry. The kernel, device drivers, services, Security Accounts Manager, and user interface can all use the registry. The registry also allows access to counters for profiling system performance.

Web conferencing Forms of online many-to-many communication

Web conferencing may be used as an umbrella term for various types of online collaborative services including web seminars ("webinars"), webcasts, and peer-level web meetings. It may also be used in a more narrow sense to refer only to the peer-level web meeting context, in an attempt to disambiguate it from the other types of collaborative sessions. Terminology related to these technologies is inexact, and no generally agreed upon source or standards organization exists to provide an established usage reference.

Desktop organizer software applications are applications that automatically create useful organizational structures from desktop content from heterogeneous types of content including email, files, contacts, companies, RSS news feeds, photos, music and chat sessions. The organization is based on a combination of automated scanning of metadata similar to data mining and manual tagging of content. The metadata stored in applications is correlated based on a structure for the data type handled by the organizer tool. For example, the email address of a sender of an email allows the email to be filed in a virtual folder for the author and company the author works for or a music file is filed by the musician and album label. The resulting visualization simplifies use of desktop content to navigate, search, and use related information stored on the desktop computer. The data in desktop organizer tools is normally stored in a database rather than the computer's file system in order to produce virtual folders where the same item can appear in multiple folders to the user based on its relationship to the folder.

Business activity monitoring (BAM) is software that aids in monitoring of business activities, key performance indicators, business / operational exceptions and business risks, as those activities are implemented in computer systems.

Business intelligence software is a type of application software designed to retrieve, analyze, transform and report data for business intelligence. The applications generally read data that has been previously stored, often - though not necessarily - in a data warehouse or data mart.

Dashboard (business) aggregate business progress report

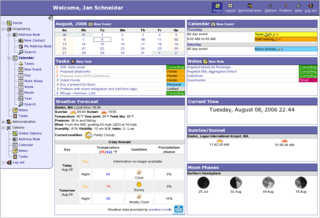
A dashboard is a type of graphical user interface which often provides at-a-glance views of key performance indicators (KPIs) relevant to a particular objective or business process. In other usage, "dashboard" is another name for "progress report" or "report."

Microsoft InfoPath A Microsoft Office suite application to design rich XML-based forms

Microsoft InfoPath is a software application for designing, distributing, filling and submitting electronic forms containing structured data. Microsoft initially released InfoPath as part of Microsoft Office 2003 family. The product features a WYSIWYG form designer in which the various controls are bound to data, represented separately as a hierarchical tree view of folders and data fields.

Database administration is the function of managing and maintaining database management systems (DBMS) software. Mainstream DBMS software such as Oracle, IBM DB2 and Microsoft SQL Server need ongoing management. As such, corporations that use DBMS software often hire specialized information technology personnel called database administrators or DBAs.

Microsoft Office PerformancePoint Server is a business intelligence software product released in 2007 by Microsoft. The product was generally an integration of the acquisitions from ProClarity - the Planning Server and Monitoring Server - into Microsoft's SharePoint server product line. Although discontinued in 2009, the dashboard, scorecard, and analytics capabilities of PerformancePoint Server were incorporated into SharePoint 2010 and later versions.

Excel Services is a server technology included in SharePoint 2010 and SharePoint 2007. This shared service enables users to load, calculate, and display Excel 2010 workbooks on Microsoft Office SharePoint Server 2010.

Open Wonderland is a Java open-source toolkit for creating collaborative 3D virtual worlds. Within those worlds, users can communicate with high-fidelity, immersive audio, share live desktop applications and documents and conduct real business. Open Wonderland is completely extensible; developers and graphic artists can extend its functionality to create entirely new worlds and add new features to existing worlds.

SharePoint Web application platform¹

SharePoint is a web-based collaborative platform that integrates with Microsoft Office. Launched in 2001, SharePoint is primarily sold as a document management and storage system, but the product is highly configurable and usage varies substantially among organizations.

Epesi

Epesi is an open source, PHP/Ajax framework for rapid development of web based, database driven applications. The framework includes the Epesi CRM multiuser application. It requires PHP 5.x and MySQL or PostgreSQL database server on the server side and can be accessed using any modern browser. Epesi framework and Epesi CRM application are released under MIT license.

Mobile Business Intelligence is defined as “Mobile BI is a system comprising both technical and organizational elements that present historical and/or real-time information to its users for analysis on mobile devices such as smartphones and tablets, to enable effective decision-making and management support, for the overall purpose of increasing firm performance.”. Business intelligence (BI) refers to computer-based techniques used in spotting, digging-out, and analyzing business data, such as sales revenue by products and/or departments or associated costs and incomes.

AvePoint is an independent software vendor and manufacturer, headquartered in Jersey City, New Jersey and founded in 2001. AvePoint develops, sells, and supports governance, compliance, and management software for enterprise collaboration systems.

References

  1. "Dashboard | Define Dashboard at Dictionary.com". Dictionary.reference.com. Retrieved 2012-01-19.
  2. "3 Questions to Design Your KPI Reports".
  3. "Site Design for SharePoint - Set Up A Dashboard for A Rich User Experience". Sharepoint.microsoft.com. Retrieved 2012-01-19.
  4. "SharePoint Dashboard Data Sources". Dmcinfo.com. Retrieved 2012-01-19.
  5. 1 2 Barr, Stacey. "5 Steps For a Fast Performance Dashboard". KPI Library.
  6. 1 2 Thean, Patrick (2006). Execute Without Drama. Gazelles Publishing. ISBN   978-1-58776-854-5.