Additive synthesis is a sound synthesis technique that creates timbre by adding sine waves together.

In physics and mathematics, the phase of a wave or other periodic function of some real variable is an angle-like quantity representing the fraction of the cycle covered up to . It is expressed in such a scale that it varies by one full turn as the variable goes through each period. It may be measured in any angular unit such as degrees or radians, thus increasing by 360° or as the variable completes a full period.
Phase modulation (PM) is a modulation pattern for conditioning communication signals for transmission. It encodes a message signal as variations in the instantaneous phase of a carrier wave. Phase modulation is one of the two principal forms of angle modulation, together with frequency modulation.
In mechanics and physics, simple harmonic motion is a special type of periodic motion an object experiences due to a restoring force whose magnitude is directly proportional to the distance of the object from an equilibrium position and acts towards the equilibrium position. It results in an oscillation that is described by a sinusoid which continues indefinitely.
In engineering, a transfer function of a system, sub-system, or component is a mathematical function that models the system's output for each possible input. They are widely used in electronic engineering tools like circuit simulators and control systems. In some simple cases, this function can be represented as two-dimensional graph of an independent scalar input versus the dependent scalar output, called a transfer curve or characteristic curve. Transfer functions for components are used to design and analyze systems assembled from components, particularly using the block diagram technique, in electronics and control theory.
In electrodynamics, elliptical polarization is the polarization of electromagnetic radiation such that the tip of the electric field vector describes an ellipse in any fixed plane intersecting, and normal to, the direction of propagation. An elliptically polarized wave may be resolved into two linearly polarized waves in phase quadrature, with their polarization planes at right angles to each other. Since the electric field can rotate clockwise or counterclockwise as it propagates, elliptically polarized waves exhibit chirality.
In signal processing, group delay and phase delay are two related ways of describing how a signal's frequency components are delayed in time when passing through a linear time-invariant (LTI) system. Phase delay describes the time shift of a sinusoidal component. Group delay describes the time shift of the envelope of a wave packet, a "pack" or "group" of oscillations centered around one frequency that travel together, formed for instance by multiplying a sine wave by an envelope.

In electrical engineering, impedance is the opposition to alternating current presented by the combined effect of resistance and reactance in a circuit.

In physics, a transverse wave is a wave that oscillates perpendicularly to the direction of the wave's advance. In contrast, a longitudinal wave travels in the direction of its oscillations.
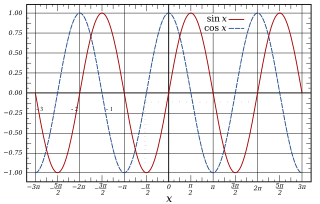
A sine wave, sinusoidal wave, or sinusoid is a mathematical curve defined in terms of the sine trigonometric function, of which it is the graph. It is a type of continuous wave and also a smooth periodic function. It occurs often in mathematics, as well as in physics, engineering, signal processing and many other fields.
In mathematics and signal processing, an analytic signal is a complex-valued function that has no negative frequency components. The real and imaginary parts of an analytic signal are real-valued functions related to each other by the Hilbert transform.

In physics and engineering, a phasor is a complex number representing a sinusoidal function whose amplitude, angular frequency, and initial phase are time-invariant. It is related to a more general concept called analytic representation, which decomposes a sinusoid into the product of a complex constant and a factor depending on time and frequency. The complex constant, which depends on amplitude and phase, is known as a phasor, or complex amplitude, and sinor or even complexor.
The electromagnetic wave equation is a second-order partial differential equation that describes the propagation of electromagnetic waves through a medium or in a vacuum. It is a three-dimensional form of the wave equation. The homogeneous form of the equation, written in terms of either the electric field E or the magnetic field B, takes the form:

The Duffing equation, named after Georg Duffing (1861–1944), is a non-linear second-order differential equation used to model certain damped and driven oscillators. The equation is given by

A sinusoid with modulation can be decomposed into, or synthesized from, two amplitude-modulated sinusoids that are offset in phase by one-quarter cycle. All three sinusoids have the same center frequency. The two amplitude-modulated sinusoids are known as the in-phase (I) and quadrature (Q) components, which describes their relationships with the amplitude- and phase-modulated carrier.
In electronic music, waveshaping is a type of distortion synthesis in which complex spectra are produced from simple tones by altering the shape of the waveforms.
Multiphoton intrapulse interference phase scan (MIIPS) is a method used in ultrashort laser technology that simultaneously measures, and compensates femtosecond laser pulses using an adaptive pulse shaper. When an ultrashort laser pulse reaches a duration of less than a few hundred femtosecond, it becomes critical to characterize its duration, its temporal intensity curve, or its electric field as a function of time. Classical photodetectors measuring the intensity of light are still too slow to allow for a direct measurement, even with the fastest photodiodes or streak cameras.
In statistical signal processing, the goal of spectral density estimation (SDE) or simply spectral estimation is to estimate the spectral density of a signal from a sequence of time samples of the signal. Intuitively speaking, the spectral density characterizes the frequency content of the signal. One purpose of estimating the spectral density is to detect any periodicities in the data, by observing peaks at the frequencies corresponding to these periodicities.

Least-squares spectral analysis (LSSA) is a method of estimating a frequency spectrum based on a least-squares fit of sinusoids to data samples, similar to Fourier analysis. Fourier analysis, the most used spectral method in science, generally boosts long-periodic noise in the long and gapped records; LSSA mitigates such problems. Unlike in Fourier analysis, data need not be equally spaced to use LSSA.
The spectrum of a chirp pulse describes its characteristics in terms of its frequency components. This frequency-domain representation is an alternative to the more familiar time-domain waveform, and the two versions are mathematically related by the Fourier transform.
The spectrum is of particular interest when pulses are subject to signal processing. For example, when a chirp pulse is compressed by its matched filter, the resulting waveform contains not only a main narrow pulse but, also, a variety of unwanted artifacts many of which are directly attributable to features in the chirp's spectral characteristics.
The simplest way to derive the spectrum of a chirp, now that computers are widely available, is to sample the time-domain waveform at a frequency well above the Nyquist limit and call up an FFT algorithm to obtain the desired result. As this approach was not an option for the early designers, they resorted to analytic analysis, where possible, or to graphical or approximation methods, otherwise. These early methods still remain helpful, however, as they give additional insight into the behavior and properties of chirps.


