
Laurence Sterne was an Anglo-Irish novelist and Anglican cleric who wrote the novels The Life and Opinions of Tristram Shandy, Gentleman and A Sentimental Journey Through France and Italy, published sermons and memoirs, and indulged in local politics. He grew up in a military family, travelling mainly in Ireland but briefly in England. An uncle paid for Sterne to attend Hipperholme Grammar School in the West Riding of Yorkshire, as Sterne's father was ordered to Jamaica, where he died of malaria some years later. He attended Jesus College, Cambridge on a sizarship, gaining bachelor's and master's degrees. While Vicar of Sutton-on-the-Forest, Yorkshire, he married Elizabeth Lumley in 1741. His ecclesiastical satire A Political Romance infuriated the church and was burnt.

Lotus 1-2-3 is a discontinued spreadsheet program from Lotus Software. It was the first killer application of the IBM PC, was hugely popular in the 1980s, and significantly contributed to the success of IBM PC-compatibles in the business market.
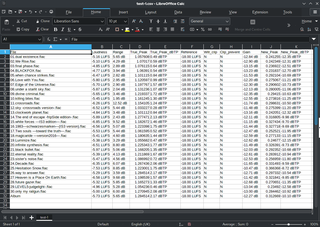
A spreadsheet is a computer application for computation, organization, analysis and storage of data in tabular form. Spreadsheets were developed as computerized analogs of paper accounting worksheets. The program operates on data entered in cells of a table. Each cell may contain either numeric or text data, or the results of formulas that automatically calculate and display a value based on the contents of other cells. The term spreadsheet may also refer to one such electronic document.

The Anatomy of Melancholy is a book by Robert Burton, first published in 1621, but republished five more times over the next seventeen years with massive alterations and expansions.
OpenType is a format for scalable computer fonts. Derived from TrueType, it retains TrueType's basic structure but adds many intricate data structures for describing typographic behavior. OpenType is a registered trademark of Microsoft Corporation.

Visual Basic (VB), originally called Visual Basic .NET (VB.NET), is a multi-paradigm, object-oriented programming language, implemented on .NET, Mono, and the .NET Framework. Microsoft launched VB.NET in 2002 as the successor to its original Visual Basic language, the last version of which was Visual Basic 6.0. Although the ".NET" portion of the name was dropped in 2005, this article uses "Visual Basic [.NET]" to refer to all Visual Basic languages released since 2002, in order to distinguish between them and the classic Visual Basic. Along with C# and F#, it is one of the three main languages targeting the .NET ecosystem. Microsoft updated its VB language strategy on 6 February 2023, stating that VB is a stable language now and Microsoft will keep maintaining it.

Edward Rolf Tufte, sometimes known as "ET", is an American statistician and professor emeritus of political science, statistics, and computer science at Yale University. He is noted for his writings on information design and as a pioneer in the field of data visualization.
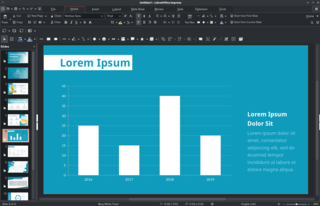
In computing, a presentation program is a software package used to display information in the form of a slide show. It has three major functions:
Vector Markup Language (VML) is an obsolete XML-based file format for two-dimensional vector graphics. It was specified in Part 4 of the Office Open XML standards ISO/IEC 29500 and ECMA-376. According to the specification, VML is a deprecated format included in Office Open XML for legacy reasons only.

Chartjunk consists of all visual elements in charts and graphs that are not necessary to comprehend the information represented on the graph, or that distract the viewer from this information.

Infographics are graphic visual representations of information, data, or knowledge intended to present information quickly and clearly. They can improve cognition by using graphics to enhance the human visual system's ability to see patterns and trends. Similar pursuits are information visualization, data visualization, statistical graphics, information design, or information architecture. Infographics have evolved in recent years to be for mass communication, and thus are designed with fewer assumptions about the readers' knowledge base than other types of visualizations. Isotypes are an early example of infographics conveying information quickly and easily to the masses.
A pivot table is a table of values which are aggregations of groups of individual values from a more extensive table within one or more discrete categories. The aggregations or summaries of the groups of the individual terms might include sums, averages, counts, or other statistics. A pivot table is the outcome of the statistical processing of tabularized raw data and can be used for decision-making.
This is an overview of software support for the OpenDocument format, an open document file format for saving and exchanging editable office documents.
Data Interchange Format (.dif) is a text file format used to import/export single spreadsheets between spreadsheet programs.
An IFilter is a plugin that allows Microsoft's search engines to index various file formats so that they become searchable. Without an appropriate IFilter, contents of a file cannot be parsed and indexed by the search engine.
Office Open XML is a zipped, XML-based file format developed by Microsoft for representing spreadsheets, charts, presentations and word processing documents. Ecma International standardized the initial version as ECMA-376. ISO and IEC standardized later versions as ISO/IEC 29500.

Data and information visualization is the practice of designing and creating easy-to-communicate and easy-to-understand graphic or visual representations of a large amount of complex quantitative and qualitative data and information with the help of static, dynamic or interactive visual items. Typically based on data and information collected from a certain domain of expertise, these visualizations are intended for a broader audience to help them visually explore and discover, quickly understand, interpret and gain important insights into otherwise difficult-to-identify structures, relationships, correlations, local and global patterns, trends, variations, constancy, clusters, outliers and unusual groupings within data. When intended for the general public to convey a concise version of known, specific information in a clear and engaging manner, it is typically called information graphics.

Quick View is a file viewer in Windows 95, Windows 98 and Windows NT 4.0 operating systems. The viewer can be used to view practically any file.

Go-oo is a discontinued free office suite which started as a set of patches for OpenOffice.org, then later became an independent fork of OpenOffice.org with a number of enhancements, sponsored by Novell.
The Office Open XML file formats are a set of file formats that can be used to represent electronic office documents. There are formats for word processing documents, spreadsheets and presentations as well as specific formats for material such as mathematical formulas, graphics, bibliographies etc.
