
Heat transfer is a discipline of thermal engineering that concerns the generation, use, conversion, and exchange of thermal energy (heat) between physical systems. Heat transfer is classified into various mechanisms, such as thermal conduction, thermal convection, thermal radiation, and transfer of energy by phase changes. Engineers also consider the transfer of mass of differing chemical species, either cold or hot, to achieve heat transfer. While these mechanisms have distinct characteristics, they often occur simultaneously in the same system.

The lapse rate is the rate at which an atmospheric variable, normally temperature in Earth's atmosphere, falls with altitude. Lapse rate arises from the word lapse, in the sense of a gradual fall. In dry air, the adiabatic lapse rate is 9.8 °C/km. The saturated adiabatic lapse rate (SALR), or moist adiabatic lapse rate (MALR), is the decrease in temperature of a parcel of water-saturated air that rises in the atmosphere. It varies with the temperature and pressure of the parcel and is often in the range 3.6 to 9.2 °C/km, as obtained from the International Civil Aviation Organization (ICAO). The environmental lapse rate is the decrease in temperature of air with altitude for a specific time and place. It can be highly variable between circumstances.
The primitive equations are a set of nonlinear partial differential equations that are used to approximate global atmospheric flow and are used in most atmospheric models. They consist of three main sets of balance equations:
- A continuity equation: Representing the conservation of mass.
- Conservation of momentum: Consisting of a form of the Navier–Stokes equations that describe hydrodynamical flow on the surface of a sphere under the assumption that vertical motion is much smaller than horizontal motion (hydrostasis) and that the fluid layer depth is small compared to the radius of the sphere
- A thermal energy equation: Relating the overall temperature of the system to heat sources and sinks
Psychrometrics is the field of engineering concerned with the physical and thermodynamic properties of gas-vapor mixtures.

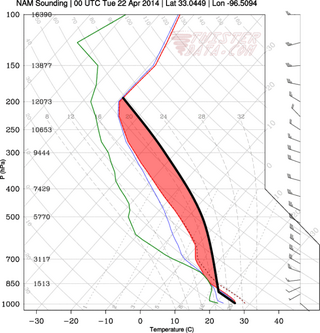
In meteorology, convective available potential energy, is the integrated amount of work that the upward (positive) buoyancy force would perform on a given mass of air if it rose vertically through the entire atmosphere. Positive CAPE will cause the air parcel to rise, while negative CAPE will cause the air parcel to sink. Nonzero CAPE is an indicator of atmospheric instability in any given atmospheric sounding, a necessary condition for the development of cumulus and cumulonimbus clouds with attendant severe weather hazards.
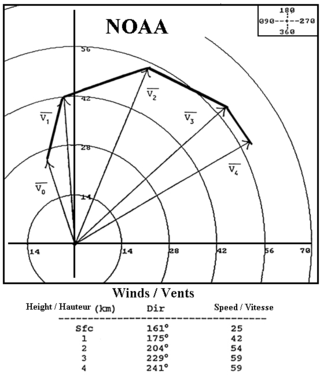
A hodograph is a diagram that gives a vectorial visual representation of the movement of a body or a fluid. It is the locus of one end of a variable vector, with the other end fixed. The position of any plotted data on such a diagram is proportional to the velocity of the moving particle. It is also called a velocity diagram. It appears to have been used by James Bradley, but its practical development is mainly from Sir William Rowan Hamilton, who published an account of it in the Proceedings of the Royal Irish Academy in 1846.
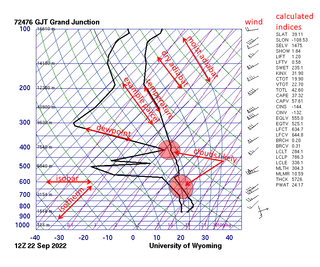
A skew-T log-P diagram is one of four thermodynamic diagrams commonly used in weather analysis and forecasting. In 1947, N. Herlofson proposed a modification to the emagram that allows straight, horizontal isobars and provides for a large angle between isotherms and dry adiabats, similar to that in the tephigram. It was thus more suitable for some of the newer analysis techniques being invented by the United States Air Force.
This is a list of meteorology topics. The terms relate to meteorology, the interdisciplinary scientific study of the atmosphere that focuses on weather processes and forecasting.

Convective inhibition is a numerical measure in meteorology that indicates the amount of energy that will prevent an air parcel from rising from the surface to the level of free convection.

An emagram is one of four thermodynamic diagrams used to display temperature lapse rate and moisture content profiles in the atmosphere. The emagram has axes of temperature (T) and pressure (p). In the emagram, the dry adiabats make an angle of about 45 degrees with the isobars, isotherms are vertical and isopleths of saturation mixing ratio are almost straight and vertical.

A Stüve diagram is one type of thermodynamic diagram commonly used in weather analysis and forecasting.

Thermodynamic diagrams are diagrams used to represent the thermodynamic states of a material and the consequences of manipulating this material. For instance, a temperature–entropy diagram may be used to demonstrate the behavior of a fluid as it is changed by a compressor.
In meteorology, convective instability or stability of an air mass refers to its ability to resist vertical motion. A stable atmosphere makes vertical movement difficult, and small vertical disturbances dampen out and disappear. In an unstable atmosphere, vertical air movements tend to become larger, resulting in turbulent airflow and convective activity. Instability can lead to significant turbulence, extensive vertical clouds, and severe weather such as thunderstorms.

The level of free convection (LFC) is the altitude in the atmosphere where an air parcel lifted adiabatically until saturation becomes warmer than the environment at the same level, so that positive buoyancy can initiate self-sustained convection.
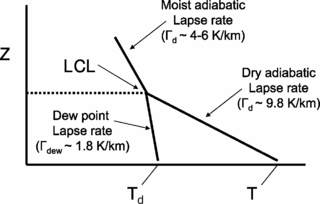
The lifted condensation level or lifting condensation level (LCL) is formally defined as the height at which the relative humidity (RH) of an air parcel will reach 100% with respect to liquid water when it is cooled by dry adiabatic lifting. The RH of air increases when it is cooled, since the amount of water vapor in the air remains constant, while the saturation vapor pressure decreases almost exponentially with decreasing temperature. If the air parcel is lifting further beyond the LCL, water vapor in the air parcel will begin condensing, forming cloud droplets. The LCL is a good approximation of the height of the cloud base which will be observed on days when air is lifted mechanically from the surface to the cloud base.
Atmospheric thermodynamics is the study of heat-to-work transformations that take place in the Earth's atmosphere and manifest as weather or climate. Atmospheric thermodynamics use the laws of classical thermodynamics, to describe and explain such phenomena as the properties of moist air, the formation of clouds, atmospheric convection, boundary layer meteorology, and vertical instabilities in the atmosphere. Atmospheric thermodynamic diagrams are used as tools in the forecasting of storm development. Atmospheric thermodynamics forms a basis for cloud microphysics and convection parameterizations used in numerical weather models and is used in many climate considerations, including convective-equilibrium climate models.
In atmospheric thermodynamics, the virtual temperature of a moist air parcel is the temperature at which a theoretical dry air parcel would have a total pressure and density equal to the moist parcel of air. The virtual temperature of unsaturated moist air is always greater than the absolute air temperature, however, as the existence of suspended cloud droplets reduces the virtual temperature.

The lifted index (LI) is the temperature difference between the environment Te(p) and an air parcel lifted adiabatically Tp(p) at a given pressure height in the troposphere of the atmosphere, usually 500 hPa (mb). The temperature is measured in Celsius. When the value is positive, the atmosphere is stable and when the value is negative, the atmosphere is unstable.

Atmospheric convection is the result of a parcel-environment instability in the atmosphere. Different lapse rates within dry and moist air masses lead to instability. Mixing of air during the day expands the height of the planetary boundary layer, leading to increased winds, cumulus cloud development, and decreased surface dew points. Convection involving moist air masses leads to thunderstorm development, which is often responsible for severe weather throughout the world. Special threats from thunderstorms include hail, downbursts, and tornadoes.

This glossary of meteorology is a list of terms and concepts relevant to meteorology and atmospheric science, their sub-disciplines, and related fields.


