
Project Stormfury was an attempt to weaken tropical cyclones by flying aircraft into them and seeding them with silver iodide. The project was run by the United States Government from 1962 to 1983. The hypothesis was that the silver iodide would cause supercooled water in the storm to freeze, disrupting the inner structure of the hurricane, and this led to seeding several Atlantic hurricanes. However, it was later shown that this hypothesis was incorrect. It was determined that most hurricanes do not contain enough supercooled water for cloud seeding to be effective. Additionally, researchers found that unseeded hurricanes often undergo the same structural changes that were expected from seeded hurricanes. This finding called Stormfury's successes into question, as the changes reported now had a natural explanation.

The Lockheed WC-130 is a high-wing, medium-range aircraft used for weather reconnaissance missions by the United States Air Force. The aircraft is a modified version of the C-130 Hercules transport configured with specialized weather instrumentation including a dropsonde deployment/receiver system and crewed by a meteorologist for penetration of tropical cyclones and winter storms to obtain data on movement, size and intensity.

Hurricane hunters, typhoon hunters, or cyclone hunters are aircrews that fly into tropical cyclones to gather weather data. In the United States, the organizations that fly these missions are the United States Air Force Reserve's 53rd Weather Reconnaissance Squadron and the National Oceanic and Atmospheric Administration's Hurricane Hunters. Such missions have also been flown by Navy units and other Air Force and NOAA units. Other organizations also fly these missions, such as Government Flying Service Hong Kong.

The 53rd Weather Reconnaissance Squadron, also known by its nickname, Hurricane Hunters, is a flying unit of the United States Air Force, and "the only Department of Defense organization still flying into tropical storms and hurricanes." Aligned under the 403rd Wing of the Air Force Reserve Command (AFRC) and based at Keesler Air Force Base, Mississippi, with ten aircraft, it flies into tropical cyclones in the Atlantic Ocean, the Caribbean Sea, the Gulf of Mexico and the Central Pacific Ocean for the specific purpose of directly measuring weather data in and around those storms. The 53rd WRS currently operates the Lockheed WC-130J aircraft as its weather data collection platform.

A dropsonde is an expendable weather reconnaissance device created by the National Center for Atmospheric Research (NCAR), designed to be dropped from an aircraft at altitude over water to measure storm conditions as the device falls to the surface. The sonde contains a GPS receiver, along with pressure, temperature, and humidity (PTH) sensors to capture atmospheric profiles and thermodynamic data. It typically relays this data to a computer in the aircraft by radio transmission.
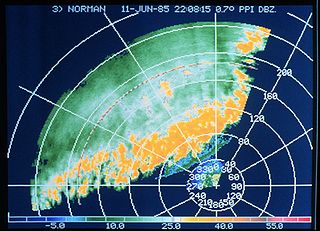
A rainband is a cloud and precipitation structure associated with an area of rainfall which is significantly elongated. Rainbands in tropical cyclones can be either stratiform or convective and are curved in shape. They consist of showers and thunderstorms, and along with the eyewall and the eye, they make up a tropical cyclone. The extent of rainbands around a tropical cyclone can help determine the cyclone's intensity.

An annular tropical cyclone is a tropical cyclone that features a normal to large, symmetric eye surrounded by a thick and uniform ring of intense convection, often having a relative lack of discrete rainbands, and bearing a symmetric appearance in general. As a result, the appearance of an annular tropical cyclone can be referred to as akin to a tire or doughnut. Annular characteristics can be attained as tropical cyclones intensify; however, outside the processes that drive the transition from asymmetric systems to annular systems and the abnormal resistance to negative environmental factors found in storms with annular features, annular tropical cyclones behave similarly to asymmetric storms. Most research related to annular tropical cyclones is limited to satellite imagery and aircraft reconnaissance as the conditions thought to give rise to annular characteristics normally occur over open water, well removed from landmasses where surface observations are possible.

Hurricane Ophelia was a long-lived tropical cyclone in September 2005 that moved along an erratic path off the East Coast of the United States for much of its existence. The fifteenth named storm and the eighth hurricane of the record-breaking 2005 Atlantic hurricane season, Ophelia originated from a complex set of systems across the Atlantic in early September. An area of low pressure consolidated near the Bahamas and was classified as Tropical Depression Sixteen on September 6. Stuck in a region of meager steering currents, largely dominated by a lull between two ridges to the north and east, this system moved along a looping course with a general northward trajectory. The following day it organized into Tropical Storm Ophelia and soon reached hurricane status on September 8. Over the next week, Ophelia's intensity oscillated between tropical storm and hurricane levels due to intrusions of dry air, varying levels of wind shear, and gradual upwelling of cooler waters along its meandering path. Gradually growing in size, the system reached hurricane strength for the fourth time and its peak strength on September 14, with maximum sustained winds of 85 mph (140 km/h). By this time Ophelia had completed a second loop and was moving northwest toward North Carolina. Changing direction once again, the system turned away from the state though its eyewall scraped the coastline for two days. The system degraded to tropical storm strength for a final time on September 16 as it began accelerating northeast. Becoming embedded within the westerlies, Ophelia transitioned into an extratropical cyclone the next day. Remaining on a steady east-northeast to northeast path for the next week, Ophelia traversed Atlantic Canada and the northern Atlantic Ocean before dissipating on September 23 over the Norwegian Sea.

The eye is a region of mostly calm weather at the center of a tropical cyclone. The eye of a storm is a roughly circular area, typically 30–65 kilometers in diameter. It is surrounded by the eyewall, a ring of towering thunderstorms where the most severe weather and highest winds of the cyclone occur. The cyclone's lowest barometric pressure occurs in the eye and can be as much as 15 percent lower than the pressure outside the storm.

James Louis Franklin is a former weather forecaster encompassing a 35-year career with National Oceanic and Atmospheric Administration (NOAA). He served as the first branch chief of the newly formed Hurricane Specialist Unit (HSU) before his retirement in 2017.

The central dense overcast, or CDO, of a tropical cyclone or strong subtropical cyclone is the large central area of thunderstorms surrounding its circulation center, caused by the formation of its eyewall. It can be round, angular, oval, or irregular in shape. This feature shows up in tropical cyclones of tropical storm or hurricane strength. How far the center is embedded within the CDO, and the temperature difference between the cloud tops within the CDO and the cyclone's eye, can help determine a tropical cyclone's intensity with the Dvorak technique. Locating the center within the CDO can be a problem with strong tropical storms and minimal hurricanes as its location can be obscured by the CDO's high cloud canopy. This center location problem can be resolved through the use of microwave satellite imagery.

Tropical cyclone observation has been carried out over the past couple of centuries in various ways. The passage of typhoons, hurricanes, as well as other tropical cyclones have been detected by word of mouth from sailors recently coming to port or by radio transmissions from ships at sea, from sediment deposits in near shore estuaries, to the wiping out of cities near the coastline. Since World War II, advances in technology have included using planes to survey the ocean basins, satellites to monitor the world's oceans from outer space using a variety of methods, radars to monitor their progress near the coastline, and recently the introduction of unmanned aerial vehicles to penetrate storms. Recent studies have concentrated on studying hurricane impacts lying within rocks or near shore lake sediments, which are branches of a new field known as paleotempestology. This article details the various methods employed in the creation of the hurricane database, as well as reconstructions necessary for reanalysis of past storms used in projects such as the Atlantic hurricane reanalysis.

Hurricane Wilma was the most intense tropical cyclone in the Atlantic basin on record in terms of minimum barometric pressure, with an atmospheric pressure of 882 millibars (26.0 inHg). Wilma's destructive journey began in the second week of October 2005. A large area of disturbed weather developed across much of the Caribbean and gradually organized to the southeast of Jamaica. By late on October 15, the system was sufficiently organized for the National Hurricane Center to designate it as Tropical Depression Twenty-Four.
The Hurricane Research Division (HRD) is a section of the Atlantic Oceanographic and Meteorological Laboratory (AOML) in Miami, Florida, and is the U.S. National Oceanic and Atmospheric Administration's (NOAA) focus for tropical cyclone research. The thirty member division is not a part of the National Hurricane Center but cooperates closely with them in carrying out its annual field program and in transitioning research results into operational tools for hurricane forecasters. HRD was formed from the National Hurricane Research Laboratory in 1984, when it was transferred to AOML and unified with the oceanographic laboratories.

The meteorological history of Hurricane Ivan, the longest tracked tropical cyclone of the 2004 Atlantic hurricane season, lasted from late August through late September. The hurricane developed from a tropical wave that moved off the coast of Africa on August 31. Tracking westward due to a ridge, favorable conditions allowed it to develop into Tropical Depression Nine on September 2 in the deep tropical Atlantic Ocean. The cyclone gradually intensified until September 5, when it underwent rapid deepening and reached Category 4 status on the Saffir-Simpson Hurricane Scale; at the time Ivan was the southernmost major North Atlantic hurricane on record.
The maximum sustained wind associated with a tropical cyclone is a common indicator of the intensity of the storm. Within a mature tropical cyclone, it is found within the eyewall at a distance defined as the radius of maximum wind, or RMW. Unlike gusts, the value of these winds are determined via their sampling and averaging the sampled results over a period of time. Wind measuring has been standardized globally to reflect the winds at 10 metres (33 ft) above mean sea level, and the maximum sustained wind represents the highest average wind over either a one-minute (US) or ten-minute time span, anywhere within the tropical cyclone. Surface winds are highly variable due to friction between the atmosphere and the Earth's surface, as well as near hills and mountains over land.

In meteorology, eyewall replacement cycles, also called concentric eyewall cycles, naturally occur in intense tropical cyclones with maximum sustained winds greater than 33 m/s, or hurricane-force, and particularly in major hurricanes of Saffir–Simpson category 3 to 5. In such storms, some of the outer rainbands may strengthen and organize into a ring of thunderstorms—a new, outer eyewall—that slowly moves inward and robs the original, inner eyewall of its needed moisture and angular momentum. Since the strongest winds are in a tropical cyclone's eyewall, the storm usually weakens during this phase, as the inner wall is "choked" by the outer wall. Eventually the outer eyewall replaces the inner one completely, and the storm may re-intensify.

The meteorological history of Hurricane Florence spanned 22 days from its inception on August 28, 2018, to its dissipation on September 18. Originating from a tropical wave over West Africa, Florence quickly organized upon its emergence over the Atlantic Ocean. Favorable atmospheric conditions enabled it to develop into a tropical depression on August 31 just south of the Cape Verde islands. Intensifying to a tropical storm the following day, Florence embarked on a west-northwest to northwest trajectory over open ocean. Initially being inhibited by increased wind shear and dry air, the small cyclone took advantage of a small area of low shear and warm waters. After achieving hurricane strength early on September 4, Florence underwent an unexpected period of rapid deepening through September 5, culminating with it becoming a Category 4 hurricane on the Saffir-Simpson scale. Thereafter, conditions again became unfavorable and the hurricane quickly diminished to a tropical storm on September 7.

Hurricane Katrina was a devastating tropical cyclone that had a long and complex meteorological history, spanning a month from August 8 to September 7, 2005. Katrina's origins can be traced to the mid-level remnants of Tropical Depression Ten, a tropical wave, and an upper tropospheric trough. The tropical depression emerged as a wave off West Africa on August 8, the second wave followed on August 11, while the trough factored into tropical cyclogenesis between August 17 and 23. The mid-level remnants of Tropical Depression Ten merged with the second tropical wave on August 19 while located north of Hispaniola. Subsequent interaction with the trough spurred convective development, resulting in the formation of Tropical Depression Twelve over the Bahamas on August 23. Deep convection soon blossomed and following the development of rainbands the system intensified into a tropical storm. As it strengthened into a hurricane, Katrina made its first landfall in the Miami metropolitan area on August 25.


