
Global warming potential (GWP) is an index to measure of how much infrared thermal radiation a greenhouse gas would absorb over a given time frame after it has been added to the atmosphere. The GWP makes different greenhouse gases comparable with regards to their "effectiveness in causing radiative forcing". It is expressed as a multiple of the radiation that would be absorbed by the same mass of added carbon dioxide, which is taken as a reference gas. Therefore, the GWP is one for CO2. For other gases it depends on how strongly the gas absorbs infrared thermal radiation, how quickly the gas leaves the atmosphere, and the time frame being considered.

Evapotranspiration (ET) is the combined processes which move water from the Earth's surface into the atmosphere. It covers both water evaporation and transpiration. Evapotranspiration is an important part of the local water cycle and climate, and measurement of it plays a key role in agricultural irrigation and water resource management.
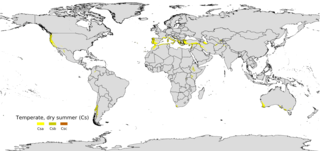
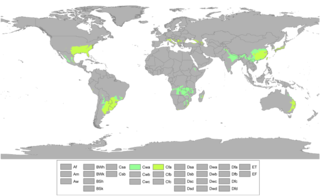
A Mediterranean climate, also called a dry summer climate, described by Köppen as Cs, is a temperate climate type that occurs in the lower mid-latitudes. Such climates typically have dry summers and wet winters, with summer conditions ranging from warm to hot and winter conditions typically being mild to cool. These weather conditions are typically experienced in the majority of Mediterranean-climate regions and countries, but remain highly dependent on proximity to the ocean, altitude and geographical location.

The Köppen climate classification is one of the most widely used climate classification systems. It was first published by German-Russian climatologist Wladimir Köppen (1846–1940) in 1884, with several later modifications by Köppen, notably in 1918 and 1936. Later, German climatologist Rudolf Geiger (1894–1981) introduced some changes to the classification system in 1954 and 1961, which is thus sometimes called the Köppen–Geiger climate classification.
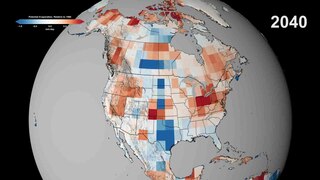
Potential evaporation (PE) or potential evapotranspiration (PET) is defined as the amount of evaporation that would occur if a sufficient water source were available. If the actual evapotranspiration is considered the net result of atmospheric demand for moisture from a surface and the ability of the surface to supply moisture, then PET is a measure of the demand side. Surface and air temperatures, insolation, and wind all affect this. A dryland is a place where annual potential evaporation exceeds annual precipitation.

A semi-arid climate, semi-desert climate, or steppe climate is a dry climate sub-type. It is located on regions that receive precipitation below potential evapotranspiration, but not as low as a desert climate. There are different kinds of semi-arid climates, depending on variables such as temperature, and they give rise to different biomes.

Viedma is the capital and fourth largest city of the Río Negro Province, in northern Patagonia, Argentina. The city has approximately 62,000 inhabitants (2022), and is located on the southern margin of the Negro River, about 30 kilometres off the Atlantic Coast, and 960 km from the city of Buenos Aires on the National Route 3.
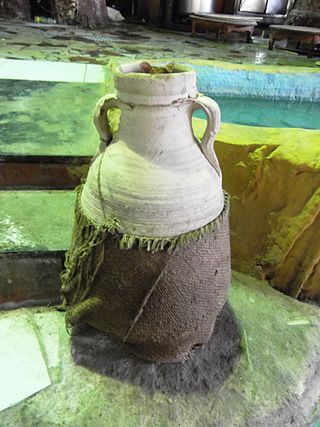
An evaporative cooler is a device that cools air through the evaporation of water. Evaporative cooling differs from other air conditioning systems, which use vapor-compression or absorption refrigeration cycles. Evaporative cooling exploits the fact that water will absorb a relatively large amount of heat in order to evaporate. The temperature of dry air can be dropped significantly through the phase transition of liquid water to water vapor (evaporation). This can cool air using much less energy than refrigeration. In extremely dry climates, evaporative cooling of air has the added benefit of conditioning the air with more moisture for the comfort of building occupants.
The Penman equation describes evaporation (E) from an open water surface, and was developed by Howard Penman in 1948. Penman's equation requires daily mean temperature, wind speed, air pressure, and solar radiation to predict E. Simpler Hydrometeorological equations continue to be used where obtaining such data is impractical, to give comparable results within specific contexts, e.g. humid vs arid climates.

A humid continental climate is a climatic region defined by Russo-German climatologist Wladimir Köppen in 1900, typified by four distinct seasons and large seasonal temperature differences, with warm to hot summers, and cold and snowy winters. Precipitation is usually distributed throughout the year, but often these regions do have dry seasons. The definition of this climate in terms of temperature is as follows: the mean temperature of the coldest month must be below 0 °C (32.0 °F) or −3 °C (26.6 °F) depending on the isotherm, and there must be at least four months whose mean temperatures are at or above 10 °C (50 °F). In addition, the location in question must not be semi-arid or arid. The cooler Dfb, Dwb, and Dsb subtypes are also known as hemiboreal climates. Although amount of snowfall is not a factor used in defining the humid continental climate, snow during the winter in this type of climate is almost a guarantee, either intermittently throughout the winter months near the poleward or coastal margins, or persistently throughout the winter months elsewhere in the climate zone.

Heating degree day (HDD) is a measurement designed to quantify the demand for energy needed to heat a building. HDD is derived from measurements of outside air temperature. The heating requirements for a given building at a specific location are considered to be directly proportional to the number of HDD at that location.

The Argentine Northwest is a geographic and historical region of Argentina composed of the provinces of Catamarca, Jujuy, La Rioja, Salta, Santiago del Estero and Tucumán.
An aridity index (AI) is a numerical indicator of the degree of dryness of the climate at a given location. The American Meteorological Society defined it in meteorology and climatology, as "the degree to which a climate lacks effective, life-promoting moisture". Aridity is different from drought because aridity is permanent whereas drought is temporary. A number of aridity indices have been proposed ; these indicators serve to identify, locate or delimit regions that suffer from a deficit of available water, a condition that can severely affect the effective use of the land for such activities as agriculture or stock-farming.

Climate classifications are systems that categorize the world's climates. A climate classification may correlate closely with a biome classification, as climate is a major influence on life in a region. One of the most used is the Köppen climate classification scheme first developed in 1884.
Moisture advection is the horizontal transport of water vapor by the wind. Measurement and knowledge of atmospheric water vapor, or "moisture", is crucial in the prediction of all weather elements, especially clouds, fog, temperature, humidity thermal comfort indices and precipitation. Regions of moisture advection are often co-located with regions of warm advection.

The Holdridge life zones system is a global bioclimatic scheme for the classification of land areas. It was first published by Leslie Holdridge in 1947, and updated in 1967. It is a relatively simple system based on few empirical data, giving objective criteria. A basic assumption of the system is that both soil and the climax vegetation can be mapped once the climate is known.

Tropical savanna climate or tropical wet and dry climate is a tropical climate sub-type that corresponds to the Köppen climate classification categories Aw and As. The driest month has less than 60 mm (2.4 in) of precipitation and also less than mm of precipitation.
Charles Warren Thornthwaite was an American geographer and climatologist. He is best known for devising the Thornthwaite climate classification, a climate classification system modified in 1948 that is still in use worldwide, and also for his detailed water budget computations of potential evapotranspiration.
A humid subtropical climate is a temperate climate type characterized by hot and humid summers, and cool to mild winters. These climates normally lie on the southeast side of all continents, generally between latitudes 25° and 40° and are located poleward from adjacent tropical climates. It is also known as warm temperate climate in some climate classifications.

The Trewartha climate classification (TCC) or the Köppen–Trewartha climate classification (KTC) is a climate classification system first published by American geographer Glenn Thomas Trewartha in 1966. It is a modified version of the Köppen–Geiger system, created to answer some of its deficiencies. The Trewartha system attempts to redefine the middle latitudes to be closer to vegetation zoning and genetic climate systems.


