See also
This article includes a list of references, related reading, or external links, but its sources remain unclear because it lacks inline citations .(November 2011) |
Welch's method, named after Peter D. Welch, is an approach for spectral density estimation. It is used in physics, engineering, and applied mathematics for estimating the power of a signal at different frequencies. The method is based on the concept of using periodogram spectrum estimates, which are the result of converting a signal from the time domain to the frequency domain. Welch's method is an improvement on the standard periodogram spectrum estimating method and on Bartlett's method, in that it reduces noise in the estimated power spectra in exchange for reducing the frequency resolution. Due to the noise caused by imperfect and finite data, the noise reduction from Welch's method is often desired.
The Welch method is based on Bartlett's method and differs in two ways:
After doing the above, the periodogram is calculated by computing the discrete Fourier transform, and then computing the squared magnitude of the result, yielding power spectrum estimates for each segment. The individual spectrum estimates are then averaged, which reduces the variance of the individual power measurements. The end result is an array of power measurements vs. frequency "bin".
Other overlapping windowed Fourier transforms include:
This article includes a list of references, related reading, or external links, but its sources remain unclear because it lacks inline citations .(November 2011) |
Digital signal processing (DSP) is the use of digital processing, such as by computers or more specialized digital signal processors, to perform a wide variety of signal processing operations. The digital signals processed in this manner are a sequence of numbers that represent samples of a continuous variable in a domain such as time, space, or frequency. In digital electronics, a digital signal is represented as a pulse train, which is typically generated by the switching of a transistor.
Fourier-transform spectroscopy is a measurement technique whereby spectra are collected based on measurements of the coherence of a radiative source, using time-domain or space-domain measurements of the radiation, electromagnetic or not. It can be applied to a variety of types of spectroscopy including optical spectroscopy, infrared spectroscopy, nuclear magnetic resonance (NMR) and magnetic resonance spectroscopic imaging (MRSI), mass spectrometry and electron spin resonance spectroscopy.

The power spectrum of a time series describes the distribution of power into frequency components composing that signal. According to Fourier analysis, any physical signal can be decomposed into a number of discrete frequencies, or a spectrum of frequencies over a continuous range. The statistical average of any sort of signal as analyzed in terms of its frequency content, is called its spectrum.
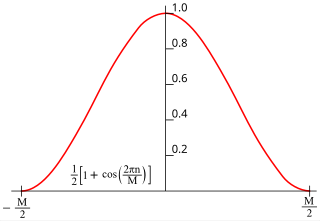
In signal processing and statistics, a window function is a mathematical function that is zero-valued outside of some chosen interval. Typically, windows functions are symmetric around the middle of the interval, approach a maximum in the middle, and taper away from the middle. Mathematically, when another function or waveform/data-sequence is "multiplied" by a window function, the product is also zero-valued outside the interval: all that is left is the part where they overlap, the "view through the window". Equivalently, and in actual practice, the segment of data within the window is first isolated, and then only that data is multiplied by the window function values. Thus, tapering, not segmentation, is the main purpose of window functions.

A spectrum analyzer measures the magnitude of an input signal versus frequency within the full frequency range of the instrument. The primary use is to measure the power of the spectrum of known and unknown signals. The input signal that most common spectrum analyzers measure is electrical; however, spectral compositions of other signals, such as acoustic pressure waves and optical light waves, can be considered through the use of an appropriate transducer. Spectrum analyzers for other types of signals also exist, such as optical spectrum analyzers which use direct optical techniques such as a monochromator to make measurements.
In signal processing, a periodogram is an estimate of the spectral density of a signal. The term was coined by Arthur Schuster in 1898. Today, the periodogram is a component of more sophisticated methods. It is the most common tool for examining the amplitude vs frequency characteristics of FIR filters and window functions. FFT spectrum analyzers are also implemented as a time-sequence of periodograms.
The Fourier transform of a function of time, s(t), is a complex-valued function of frequency, S(f), often referred to as a frequency spectrum. Any linear time-invariant operation on s(t) produces a new spectrum of the form H(f)•S(f), which changes the relative magnitudes and/or angles (phase) of the non-zero values of S(f). Any other type of operation creates new frequency components that may be referred to as spectral leakage in the broadest sense. Sampling, for instance, produces leakage, which we call aliases of the original spectral component. For Fourier transform purposes, sampling is modeled as a product between s(t) and a Dirac comb function. The spectrum of a product is the convolution between S(f) and another function, which inevitably creates the new frequency components. But the term 'leakage' usually refers to the effect of windowing, which is the product of s(t) with a different kind of function, the window function. Window functions happen to have finite duration, but that is not necessary to create leakage. Multiplication by a time-variant function is sufficient.
In mathematics, the discrete-time Fourier transform (DTFT) is a form of Fourier analysis that is applicable to a sequence of discrete values.
A pitch detection algorithm (PDA) is an algorithm designed to estimate the pitch or fundamental frequency of a quasiperiodic or oscillating signal, usually a digital recording of speech or a musical note or tone. This can be done in the time domain, the frequency domain, or both.
Geophysical survey is the systematic collection of geophysical data for spatial studies. Detection and analysis of the geophysical signals forms the core of Geophysical signal processing. The magnetic and gravitational fields emanating from the Earth's interior hold essential information concerning seismic activities and the internal structure. Hence, detection and analysis of the electric and Magnetic fields is very crucial. As the Electromagnetic and gravitational waves are multi-dimensional signals, all the 1-D transformation techniques can be extended for the analysis of these signals as well. Hence this article also discusses multi-dimensional signal processing techniques.

In signal processing, multitaper is a spectral density estimation technique developed by David J. Thomson. It can estimate the power spectrum SX of a stationary ergodic finite-variance random process X, given a finite contiguous realization of X as data.
The method of reassignment is a technique for sharpening a time-frequency representation by mapping the data to time-frequency coordinates that are nearer to the true region of support of the analyzed signal. The method has been independently introduced by several parties under various names, including method of reassignment, remapping, time-frequency reassignment, and modified moving-window method. In the case of the spectrogram or the short-time Fourier transform, the method of reassignment sharpens blurry time-frequency data by relocating the data according to local estimates of instantaneous frequency and group delay. This mapping to reassigned time-frequency coordinates is very precise for signals that are separable in time and frequency with respect to the analysis window.
Maximum entropy spectral estimation is a method of spectral density estimation. The goal is to improve the spectral quality based on the principle of maximum entropy. The method is based on choosing the spectrum which corresponds to the most random or the most unpredictable time series whose autocorrelation function agrees with the known values. This assumption, which corresponds to the concept of maximum entropy as used in both statistical mechanics and information theory, is maximally non-committal with regard to the unknown values of the autocorrelation function of the time series. It is simply the application of maximum entropy modeling to any type of spectrum and is used in all fields where data is presented in spectral form. The usefulness of the technique varies based on the source of the spectral data since it is dependent on the amount of assumed knowledge about the spectrum that can be applied to the model.
In statistical signal processing, the goal of spectral density estimation (SDE) or simply spectral estimation is to estimate the spectral density of a signal from a sequence of time samples of the signal. Intuitively speaking, the spectral density characterizes the frequency content of the signal. One purpose of estimating the spectral density is to detect any periodicities in the data, by observing peaks at the frequencies corresponding to these periodicities.

Least-squares spectral analysis (LSSA) is a method of estimating a frequency spectrum based on a least-squares fit of sinusoids to data samples, similar to Fourier analysis. Fourier analysis, the most used spectral method in science, generally boosts long-periodic noise in the long and gapped records; LSSA mitigates such problems. Unlike in Fourier analysis, data need not be equally spaced to use LSSA.
In time series analysis, Bartlett's method, is used for estimating power spectra. It provides a way to reduce the variance of the periodogram in exchange for a reduction of resolution, compared to standard periodograms. A final estimate of the spectrum at a given frequency is obtained by averaging the estimates from the periodograms derived from non-overlapping portions of the original series.
The Blackman–Tukey transformation is a digital signal processing method to transform data from the time domain to the frequency domain. It was originally programmed around 1953 by James Cooley for John Tukey at John von Neumann's Institute for Advanced Study as a way to get "good smoothed statistical estimates of power spectra without requiring large Fourier transforms." It was published by Ralph Beebe Blackman and John Tukey in 1958.
Multidimension spectral estimation is a generalization of spectral estimation, normally formulated for one-dimensional signals, to multidimensional signals or multivariate data, such as wave vectors.
In statistics, Whittle likelihood is an approximation to the likelihood function of a stationary Gaussian time series. It is named after the mathematician and statistician Peter Whittle, who introduced it in his PhD thesis in 1951. It is commonly used in time series analysis and signal processing for parameter estimation and signal detection.

Peter D. Welch is a scientist and researcher in the area of computer simulation, as well as applied mathematics, applied statistics, and computer science. A former IBM researcher, he is best known for his work with Welch's method to reduce signal noise.