2004 United States presidential election in South Dakota

Last updated

2004 United States presidential election in South Dakota
Flag of South Dakota.svg
  2000 November 2, 2004 2008  
Turnout77.3%
  George-W-Bush.jpeg John F. Kerry.jpg
Nominee George W. Bush John Kerry
Party Republican Democratic
Home state Texas Massachusetts
Running mate Dick Cheney John Edwards
Electoral vote30
Popular vote232,584149,244
Percentage59.91%38.44%

South Dakota Presidential Election Results 2004.svg
County Results

President before election

George W. Bush
Republican

Elected President

George W. Bush
Republican

The 2004 United States presidential election in South Dakota took place on November 2, 2004, and was part of the 2004 United States presidential election. Voters chose three representatives, or electors to the Electoral College, who voted for president and vice president.

Contents

South Dakota was won by incumbent President George W. Bush by a 21.5 point margin of victory. Prior to the election, all 12 news organizations considered this a state Bush would win, or otherwise considered as a safe red state. Since 1940, the state has voted for the Republican nominee in every presidential election, except 1964.

Primaries

Campaign

Predictions

There were twelve news organizations who made state-by-state predictions of the election. Here are their last predictions before election day. [1]

SourceRanking
D.C. Political ReportSolid R
Cook Political ReportSolid R
Research 2000Solid R
Zogby InternationalLikely R
Washington PostLikely R
Washington DispatchLikely R
Washington TimesSolid R
The New York TimesSolid R
CNNLikely R
NewsweekSolid R
Associated PressSolid R
Rasmussen ReportsLikely R

Polling

Bush won every pre-election by a double-digit margin. The final three poll average showed Bush with 55% to Kerry at 39 percent [2]

Fundraising

Bush raised $399,805. [3] Kerry raised $71,553. [4]

Advertising and visits

Neither campaign advertised or visited this state during the fall campaign season. [5] [6]

Analysis

South Dakota politics are generally dominated by the Republican Party, and the state has not supported a Democratic presidential candidate since 1964 — even George McGovern, the Democratic nominee in 1972 and himself a South Dakotan, did not carry the state. [7] [8] Additionally, a Democrat has not won the governorship since 1978. As of 2006, Republicans held a ten percent voter registration advantage over Democrats [9] and hold majorities in both the state House of Representatives [10] and Senate. [11]

Despite the state's general Republican and conservative leanings, Democrats have found success in various statewide elections, most notably in those involving South Dakota's congressional representatives in Washington. Two of the three members of the state's congressional delegation at the time were Democrats, and Senator Tom Daschle was the Senate minority leader (and briefly its majority leader during Democratic control of the Senate in 2001–02). [12]

Opposition to the Iraq War in this isolationist state [13] did allow Kerry to improve upon Al Gore’s performance in 2000 by two percentage points. Kerry's gains may also be attributed to Daschle's efforts to get Native American votes during his narrow defeat to John Thune in the concurrent Senate election. As a result, Kerry won four counties – Corson, Day, Roberts and Ziebach – that Gore had not carried in 2000.

Results

Presidential Candidate Running Mate PartyElectoral Vote (EV)Popular Vote (PV)
George W. Bush Richard Cheney Republican 3232,58459.91%
John Kerry John Edwards Democrat 0149,24438.44%
Ralph Nader Peter Camejo Independent 04,3201.11%
Michael Peroutka Chuck Baldwin Constitution 01,1030.28%
Michael Badnarik Richard Campagna Libertarian 09640.25%

Results by county

County [14] George W. Bush
Republican
John Kerry
Democratic
Ralph Nader
Independent
Michael Peroutka
Constitution
Michael J. Badnarik
Libertarian
MarginTotal votes cast
#%#%#%#%#%#%
Aurora 1,00961.19%62037.60%150.91%40.24%10.06%38923.59%1,649
Beadle 4,91757.98%3,44340.60%770.91%190.22%240.28%1,47417.38%8,480
Bennett 83351.10%75946.56%160.98%110.67%110.67%744.54%1,630
Bon Homme 2,06360.53%1,29337.94%361.06%50.15%110.32%77022.59%3,408
Brookings 7,66257.29%5,44340.70%1901.42%310.23%490.37%2,21916.59%13,375
Brown 10,38655.84%7,94342.71%1971.06%340.18%390.21%2,44313.13%18,599
Brule 1,54458.73%1,04039.56%301.14%90.34%60.23%50419.17%2,629
Buffalo 22326.52%60371.70%101.19%20.24%30.36%-380-45.18%841
Butte 3,16674.13%1,00923.62%451.05%350.82%160.37%2,15750.51%4,271
Campbell 70873.83%23924.92%40.42%70.73%10.10%46948.91%959
Charles Mix 2,55653.27%2,15544.91%731.52%50.10%90.19%4018.36%4,798
Clark 1,43561.67%87537.60%110.47%50.21%10.04%56024.07%2,327
Clay 2,69243.87%3,31554.03%951.55%90.15%250.41%-623-10.16%6,136
Codington 7,77861.00%4,80337.67%1351.06%190.15%160.13%2,97523.33%12,751
Corson 72041.76%97256.38%140.81%120.70%60.35%-252-14.62%1,724
Custer 2,92267.89%1,27229.55%581.35%360.84%160.37%1,65038.34%4,304
Davison 5,56162.12%3,26336.45%941.05%180.20%160.18%2,29825.67%8,952
Day 1,67147.20%1,81751.33%320.90%50.14%150.42%-146-4.13%3,540
Deuel 1,40658.29%96139.84%251.04%80.33%120.50%44518.45%2,412
Dewey 92135.92%1,60662.64%261.01%80.31%30.12%-685-26.72%2,564
Douglas 1,59679.32%39319.53%140.70%50.25%40.20%1,20359.79%2,012
Edmunds 1,43464.19%76534.24%190.85%120.54%40.18%66929.95%2,234
Fall River 2,41362.76%1,32634.49%671.74%230.60%160.42%1,08728.27%3,845
Faulk 94569.03%41830.53%50.37%10.07%00.00%52738.50%1,369
Grant 2,39258.48%1,63339.93%431.05%120.29%100.24%75918.55%4,090
Gregory 1,68566.18%81331.93%361.41%60.24%60.24%87234.25%2,546
Haakon 1,00781.21%21917.66%70.56%60.48%10.08%78863.55%1,240
Hamlin 1,94664.63%1,01533.71%371.23%70.23%60.20%93130.92%3,011
Hand 1,48267.76%66830.54%291.33%40.18%40.18%81437.22%2,187
Hanson 1,37964.14%74534.65%231.07%20.09%10.05%63429.49%2,150
Harding 70486.38%9411.53%131.60%30.37%10.12%61074.85%815
Hughes 6,01768.10%2,69730.53%760.86%220.25%230.26%3,32037.57%8,835
Hutchinson 2,89969.91%1,17728.38%491.18%80.19%140.34%1,72241.53%4,147
Hyde 63170.11%25928.78%60.67%20.22%20.22%37241.33%900
Jackson 72657.12%50839.97%211.65%110.87%50.39%21817.15%1,271
Jerauld 73659.55%48239.00%131.05%30.24%20.16%25420.55%1,236
Jones 56578.80%13418.69%111.53%20.28%50.70%43160.11%717
Kingsbury 1,80459.85%1,16338.59%341.13%40.13%90.30%64121.26%3,014
Lake 3,35955.92%2,50941.77%1081.80%120.20%190.32%85014.15%6,007
Lawrence 7,48964.45%3,85733.20%1761.51%460.40%510.44%3,63231.25%11,619
Lincoln 11,16165.40%5,70333.42%1410.83%320.19%290.17%5,45831.98%17,066
Lyman 1,02953.04%87244.95%211.08%120.62%60.31%1578.09%1,940
Marshall 1,24252.54%1,09946.49%140.59%30.13%60.25%1436.05%2,364
McCook 2,01761.66%1,20136.72%381.16%90.28%60.18%81624.94%3,271
McPherson 1,18074.73%36923.37%181.14%70.44%50.32%81151.36%1,579
Meade 8,34772.56%2,94125.57%1171.02%770.67%220.19%5,40646.99%11,504
Mellette 55359.40%36138.78%101.07%50.54%20.21%19220.62%931
Miner 81055.10%64143.61%130.88%50.34%10.07%16911.49%1,470
Minnehaha 44,18956.92%32,31441.62%8041.04%1710.22%1540.20%11,87515.30%77,632
Moody 1,79051.87%1,60946.62%361.04%100.29%60.17%1815.25%3,451
Pennington 29,97666.66%14,21331.61%5411.20%1020.23%1360.30%15,76335.05%44,968
Perkins 1,32973.30%41823.06%251.38%341.88%70.39%91150.24%1,813
Potter 1,14370.64%46328.62%90.56%20.12%10.06%68042.02%1,618
Roberts 2,39648.09%2,52750.72%490.98%40.08%60.12%-131-2.63%4,982
Sanborn 81757.29%58140.74%191.33%30.21%60.42%23616.55%1,426
Shannon 52612.48%3,56684.62%701.66%410.97%110.26%-3,040-72.14%4,214
Spink 2,25959.86%1,47839.16%270.72%50.13%50.13%78120.70%3,774
Stanley 1,12969.56%46428.59%201.23%40.25%60.37%66540.97%1,623
Sully 70276.55%20121.92%121.31%20.22%00.00%50154.63%917
Todd 88925.23%2,54372.16%461.31%320.91%140.40%-1,654-46.93%3,524
Tripp 2,23068.72%97229.95%290.89%100.31%40.12%1,25838.77%3,245
Turner 3,08463.80%1,64634.05%821.70%130.27%90.19%1,43829.75%4,834
Union 3,98756.57%3,00042.57%430.61%60.09%120.17%98714.00%7,048
Walworth 1,96768.30%87830.49%200.69%120.42%30.10%1,08937.81%2,880
Yankton 6,00357.55%4,23740.62%1291.24%270.26%350.34%1,76616.93%10,431
Ziebach 44740.05%64157.44%171.52%70.63%40.36%-194-17.39%1,116
Totals232,58459.91%149,24438.44%4,3201.11%1,1030.28%9640.25%83,34021.47%388,215

Counties that flipped from Republican to Democratic

By congressional district

Due to the state's small population, only one congressional district is allocated. This district, called the At-Large district, because it covers the entire state, and thus is equivalent to the statewide election results.

DistrictBushKerryRepresentative
At-large 59.9%38.4% Stephanie Herseth Sandlin

Electors

Technically the voters of SD cast their ballots for electors: representatives to the Electoral College. SD is allocated 3 electors because it has 1 congressional districts and 2 senators. All candidates who appear on the ballot or qualify to receive write-in votes must submit a list of 3 electors, who pledge to vote for their candidate and his or her running mate. Whoever wins the majority of votes in the state is awarded all 3 electoral votes. Their chosen electors then vote for president and vice president. Although electors are pledged to their candidate and running mate, they are not obligated to vote for them. An elector who votes for someone other than his or her candidate is known as a faithless elector.

The electors of each state and the District of Columbia met on December 13, 2004, to cast their votes for president and vice president. The Electoral College itself never meets as one body. Instead the electors from each state and the District of Columbia met in their respective capitols.

The following were the members of the Electoral College from the state. All 3 were pledged for Bush/Cheney. [15]

  1. Dennis Daugaard
  2. Larry Long
  3. Mike Rounds

See also

Related Research Articles

<span class="mw-page-title-main">2004 United States presidential election in Florida</span>

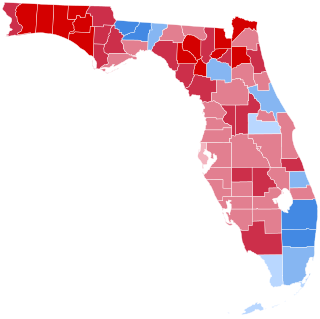
The 2004 United States presidential election in Florida took place on November 2, 2004, as part of the 2004 United States presidential election. Voters chose 27 representatives, or electors to the Electoral College, who voted for president and vice president.

<span class="mw-page-title-main">2004 United States presidential election in Ohio</span>

The 2004 United States presidential election in Ohio took place on November 2, 2004, and was part of the 2004 United States presidential election. Voters chose 20 representatives, or electors to the Electoral College, who voted for president and vice president.

<span class="mw-page-title-main">2004 United States presidential election in New Jersey</span>

The 2004 United States presidential election in New Jersey took place on November 2, 2004, and was part of the 2004 United States presidential election. Voters chose 15 representatives, or electors to the Electoral College, who voted for president and vice president.

<span class="mw-page-title-main">2004 United States presidential election in Alabama</span>

The 2004 United States presidential election in Alabama took place on November 2, 2004. Voters chose nine representatives, or electors, to the Electoral College, who voted for president and vice president.

<span class="mw-page-title-main">2004 United States presidential election in Arkansas</span>

The 2004 United States presidential election in Arkansas took place on November 2, 2004, and was part of the 2004 United States presidential election. State voters chose six representatives, or electors to the Electoral College, who voted for president and vice president.

<span class="mw-page-title-main">2004 United States presidential election in Colorado</span>

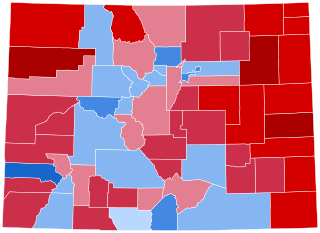
The 2004 United States presidential election in Colorado took place on November 2, 2004, and was part of the 2004 United States presidential election. Voters chose nine representatives, or electors to the Electoral College, who voted for president and vice president.

<span class="mw-page-title-main">2004 United States presidential election in Idaho</span>

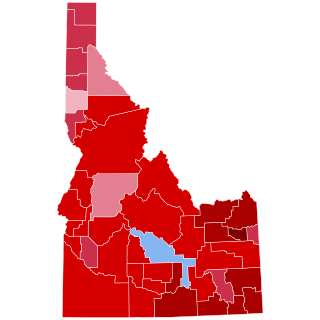
The 2004 United States presidential election in Idaho took place on November 2, 2004, and was part of the 2004 presidential election. Voters chose four representatives, or electors to the Electoral College, who voted for president and vice president.

<span class="mw-page-title-main">2004 United States presidential election in Massachusetts</span>

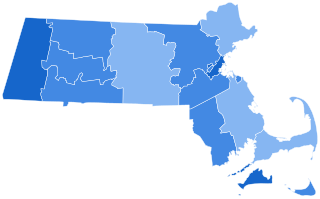
The 2004 United States presidential election in Massachusetts took place on November 2, 2004, and was part of the 2004 United States presidential election. Voters chose 12 representatives, or electors to the Electoral College, who voted for president and vice president.

<span class="mw-page-title-main">2004 United States presidential election in Oregon</span>

The 2004 United States presidential election in Oregon took place on November 2, 2004, and was part of the 2004 United States presidential election. Voters chose seven representatives, or electors, to the Electoral College, who voted for president and vice president.

<span class="mw-page-title-main">2004 United States presidential election in Minnesota</span>

The 2004 United States presidential election in Minnesota took place on November 2, 2004 as part of the 2004 United States presidential election. Voters chose ten representatives, or electors to the Electoral College, who voted for president and vice president.

<span class="mw-page-title-main">2004 United States presidential election in Missouri</span>

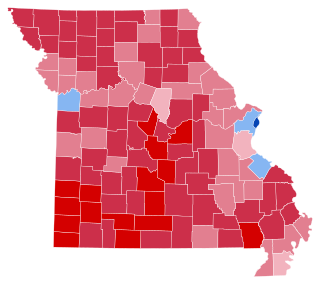
The 2004 United States presidential election in Missouri took place on November 2, 2004, and was part of the 2004 United States presidential election. Voters chose 11 representatives, or electors to the Electoral College, who voted for president and vice president.

<span class="mw-page-title-main">2004 United States presidential election in North Carolina</span>

The 2004 United States presidential election in North Carolina took place on November 2, 2004, and was part of the 2004 United States presidential election. Voters chose 15 representatives, or electors to the Electoral College, who voted for president and vice president.

<span class="mw-page-title-main">2004 United States presidential election in Virginia</span>

The 2004 United States presidential election in Virginia took place on November 2, 2004, and was part of the 2004 United States presidential election. Voters chose 13 representatives, or electors to the Electoral College, who voted for president and vice president.

The 2004 United States presidential election in Tennessee was held on November 2, 2004, and was part of the 2004 United States presidential election. Voters chose 11 representatives, or electors, to the Electoral College, who voted for president and vice president.

<span class="mw-page-title-main">2004 United States presidential election in Louisiana</span>

The 2004 United States presidential election in Louisiana took place on November 2, 2004, and was part of the 2004 United States presidential election. Voters chose nine representatives, or electors to the Electoral College, who voted for president and vice president.

<span class="mw-page-title-main">2004 United States presidential election in Mississippi</span>

The 2004 United States presidential election in Mississippi took place on November 2, 2004 as part of the 2004 United States presidential election. Voters chose six representatives, or electors to the Electoral College, who voted for president and vice president. It was the first presidential election since the 2000 United States census, after which Mississippi lost one electoral vote, reducing its elector count from seven to six, leaving Mississippi with the fewest electoral votes since 1848.

<span class="mw-page-title-main">2004 United States presidential election in Montana</span>

The 2004 United States presidential election in Montana took place on November 2, 2004, and was part of the 2004 United States presidential election. Voters chose three representatives, or electors to the Electoral College, who voted for president and vice president.

<span class="mw-page-title-main">2004 United States presidential election in North Dakota</span>

The 2004 United States presidential election in North Dakota took place on November 2, 2004, and was part of the 2004 United States presidential election. Voters chose three representatives, or electors to the Electoral College, who voted for president and vice president.

<span class="mw-page-title-main">2004 United States presidential election in West Virginia</span>

The 2004 United States presidential election in West Virginia took place on November 2, 2004, and was part of the 2004 United States presidential election. Voters chose 5 representatives, or electors to the Electoral College, who voted for president and vice president.

<span class="mw-page-title-main">2004 United States presidential election in Wyoming</span>

The 2004 United States presidential election in Wyoming took place on November 2, 2004, and was part of the 2004 United States presidential election. Voters chose three representatives, or electors to the Electoral College, who voted for president and vice president.

References

  1. Archived 2016-03-03 at the Wayback Machine
  2. "Election 2004 Polls - Dave Leip's Atlas of U.S. Presidential Elections". Archived from the original on November 16, 2008. Retrieved October 24, 2009.
  3. "George W Bush - $374,659,453 raised, '04 election cycle, Republican Party, President". Campaignmoney.com. Retrieved May 20, 2015.
  4. "John F Kerry - $345,826,176 raised, '04 election cycle, Democratic Party, President". Campaignmoney.com. Retrieved May 20, 2015.
  5. "CNN.com Specials". CNN.com. Retrieved May 20, 2015.
  6. "CNN.com Specials". CNN.com. Retrieved May 20, 2015.
  7. "McGOVERN, George Stanley, (1922-)". Biographical Directory of the United States Congress. Retrieved October 5, 2007.
  8. "Presidential General Election Graph Comparison - South Dakota". www.uselectionatlas.org. Retrieved October 5, 2007.
  9. "South Dakota Voter Registration Statistics". South Dakota Secretary of State. Archived from the original on July 22, 2011. Retrieved April 10, 2007.
  10. "Official List of South Dakota Representatives". State of South Dakota. Retrieved April 10, 2007.
  11. "Official List of South Dakota Senators". State of South Dakota. Retrieved April 10, 2007.
  12. "Daschle Loses S.D. Senate Seat to Thune". www.foxnews.com. November 3, 2004. Archived from the original on May 23, 2007. Retrieved April 10, 2007.
  13. Sullivan, Robert David; ‘How the Red and Blue Map Evolved Over the Past Century’; America Magazine in The National Catholic Review; June 29, 2016
  14. Our Campaigns; SD US Presidential Election Race, November 02, 2004
  15. "NARA | Federal Register | U.S. Electoral College". Archives.gov. Retrieved May 20, 2015.