2004 United States presidential election in Georgia

Last updated

2004 United States presidential election in Georgia
Flag of Georgia (U.S. state).svg
  2000 November 2, 2004 2008  
Turnout56.8% [1] Increase2.svg 5.9 pp
  George-W-Bush.jpeg John F. Kerry.jpg
Nominee George W. Bush John Kerry
Party Republican Democratic
Home state Texas Massachusetts
Running mate Dick Cheney John Edwards
Electoral vote150
Popular vote1,914,2541,366,149
Percentage57.97%41.37%

Georgia Presidential Election Results 2004.svg
2004 US Presidential election in Georgia by congressional district.svg
2004 GA Pres.svg

President before election

George W. Bush
Republican

Elected President

George W. Bush
Republican

The 2004 United States presidential election in Georgia took place on November 2, 2004. Voters chose 15 representatives, or electors to the Electoral College, who voted for president and vice president.

Contents

Georgia was won by incumbent President George W. Bush by a 16.60% margin of victory. Prior to the election, all 12 news organizations considered this a state Bush would win, or otherwise a red state. Bush performed almost five points better than he did in 2000. He also won a wide majority of the counties and congressional districts. The results of the state were similar to other states in the South, such as Alabama, Mississippi, Tennessee, Kentucky, and Louisiana. Like those states, the exit polling showed racial polarization as Bush dominated among white voters, which made up almost 70% of the vote, and Kerry dominated among African American voters, which made up 30% of the state's population. Software engineer and talk show host Michael Badnarik (L-TX) would finish third in the popular vote in Georgia, getting 0.56% of the vote, one of his best statewide performances in the nation.

In this election, Georgia voted 14.14% to the right of the nation at-large. [2]

As of 2020, this remains the last time that Georgia has been decided by a double-digit margin in a presidential election, and the last time Georgia voted to the right of Tennessee, Louisiana, West Virginia, and Arkansas. Georgia was one of 10 states that George W. Bush won twice which had only backed George H. W. Bush once. This was the first time that Georgia voted Republican three elections in a row. Bush is the only Republican in history to carry Georgia twice.

Primaries

Campaign

Predictions

There were 12 news organizations that made state-by-state predictions of the election. Here are their last predictions before election day. [3]

SourceRanking
D.C. Political ReportSolid R
Associated Press Solid R
CNN Likely R
Cook Political Report Solid R
Newsweek Solid R
New York Times Solid R
Rasmussen Reports Likely R
Research 2000 Solid R
Washington Post Likely R
Washington Times Solid R
Zogby International Likely R
Washington DispatchLikely R

Polling

Bush won every single pre-election poll and won each by a double-digit margin of victory and with over 50% of the vote. The final 3 polls averaged Bush leading 56% to 41%. [4]

Fundraising

Bush raised $6,656,076. [5] Kerry raised $2,282,977. [6]

Advertising and visits

Neither campaign advertised or visited this state during the fall election. [7] [8]

Analysis

Like other Deep South states during the 2004 election, the political demographics of Georgia was based more around the racial majority in each county, with white Georgians voting more Republican and black Georgians voting more Democratic. Democratic dominance in the state occurred in mostly black-majority counties in the region as well the urban center of the city of Atlanta (located mostly in central Fulton County) along with its core suburban counties of Clayton and DeKalb. Athens-Clarke County, home of the University of Georgia, also supported Kerry's bid, largely as a consequence of being a college town with traditionally left-leaning political views. Since just about every other part of Georgia had a majority white population, Republican dominance occurred in just about every other part of the state including suburban Atlanta where a significant portion of the state's population resides. Suburban Atlanta also includes northern Fulton County (the former Milton County area) which despite being part of this heavily urban and majority-minority county, is predominantly-White, suburban, and perhaps the most affluent area in the state of Georgia. This area also voted heavily in favor of Republican presidential incumbent George W. Bush.

In other down ballot races, Republicans gained Georgia's Class III U.S. Senate seat which was then held by Zell Miller (D) with Johnny Isakson's (R) victory in the open seat race to succeed him and also gained control of the Georgia House of Representatives, and thus control of both houses of the Georgia General Assembly (having already gained control of the Georgia State Senate in 2002), for the first time since Reconstruction. However, despite these achievements, Democrats gained one of Georgia's U.S. House seats with John Barrow's (D) victory over incumbent Representative Max Burns (R).

As of the 2020 presidential election , this is the last election in which the Metro Atlanta counties of Douglas, Rockdale, and Newton—now Democratic strongholds—voted Republican. This is also the last time the Black Belt counties of Baldwin, Sumter, and Washington voted Republican and the last in which Webster County voted Democratic, as well as the last election in which Georgia was decided by a double-digit margin.

Results

United States presidential election in Georgia, 2004 [9]
PartyCandidateRunning mateVotesPercentageElectoral votes
Republican George W. Bush (incumbent) Dick Cheney (incumbent)1,914,25457.97%15
Democratic John Kerry John Edwards 1,366,14941.37%0
Libertarian Michael Badnarik Richard Campagna 18,3870.56%0
Independent Ralph Nader (write-in) Peter Camejo 2,2310.07%0
Constitution Michael Peroutka (write-in) Chuck Baldwin 5800.02%0
Green David Cobb (write-in) Pat LaMarche 2280.01%0
Republican Tom Tancredo* (write-in)N/A260.00%0
Write-in John J. Kennedy N/A80.00%0
Write-in David C. Byrne N/A70.00%0
Write-in James Alexander-Pace N/A50.00%0
Totals3,301,875100.00%15
Voter turnout (voting-age population)51.7%

(*Tancredo was not the Republican Party's nominee in 2004.)

By county

CountyGeorge W. Bush
Republican
John Kerry
Democratic
Various candidates
Other parties
MarginTotal
#%#%#%#%
Appling 4,49470.52%1,84829.00%310.48%2,64641.52%6,373
Atkinson 1,66667.37%79932.31%80.32%86735.06%2,473
Bacon 2,85375.24%93024.53%90.24%1,92350.71%3,792
Baker 82146.52%93653.03%80.46%-115-6.51%1,765
Baldwin 7,70952.89%6,77546.48%910.62%9346.41%14,575
Banks 4,41078.86%1,14920.55%330.59%3,26158.31%5,592
Barrow 13,52076.17%4,09523.07%1350.76%9,42553.10%17,750
Bartow 22,31173.66%7,74125.56%2390.78%14,57048.10%30,291
Ben Hill 3,33160.07%2,18039.31%340.61%1,15120.76%5,545
Berrien 3,91769.87%1,63829.22%510.91%2,27940.65%5,606
Bibb 28,10748.64%29,32250.74%3590.62%-1,215-2.10%57,788
Bleckley 3,16770.83%1,28128.65%230.51%1,88642.18%4,471
Brantley 4,33377.02%1,25822.36%350.62%3,07554.66%5,626
Brooks 2,91256.91%2,19342.86%120.23%71914.05%5,117
Bryan 7,36373.67%2,59025.92%410.41%4,77347.75%9,994
Bulloch 12,25263.77%6,84035.60%1200.62%5,41228.17%19,212
Burke 4,23249.86%4,21349.64%420.49%190.22%8,487
Butts 5,11966.12%2,57233.22%510.66%2,54732.90%7,742
Calhoun 89044.08%1,11955.42%100.50%-229-11.34%2,019
Camden 9,48866.85%4,63732.67%680.48%4,85134.18%14,193
Candler 2,04864.91%1,09634.74%110.35%95230.17%3,155
Carroll 24,83770.27%10,22428.92%2860.81%14,61341.35%35,347
Catoosa 16,40673.43%5,80725.99%1280.58%10,59947.44%22,341
Charlton 2,31168.15%1,06431.38%160.47%1,24736.77%3,391
Chatham 45,48449.62%45,63049.78%5570.61%-146-0.16%91,671
Chattahoochee 90553.55%77345.74%120.71%1327.81%1,690
Chattooga 4,99263.50%2,80935.73%610.78%2,18327.77%7,862
Cherokee 58,23878.99%14,82420.11%6650.90%43,41458.88%73,727
Clarke 15,05240.20%21,71858.00%6731.80%-6,666-17.80%37,443
Clay 50938.85%79860.92%30.23%-289-22.07%1,310
Clayton 23,10629.01%56,11370.46%4240.53%-33,007-41.45%79,643
Clinch 1,50166.18%75033.07%170.75%75133.11%2,268
Cobb 173,46761.94%103,95537.12%2,6390.94%69,51224.82%280,061
Coffee 8,30667.35%3,97932.26%480.39%4,32735.09%12,333
Colquitt 8,29670.59%3,37828.74%780.67%4,91841.85%11,752
Columbia 35,54975.31%11,44224.24%2120.44%24,10751.07%47,203
Cook 3,06563.56%1,73335.94%240.49%1,33227.62%4,822
Coweta 31,68274.36%10,64724.99%2800.66%21,03549.37%42,609
Crawford 2,83064.20%1,55235.21%260.59%1,27828.99%4,408
Crisp 3,86561.80%2,35737.69%320.51%1,50824.11%6,254
Dade 4,36869.83%1,82329.14%641.02%2,54540.69%6,255
Dawson 6,64981.87%1,40717.33%650.80%5,24264.54%8,121
Decatur 5,34859.71%3,57739.94%310.35%1,77119.77%8,956
DeKalb 73,57026.58%200,78772.55%2,4140.87%-127,217-45.97%276,771
Dodge 4,58465.52%2,38434.08%280.40%2,20031.44%6,996
Dooly 1,85348.18%1,97351.30%200.52%-120-3.12%3,846
Dougherty 13,71140.70%19,80558.79%1710.51%-6,094-18.09%33,687
Douglas 25,84661.36%15,99737.98%2810.67%9,84923.38%42,124
Early 2,49559.14%1,70140.32%230.54%79418.82%4,219
Echols 75776.39%23123.31%30.30%52653.08%991
Effingham 12,50377.26%3,61322.33%660.41%8,89054.93%16,182
Elbert 4,62660.33%2,98438.91%580.76%1,64221.42%7,668
Emanuel 4,66662.44%2,77437.12%330.44%1,89225.32%7,473
Evans 2,29165.16%1,21334.50%120.34%1,07830.66%3,516
Fannin 6,86271.01%2,72728.22%750.77%4,13542.79%9,664
Fayette 37,34670.97%14,88728.29%3910.74%22,45942.68%52,624
Floyd 21,40067.56%10,03831.69%2380.75%11,36235.87%31,676
Forsyth 47,26783.04%9,20116.17%4510.79%38,06666.87%56,919
Franklin 5,21869.43%2,24529.87%520.69%2,97339.56%7,515
Fulton 134,37239.90%199,43659.23%2,9330.87%-65,064-19.33%336,741
Gilmer 7,41473.97%2,51025.04%990.99%4,90448.93%10,023
Glascock 1,01680.00%25019.69%40.31%76660.31%1,270
Glynn 18,60867.08%8,96232.31%1690.61%9,64634.77%27,739
Gordon 11,67173.88%4,02825.50%980.62%7,64348.38%15,797
Grady 5,06861.80%3,09237.70%410.50%1,97624.10%8,201
Greene 4,06959.17%2,77440.34%340.49%1,29518.83%6,877
Gwinnett 160,44565.66%81,70833.44%2,1900.99%78,73732.22%244,343
Habersham 10,43478.59%2,75020.71%920.69%7,68457.88%13,276
Hall 38,88378.09%10,51421.12%3950.79%28,36956.97%49,792
Hancock 82223.12%2,71576.37%180.51%-1,893-53.25%3,555
Haralson 7,70375.45%2,43423.84%720.71%5,26951.61%10,209
Harris 8,87871.82%3,40027.50%840.68%5,47844.32%12,362
Hart 5,50060.89%3,47938.52%530.59%2,02122.37%9,032
Heard 2,78870.48%1,14829.02%200.51%1,64041.46%3,956
Henry 42,75966.57%21,09632.84%3800.59%21,66333.73%64,235
Houston 29,86266.03%15,05433.29%3100.68%14,80832.74%45,226
Irwin 2,34768.67%1,05130.75%200.59%1,29637.92%3,418
Jackson 12,61177.84%3,46821.40%1230.76%9,14356.44%16,202
Jasper 3,15766.56%1,55832.85%280.59%1,59933.71%4,743
Jeff Davis 3,54973.25%1,27726.36%190.39%2,27246.89%4,845
Jefferson 3,06646.89%3,44752.71%260.40%-381-5.82%6,539
Jenkins 1,89855.74%1,49443.88%130.38%40411.86%3,405
Johnson 2,27964.11%1,26335.53%130.37%1,01628.58%3,555
Jones 6,93963.91%3,85535.50%640.59%3,08428.41%10,858
Lamar 4,02761.96%2,43237.42%400.62%1,59524.54%6,499
Lanier 1,64163.38%93135.96%170.65%71027.42%2,589
Laurens 10,88363.05%6,28136.39%970.66%4,60226.66%17,261
Lee 8,20178.64%2,18220.92%450.43%6,01957.72%10,428
Liberty 6,13147.86%6,61951.67%590.46%-488-3.81%12,809
Lincoln 2,30963.12%1,33736.55%120.33%97226.57%3,658
Long 1,99465.57%1,03333.97%140.46%96131.60%3,041
Lowndes 18,98159.91%12,51639.50%1870.59%6,46520.41%31,684
Lumpkin 6,69075.35%2,09123.55%1051.18%4,59951.80%8,878
Macon 1,85138.72%2,90660.79%230.48%-1,055-22.07%4,780
Madison 7,25473.60%2,52725.64%750.76%4,72747.96%9,856
Marion 1,67056.48%1,27543.12%120.41%39513.36%2,957
McDuffie 4,84662.29%2,89937.26%350.45%1,94725.03%7,780
McIntosh 2,83752.71%2,52346.88%220.40%3145.83%5,382
Meriwether 4,40253.98%3,70945.48%440.54%6938.50%8,155
Miller 1,69469.37%73630.14%120.49%95839.23%2,442
Mitchell 3,88553.42%3,36046.20%270.37%5257.22%7,272
Monroe 6,52266.59%3,21632.84%560.57%3,30633.75%9,794
Montgomery 2,15067.82%1,00731.77%130.41%1,14336.05%3,170
Morgan 4,90267.64%2,30431.79%410.57%2,59835.85%7,247
Murray 7,74572.38%2,89927.09%560.52%4,84645.29%10,700
Muscogee 30,85048.16%32,86751.31%3350.52%-2,017-3.15%64,052
Newton 18,09561.99%10,93937.47%1570.54%7,15624.52%29,191
Oconee 10,27672.37%3,78926.68%1340.94%6,48745.69%14,199
Oglethorpe 3,68865.41%1,89933.68%510.91%1,78931.73%5,638
Paulding 30,84376.13%9,42023.25%2510.62%21,42352.88%40,514
Peach 4,55453.24%3,96146.31%390.46%5936.93%8,554
Pickens 8,11576.28%2,44422.97%800.75%5,67153.31%10,639
Pierce 4,68078.99%1,23420.83%110.19%3,44658.16%5,925
Pike 5,19376.94%1,50622.31%500.74%3,68754.63%6,749
Polk 8,46768.17%3,86831.14%850.68%4,59937.03%12,420
Pulaski 2,20262.61%1,29436.79%210.60%90825.82%3,517
Putnam 5,18863.91%2,88035.48%500.62%2,30828.43%8,118
Quitman 40942.38%54356.27%131.35%-134-13.89%965
Rabun 4,65070.00%1,91828.87%751.13%2,73241.13%6,643
Randolph 1,41846.49%1,61252.85%200.66%-194-6.36%3,050
Richmond 29,76442.90%39,26256.59%3500.51%-9,498-13.69%69,376
Rockdale 18,85660.42%12,13638.89%2140.69%6,72021.53%31,206
Schley 1,06369.39%46430.29%50.33%59939.10%1,532
Screven 3,36056.68%2,53442.75%340.57%82613.93%5,928
Seminole 1,97760.26%1,27838.95%260.79%69921.31%3,281
Spalding 13,46163.99%7,46035.46%1150.55%6,00128.53%21,036
Stephens 6,90471.37%2,71428.05%560.57%4,19043.32%9,674
Stewart 79739.22%1,22060.04%150.74%-423-20.82%2,032
Sumter 5,68850.35%5,56249.23%480.43%1261.12%11,298
Talbot 1,10337.43%1,83062.10%140.48%-727-24.67%2,947
Taliaferro 33535.23%61264.35%40.42%-277-29.12%951
Tattnall 4,65771.93%1,78727.60%300.46%2,87044.33%6,474
Taylor 1,91256.52%1,45843.10%130.39%45413.42%3,383
Telfair 2,17157.49%1,59042.11%150.40%58115.38%3,776
Terrell 1,85948.58%1,95150.98%170.45%-92-2.40%3,827
Thomas 9,65961.39%5,99738.12%770.49%3,66223.27%15,733
Tift 8,61968.75%3,86430.82%540.44%4,75537.93%12,537
Toombs 6,19670.25%2,56729.10%570.65%3,62941.15%8,820
Towns 3,82372.34%1,43027.06%320.60%2,39345.28%5,285
Treutlen 1,69161.22%1,05238.09%190.69%63923.13%2,762
Troup 14,18364.65%7,63034.78%1260.57%6,55329.87%21,939
Turner 1,81561.21%1,13538.28%150.51%68022.93%2,965
Twiggs 2,11248.34%2,22050.81%370.85%-108-2.47%4,369
Union 6,84774.06%2,32725.17%710.77%4,52048.89%9,245
Upson 6,63465.72%3,42433.92%360.36%3,21031.80%10,094
Walker 15,34071.34%5,98627.84%1760.82%9,35443.50%21,502
Walton 21,59478.11%5,88721.29%1660.60%15,70756.82%27,647
Ware 7,79068.99%3,44930.55%520.46%4,34138.44%11,291
Warren 1,12145.04%1,36054.64%80.32%-239-9.60%2,489
Washington 4,08151.93%3,73347.51%440.56%3484.42%6,691
Wayne 6,81971.31%2,68328.06%600.63%4,13643.25%9,562
Webster 48548.12%51551.09%80.80%-30-2.97%1,008
Wheeler 1,19258.03%84741.24%150.73%34516.79%2,054
White 7,40377.89%2,01621.21%850.89%5,38756.68%9,504
Whitfield 19,29773.10%6,93326.26%1690.74%12,36446.84%26,399
Wilcox 1,70565.18%90234.48%90.34%80330.70%2,616
Wilkes 2,49054.75%2,02844.59%300.66%46210.16%4,548
Wilkinson 2,26150.04%2,23549.47%220.49%260.57%4,518
Worth 5,10569.40%2,21930.17%320.44%2,88639.23%7,356
Totals1,914,25457.93%1,366,14941.34%24,0780.73%548,10516.59%3,304,481
County Flips:
Democratic
Hold
Gain from Republican
Republican
Hold
Gain from Democratic Georgia County Flips 2004.svg
County Flips:

Counties that flipped from Democratic to Republican

Counties that flipped from Republican to Democratic

By congressional district

Bush won 9 of 13 congressional districts, including two held by Democrats. [10]

DistrictBushKerryRepresentative
1st 68%32% Jack Kingston
2nd 54%46% Sanford Bishop
3rd 56%44% Jim Marshall
4th 27%72% Denise Majette
Cynthia McKinney
5th 27%73% John Lewis
6th 70%29% Johnny Isakson
Tom Price
7th 73%26% John Linder
8th 72%27% Lynn Westmoreland
9th 72%27% Charlie Norwood
10th 76%23% Nathan Deal
11th 55%45% Phil Gingrey
12th 47%53% Max Burns
John Barrow
13th 36%64% David Scott

Electors

Technically the voters of Georgia cast their ballots for electors: representatives to the Electoral College. Georgia is allocated 15 electors because it has 13 congressional districts and 2 senators. All candidates who appear on the ballot or qualify to receive write-in votes must submit a list of 15 electors, who pledge to vote for their candidate and his or her running mate. Whoever wins the majority of votes in the state is awarded all 15 electoral votes. Their chosen electors then vote for president and vice president. Although electors are pledged to their candidate and running mate, they are not obligated to vote for them. An elector who votes for someone other than his or her candidate is known as a faithless elector.

The electors of each state and the District of Columbia met on December 13, 2004, to cast their votes for president and vice president. The Electoral College itself never meets as one body. Instead the electors from each state and the District of Columbia met in their respective capitols.

The following were the members of the Electoral College from the state. All were pledged to and voted for George W. Bush and Dick Cheney. [11] [12]

  1. Anna R. Cablik
  2. Fred Cooper
  3. Nancy N. Coverdell
  4. James C. Edenfield
  5. Karen Handel
  6. Donald F. Layfield
  7. Carolyn Dodgen Meadows
  8. Sunny K. Park
  9. Alec Poitevint
  10. Joan Ransom
  11. Nardender G. Reddy
  12. Jame Raynolds
  13. Norma Mountain Rogers
  14. Eric Tanenblatt
  15. Virgil Williams

Related Research Articles

<span class="mw-page-title-main">2004 United States presidential election in California</span>

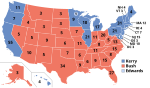
The 2004 United States presidential election in California took place on November 2, 2004, and was part of the 2004 United States presidential election. Voters chose 55 representatives, or electors to the Electoral College, who voted for president and vice president.

<span class="mw-page-title-main">2004 United States presidential election in Texas</span> Election in Texas

The 2004 United States presidential election in Texas took place on November 2, 2004, and was part of the 2004 United States presidential election. State voters chose 34 representatives, or electors to the Electoral College, who voted for president and vice president.

<span class="mw-page-title-main">2004 United States presidential election in Florida</span> Election in Florida

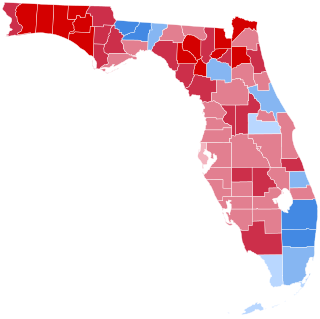
The 2004 United States presidential election in Florida took place on November 2, 2004, as part of the 2004 United States presidential election. Voters chose 27 representatives, or electors to the Electoral College, who voted for president and vice president.

<span class="mw-page-title-main">2004 United States presidential election in Pennsylvania</span> Election in Pennsylvania

The 2004 United States presidential election in Pennsylvania took place on November 2, 2004, and was part of the 2004 United States presidential election. Voters chose 21 representatives, or electors to the Electoral College, who voted for president and vice president.

<span class="mw-page-title-main">2004 United States presidential election in Alabama</span> Election in Alabama

The 2004 United States presidential election in Alabama took place on November 2, 2004. Voters chose nine representatives, or electors, to the Electoral College, who voted for president and vice president.

<span class="mw-page-title-main">2004 United States presidential election in Arkansas</span> Election in Arkansas

The 2004 United States presidential election in Arkansas took place on November 2, 2004, and was part of the 2004 United States presidential election. State voters chose six representatives, or electors to the Electoral College, who voted for president and vice president.

<span class="mw-page-title-main">2004 United States presidential election in Colorado</span> Election in Colorado

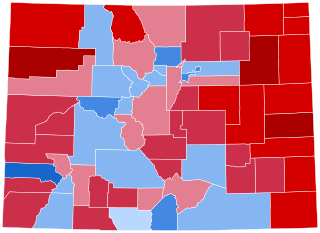
The 2004 United States presidential election in Colorado took place on November 2, 2004, and was part of the 2004 United States presidential election. Voters chose nine representatives, or electors to the Electoral College, who voted for president and vice president.

<span class="mw-page-title-main">2004 United States presidential election in Delaware</span> Election in Delaware

The 2004 United States presidential election in Delaware took place on November 2, 2004, and was part of the 2004 United States presidential election. Voters chose three representatives, or electors to the Electoral College, who voted for president and vice president.

<span class="mw-page-title-main">2004 United States presidential election in New York</span>

The 2004 United States presidential election in New York took place on November 2, 2004, and was part of the 2004 United States presidential election. Voters chose 31 representatives, or electors to the Electoral College, who voted for president and vice president.

<span class="mw-page-title-main">2004 United States presidential election in Indiana</span> Election in Indiana

The 2004 United States presidential election in Indiana took place on November 2, 2004, and was part of the 2004 United States presidential election. Voters chose 11 representatives, or electors to the Electoral College, who voted for president and vice president.

<span class="mw-page-title-main">2004 United States presidential election in Minnesota</span>

The 2004 United States presidential election in Minnesota took place on November 2, 2004 as part of the 2004 United States presidential election. Voters chose ten representatives, or electors to the Electoral College, who voted for president and vice president.

<span class="mw-page-title-main">2004 United States presidential election in Kentucky</span> Election in Kentucky

The 2004 United States presidential election in Kentucky took place on November 2, 2004, and was part of the 2004 United States presidential election. Voters chose eight representatives, or electors to the Electoral College, who voted for president and vice president.

<span class="mw-page-title-main">2004 United States presidential election in North Carolina</span>

The 2004 United States presidential election in North Carolina took place on November 2, 2004, and was part of the 2004 United States presidential election. Voters chose 15 representatives, or electors to the Electoral College, who voted for president and vice president.

<span class="mw-page-title-main">2004 United States presidential election in Michigan</span> Election in Michigan

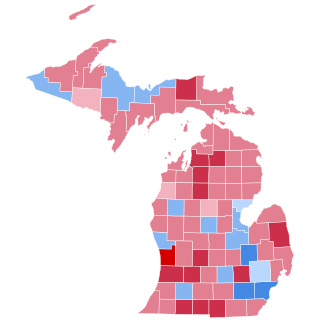
The 2004 United States presidential election in Michigan took place on November 2, 2004, and was part of the 2004 United States presidential election. Voters chose 17 representatives, or electors to the Electoral College, who voted for president and vice president.

The 2004 United States presidential election in Tennessee took place on November 2, 2004, and was part of the 2004 United States presidential election. Voters chose 11 representatives, or electors to the Electoral College, who voted for president and vice president.

<span class="mw-page-title-main">2004 United States presidential election in North Dakota</span> Election in North Dakota

The 2004 United States presidential election in North Dakota took place on November 2, 2004, and was part of the 2004 United States presidential election. Voters chose three representatives, or electors to the Electoral College, who voted for president and vice president.

<span class="mw-page-title-main">2004 United States presidential election in South Carolina</span> Election in South Carolina

The 2004 United States presidential election in South Carolina took place on November 2, 2004, as part of the 2004 United States presidential election which took place throughout all 50 states and D.C. Voters chose eight representatives, or electors to the Electoral College, who voted for president and vice president.

<span class="mw-page-title-main">2008 United States presidential election in Texas</span> Election in Texas

The 2008 United States presidential election in Texas took place on November 4, 2008, and was part of the 2008 United States presidential election. Voters chose 34 representatives, or electors to the Electoral College, who voted for president and vice president.

<span class="mw-page-title-main">2008 United States presidential election in Florida</span> Election in Florida

The 2008 United States presidential election in Florida took place on November 4, 2008, and was part of the 2008 United States presidential election. Voters chose 27 representatives, or electors to the Electoral College, who voted for president and vice president.

<span class="mw-page-title-main">2008 United States presidential election in Georgia</span> Election in Georgia

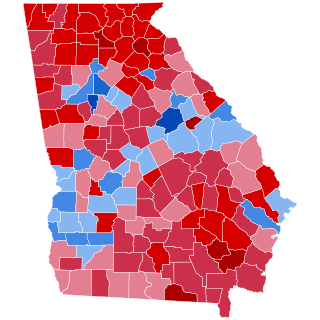
The 2008 United States presidential election in Georgia took place on November 4, 2008. Voters chose 15 representatives, or electors to the Electoral College, who voted for president and vice president.

References

  1. ( "Voting and Registration in the Election of November 2004". United States Census Bureau. March 2006. Retrieved December 19, 2020.)
  2. "Dave Leip's Atlas of U.S. Presidential Elections". uselectionatlas.org. Retrieved April 11, 2023.
  3. "D.C.'s Political Report's 2004 Presidential Ratings". Archived from the original on November 21, 2010. Retrieved July 8, 2021.
  4. "2004 Presidential Election Polls" . Retrieved July 8, 2021.
  5. "Political Campaign Contributions Campaign Finance Information '04 Election Cycle" . Retrieved July 8, 2021.
  6. "Political Campaign Contributions Campaign Finance Information '04 Election Cycle" . Retrieved July 8, 2021.
  7. "CNN.com Specials". CNN.
  8. "CNN.com Specials". CNN.
  9. "Official General Election Results for US president (2004)" (PDF). p. 5. Archived from the original (PDF) on May 13, 2009. Retrieved July 17, 2009.
  10. "2004 Presidential General Election Data - Georgia" . Retrieved July 8, 2021.
  11. "U. S. Electoral College 2004 Election". Archived from the original on October 9, 2008. Retrieved July 8, 2021.
  12. "2004 Presidential Electors". Archived from the original on January 12, 2006. Retrieved June 29, 2009.