California's 25th congressional district

Last updated

California's 25th congressional district
California's 25th congressional district (since 2023).svg
California's 25th congressional district
Interactive map of district boundaries since 2023 (Used in the 2022 elections)
Representative
  Raul Ruiz
DIndio
Population (2022)773,601
Median household
income
$65,453 [1]
Ethnicity
Cook PVI D+6 [2]

California's 25th congressional district is a congressional district in the U.S. state of California. The district is currently represented by Democrat Raul Ruiz.

Contents

The district includes all of Imperial County and parts of Riverside County and San Bernardino County. Cities in the new 25th district include Cathedral City, Indio, Coachella, El Centro, Calexico, San Jacinto, Hemet, and Needles. [3] Most of the majority-Latino parts of the Coachella Valley are in the 25th, while the rest of the valley is in the 41st district.

Demographics

According to the APM Research Lab's Voter Profile Tools (featuring the U.S. Census Bureau's 2019 American Community Survey), the district contained about 491,000 potential voters (citizens, age 18+). Of these, 44% are White, 34% Latino, 10% Black, and 9% Asian. Immigrants make up 17% of the district's potential voters. Median income among households (with one or more potential voter) in the district is about $86,600, while 9% of households live below the poverty line. 12% of residents 25 years and older have not graduated high school, while 26% hold a bachelor's degree or higher.

Recent results in statewide elections

YearU.S. PresidentU.S. SenatorGovernor
1992 Bush (R): 39.0 – 36.1% [4] Herschensohn (R): 53.9 – 36.6% [5] Seymour (R): 47.9 – 43.1% [6]
1994 Huffington (R): 57.5 - 34.1% [7] Wilson (R): 67.2 - 28.7% [8]
1996 Dole (R): 47.2 - 41.0% [9]
1998 Fong (R): 52.7 - 43.4% [10] Davis (D): 49.5 - 47.5% [11]
2000 Bush (R): 51.4 – 44.7% [12] Feinstein (D): 47.0 – 46.2% [13]
2002 Simon (R): 57.5 – 34.3% [14]
2003 Recall: Green check.svg Yes 74.5 – 25.5% [15]
Schwarzenegger (R): 66.2 – 16.2% [16]
2004 Bush (R): 58.8 – 39.9% [17] Jones (R): 49.3 – 45.6% [18]
2006 Mountjoy (R): 49.5 – 45.2% [19] Schwarzenegger (R): 66.4 – 28.5% [20]
2008 Obama (D): 49.4 – 48.3% [21]
2010 Fiorina (R): 54.0 – 38.9% Whitman (R): 50.9 – 41.4%
2012 Romney (R): 49.7 – 47.8% Emken (R): 50.8 – 49.2%
2014 Kashkari (R): 57.2 – 42.8%
2016 H. Clinton (D): 50.3 – 43.6% Harris (D): 60.1 – 39.9%
2018 de Leon (D): 50.3 – 49.7% Newsom (D): 51.1 – 48.9%
2020 Biden (D): 54.0 – 43.9%
2021 Recall: Red x.svg No 51 – 49% [22]
2022 Padilla (D): 54.6 – 45.4% Newsom (D): 52.5 – 47.5%

Composition

#CountySeatPopulation
25 Imperial El Centro 179,851
65 Riverside Riverside 2,458,395
71 San Bernardino San Bernardino 2,194,710

As of the 2020 redistricting, California's 25th congressional district is located in the Mojave Desert. It encompasses Imperial County, most of Riverside County, and the eastern edge of San Bernardino. The district covers the entirety of the Arizona-California border.

Riverside County is split between this district and the 41st district. They are partitioned by Terwillinger Rd, Bailey Rd, Candelaria, Elder Creek Rd, Bonny Ln, Tule Peak Rd, Eastgate Trail, Goldrush Rd, Rule Valley Rd, Laura Ln, Dove Dr, Lago Grande, Barbara Trail, Valley Dr, Foolish Pleasure Rd, Highway 371, Gelding Way, Puckit Dr, Indian Rd, Wellman Rd, El Toro Rd, Burnt Valley Rd, Cahuilla Rd, Highway 74, Bull Canyon Rd, Santa Rosa-San Jacinto Mountains National Monument, Fred Waring Dr, Washington St, Highway 10, Davall Dr, Dinah Shore Dr, Plumley Rd, Gerald Ford Dr, E Ramon Rd, San Luis Rey Dr, San Joaquin Dr, Clubhouse View Dr, Mount San Jacinto State Park, Azalea Creek, Black Mountain Trail, Highway 243, North Fork San Jacinto River, Stetson Ave, Hemet St, Cornell St, Girard St, E Newport Rd, Domenigoni Parkway, Leon Rd, Grand Ave, State Highway 74, California Ave, W Devonshire Ave, Warren Rd, Ramona Expressway, San Jacinto River, Highway 79, Oak Valley Parkway, Champions Dr, Union St, Brookside Ave. The 25th district takes in the cities of Coachella, Banning, Desert Hot Springs, Indio, San Jacinto, Hemet, Beaumont, and Blythe, as well as the census-designated places Valle Vista and East Hemet.

Cities & CDP with 10,000 or more people

List of members representing the district

MemberPartyDatesCong-
ress
Electoral historyCounties
District created January 3, 1953
PatrickJHillings.jpg
Patrick J. Hillings
(Arcadia)
Republican January 3, 1953 –
January 3, 1959
83rd
84th
85th
Redistricted from the 12th district and re-elected in 1952.
Re-elected in 1954.
Re-elected in 1956.
Retired to run for Attorney General of California.
1953–1967
Los Angeles
George A. Kasem (California Congressman).jpg
George A. Kasem
(West Covina)
Democratic January 3, 1959 –
January 3, 1961
86th Elected in 1958.
Lost re-election.
John H. Rousselot.jpg
John H. Rousselot
(San Gabriel)
Republican January 3, 1961 –
January 3, 1963
87th Elected in 1960.
Lost re-election.
Ronald B. Cameron, 1963.jpg
Ronald B. Cameron
(Whittier)
Democratic January 3, 1963 –
January 3, 1967
88th
89th
Elected in 1962.
Re-elected in 1964.
Lost re-election.
CharlesEWiggins.jpg
Charles E. Wiggins
(West Covina)
Republican January 3, 1967 –
January 3, 1975
90th
91st
92nd
93rd
Elected in 1966.
Re-elected in 1968.
Re-elected in 1970.
Re-elected in 1972.
Redistricted to the 39th district .
1967–1973
Los Angeles, Orange
1973–1983
Los Angeles
Edward R Roybal.jpg
Edward R. Roybal
(Los Angeles)
Democratic January 3, 1975 –
January 3, 1993
94th
95th
96th
97th
98th
99th
100th
101st
102nd
Redistricted from the 30th district and re-elected in 1974.
Re-elected in 1976.
Re-elected in 1978.
Re-elected in 1980.
Re-elected in 1982.
Re-elected in 1984.
Re-elected in 1986.
Re-elected in 1988.
Re-elected in 1990.
Retired.
1983–1993
Central/eastern Los Angeles
Buck McKeon 2011.jpeg
Buck McKeon
(Santa Clarita)
Republican January 3, 1993 –
January 3, 2015
103rd
104th
105th
106th
107th
108th
109th
110th
111th
112th
113th
Elected in 1992.
Re-elected in 1994.
Re-elected in 1996.
Re-elected in 1998.
Re-elected in 2000.
Re-elected in 2002.
Re-elected in 2004.
Re-elected in 2006.
Re-elected in 2008.
Re-elected in 2010.
Re-elected in 2012.
Retired.
1993–2003
Northern Los Angeles
2003–2013
CA-25th.png
Inyo, northern Los Angeles, Mono, northwestern San Bernardino
2013–2023
California US Congressional District 25 (since 2013).tif
Northern Los Angeles including Palmdale and Santa Clarita,
northeastern Ventura including Simi Valley
Steve Knight official congressional photo.jpeg
Steve Knight
(Lancaster)
Republican January 3, 2015 –
January 3, 2019
114th
115th
Elected in 2014.
Re-elected in 2016.
Lost re-election.
Katie Hill, official portrait, 116th Congress.jpg
Katie Hill
(Santa Clarita)
Democratic January 3, 2019 –
November 3, 2019
116th Elected in 2018.
Resigned.
VacantNovember 3, 2019 –
May 12, 2020
116th
117th
Mike Garcia, official portrait, 116th Congress (cropped1).jpg
Mike Garcia
(Santa Clarita)
Republican May 12, 2020 –
January 3, 2023
Elected to finish Hill's term.
Re-elected in 2020.
Redistricted to the 27th district .
Raul Ruiz, official portrait, 113th congress.jpg
Raul Ruiz
(Indio)
Democratic January 3, 2023 –
present
118th Redistricted from the 36th district and re-elected in 2022.2023–present
California's 25th congressional district (since 2023) (new version).svg
Indio, Coachella, Desert Hot Springs, Cathedral City, San Jacinto, Hemet, Needles, Half of Rancho Mirage High School (Northern half), Coachella Valley, Palm Springs Area and El Centro in the Colorado Desert

Election results

Original district: 1953–1967

1952 election [23]
PartyCandidateVotes%
Republican Patrick J. Hillings (Incumbent) 135,465 64.3
Democratic Woodrow Wilson Sayre75,12535.7
Total votes210,590 100.0
Turnout  
Republican hold
1954 election [24]
PartyCandidateVotes%
Republican Patrick J. Hillings (Incumbent) 113,027 65.2
Democratic John S. Sobieski60,37034.8
Total votes173,397 100.0
Turnout  
Republican hold
1956 election [25]
PartyCandidateVotes%
Republican Patrick J. Hillings (Incumbent) 166,305 63.8
Democratic John S. Sobieski94,18036.2
Total votes260,485 100.0
Turnout  
Republican hold
1958 election [26]
PartyCandidateVotes%
Democratic George A. Kasem 135,009 50.1
Republican Prescott O. Lieberg134,40649.9
Total votes269,415 100.0
Turnout  
Democratic gain from Republican
1960 election [27]
PartyCandidateVotes%
Republican John H. Rousselot 182,545 53.6
Democratic George A. Kasem (Incumbent)158,28946.4
Total votes340,834 100.0
Turnout  
Republican gain from Democratic
1962 election [28]
PartyCandidateVotes%
Democratic Ronald B. Cameron 62,371 53.6
Republican John H. Rousselot (Incumbent)53,96146.4
Total votes116,332 100.0
Turnout  
Democratic gain from Republican
1964 election [29]
PartyCandidateVotes%
Democratic Ronald B. Cameron (Incumbent) 81,320 55.4
Republican Frank J. Walton65,34444.6
Total votes146,664 100.0
Turnout  
Democratic hold

First redistricting: 1967–1973

1966 election [30]
PartyCandidateVotes%
Republican Charles E. Wiggins 70,154 52.6
Democratic Ronald B. Cameron (Incumbent)63,34547.4
Total votes133,499
Republican gain from Democratic
1968 election [31]
PartyCandidateVotes%
Republican Charles E. Wiggins (Incumbent) 141,600 68.6
Democratic Keith F. Shirey64,73231.4
Total votes206,332 100.0
Turnout  
Republican hold
1970 election [32]
PartyCandidateVotes%
Republican Charles E. Wiggins (Incumbent) 116,169 63.3
Democratic Leslie W. "Les" Craven64,38635.1
American Independent Kevin Scanlon2,9941.6
Total votes183,549 100.0
Turnout  
Republican hold

Second redistricting: 1973–1983

1972 election [33]
PartyCandidateVotes%
Republican Charles E. Wiggins (Incumbent) 115,908 64.9
Democratic Leslie W. "Les" Craven50,01531.9
American Independent Alfred Romirez5,5413.1
Total votes171,464 100.0
Turnout  
Republican hold
1974 election [34]
PartyCandidateVotes%
Democratic Edward R. Roybal (Incumbent) 43,998 100.0
Turnout  
Democratic gain from Republican
1976 election [35]
PartyCandidateVotes%
Democratic Edward R. Roybal (Incumbent) 57,966 71.9
Republican Robert K. Watson17,73722.0
Peace and Freedom Marilyn Se4,9226.1
Total votes80,625 100.0
Turnout  
Democratic hold
1978 election [36]
PartyCandidateVotes%
Democratic Edward R. Roybal (Incumbent) 45,881 67.4
Republican Robert K. Watson22,20532.6
Total votes68,086 100.0
Turnout  
Democratic hold
1980 election [37]
PartyCandidateVotes%
Democratic Edward R. Roybal (Incumbent) 49,080 66.0
Republican Richard E. Ferraro21,11628.4
Libertarian William D. Mitchell4,1695.6
Total votes74,365 100.0
Turnout  
Democratic hold

Third redistricting: 1983–1993

1982 election [38]
PartyCandidateVotes%
Democratic Edward R. Roybal (Incumbent) 71,106 84.5
Libertarian Daniel John Gorham12,06014.5
Total votes83,166 100.0
Turnout  
Democratic hold
1984 election [39]
PartyCandidateVotes%
Democratic Edward R. Roybal (Incumbent) 74,261 71.7
Republican Roy D. "Bill" Bloxom24,96824.1
Libertarian Anthony G. Bajada4,3704.2
Total votes103,599 100.0
Turnout  
Democratic hold
1986 election [40]
PartyCandidateVotes%
Democratic Edward R. Roybal (Incumbent) 62,692 76.1
Republican Gregory L. Hardy17,55821.3
Libertarian Ted Brown2,1632.6
Total votes82,413 100.0
Turnout  
Democratic hold
1988 election [41]
PartyCandidateVotes%
Democratic Edward R. Roybal (Incumbent) 85,378 85.5
Peace and Freedom Paul Reyes8,7468.8
Libertarian John C. Thie5,7525.8
Total votes98,876 100.0
Turnout  
Democratic hold
1990 election [42]
PartyCandidateVotes%
Democratic Edward R. Roybal (Incumbent) 48,120 70.0
Republican Steven J. Renshaw17,02124.8
Libertarian Robert H. Scott3,5765.2
Total votes68,717 100.0
Turnout  
Democratic hold

Fourth redistricting: 1993–2003

1992 election [43]
PartyCandidateVotes%
Republican Buck McKeon 113,611 51.9
Democratic James H. Gilmartin72,23333.0
Independent Rick Pamplin13,9306.4
Libertarian Peggy L. Christensen6,9323.2
Green Charles Wilken6,9193.2
Peace and Freedom Nancy Lawrence5,0902.3
Total votes218,715 100.0
Turnout  
Republican win (new seat)
1994 election [44]
PartyCandidateVotes%
Republican Buck McKeon (Incumbent) 110,301 64.89
Democratic James H. Gilmartin53,44531.44
Libertarian Devin Cutler6,2053.65
No partyTulley (write-in)200.01
Total votes169,971 100.0
Turnout  
Republican hold
1996 election [45]
PartyCandidateVotes%
Republican Buck McKeon (Incumbent) 122,428 62.4
Democratic Diane Trautman65,08933.2
Libertarian Bruce Acker6,1733.2
Peace and Freedom Justin Gerber2,5131.2
Total votes196,203 100.0
Turnout  
Republican hold
1998 election [46]
PartyCandidateVotes%
Republican Buck McKeon (Incumbent) 114,013 74.67
Libertarian Bruce Acker38,66925.33
Total votes152,682 100.0
Turnout  
Republican hold
2000 election [47]
PartyCandidateVotes%
Republican Buck McKeon (Incumbent) 138,628 62.3
Democratic Sid Gold73,92133.2
Libertarian Bruce R. Acker7,2193.2
Natural Law Mews Small3,0101.3
Total votes222,778 100.0
Turnout  
Republican hold

Fifth redistricting: 2003–2013

2002 election [48]
PartyCandidateVotes%
Republican Buck McKeon (Incumbent) 80,775 65.0
Democratic Bob Conaway38,67431.1
Libertarian Frank M. Consolo Jr.4,8873.9
Total votes124,336 100.0
Turnout  
Republican hold
2004 election [49]
PartyCandidateVotes%
Republican Buck McKeon (Incumbent) 145,575 64.5
Democratic Fred "Tim" Willoughby80,39535.5
Total votes225,970 100.0
Turnout  
Republican hold
2006 election [50]
PartyCandidateVotes%
Republican Buck McKeon (Incumbent) 93,987 60.0
Democratic Robert Rodriguez55,91335.7
Libertarian David W. Erickson6,8734.3
Total votes156,773 100.0
Turnout  
Republican hold
2008 election [51]
PartyCandidateVotes%
Republican Buck McKeon (Incumbent) 144,660 57.73
Democratic Jackie Conaway105,92942.27
Total votes250,589 100.0
Turnout  72.24
Republican hold
2010 election [52]
PartyCandidateVotes%
Republican Buck McKeon (Incumbent) 118,308 61.83
Democratic Jackie Conaway73,02838.17
Total votes191,336 100.0
Turnout  
Republican hold

Sixth redistricting: 2013–2023

2012 election [53]
PartyCandidateVotes%
Republican Buck McKeon (Incumbent) 121,593 53.2
Democratic Lee Rogers106,98246.8
Total votes228,575 100.0
Turnout  
Republican hold
2014 election [54]
PartyCandidateVotes%
Republican Steve Knight 60,847 53.3
Republican Tony Strickland53,22546.7
Total votes114,072 100.0
Turnout  
Republican hold
2016 election [55]
PartyCandidateVotes%
Republican Steve Knight (Incumbent) 138,755 53.1
Democratic Bryan Caforio122,40646.9
Total votes261,161 100.0
Republican hold
2018 election [56]
PartyCandidateVotes%
Democratic Katie Hill 133,209 54.4
Republican Steve Knight (Incumbent)111,81345.6
Total votes245,022 100.0
Democratic gain from Republican
2020 special election [57] [58]
PartyCandidateVotes%
Republican Mike Garcia 95,383 54.9
Democratic Christy Smith 78,40645.1
Total votes173,868 100.0
Republican gain from Democratic
2020 election
PartyCandidateVotes%
Republican Mike Garcia (Incumbent) 169,638 50.05
Democratic Christy Smith 169,30549.95
Total votes338,943 100.0
Republican hold

Seventh redistricting: 2023–present

2022 election
PartyCandidateVotes%
Democratic Raul Ruiz (Incumbent) 87,641 57.4
Republican Brian Hawkins65,10142.6
Total votes152,742 100.0
Democratic hold

See also

Related Research Articles

California's 48th congressional district is a congressional district in the U.S. state of California based in San Diego County in Southern California. It is currently represented by Republican Darrell Issa.

California's 49th congressional district is a congressional district in the U.S. state of California. The district is represented by Mike Levin.

California's 9th congressional district is a congressional district in the U.S. state of California. Josh Harder, a Democrat, has represented the district since January 2023.

California's 10th congressional district is a congressional district in the U.S. state of California. Currently, the 10th district encompasses parts of the eastern San Francisco Bay Area. It is currently represented by Democrat Mark DeSaulnier.

California's 50th congressional district is a congressional district in the U.S. state of California, and encompasses parts of the Mid-Coast and northeastern parts of San Diego County. Scott Peters is currently the U.S. representative for California's 50th congressional district.

<span class="mw-page-title-main">California's 44th congressional district</span> U.S. House district for California

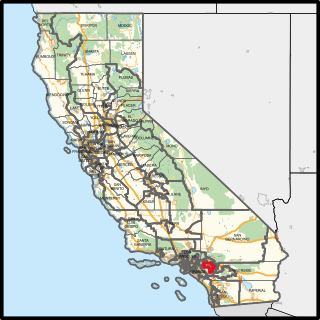
California's 44th congressional district is a congressional district in the U.S. state of California. The district is centered in South Los Angeles and the Los Angeles Harbor Region. It is currently represented by Democrat Nanette Barragán. The 44th district was created as a result of the redistricting cycle after the 1980 census.

California's 51st congressional district is a congressional district in the U.S. state of California. The district is currently represented by Democrat Sara Jacobs. The district currently includes central and eastern portions of San Diego, as well as eastern suburbs such as El Cajon, La Mesa, Spring Valley, and Lemon Grove.

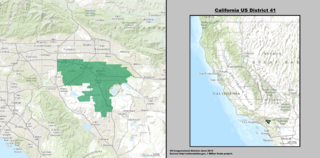
California's 6th congressional district is a congressional district in the U.S. state of California. It is represented by Democrat Ami Bera.

California's 18th congressional district is a congressional district located in the U.S. state of California. The district is currently represented by Democrat Zoe Lofgren. Since the 2022 election, the district is landlocked and includes all of San Benito County and parts of Santa Clara and Monterey counties, including Salinas, Hollister, Watsonville, Gilroy, Soledad, and downtown and eastern San Jose.

California's 8th congressional district is a congressional district in the U.S. state of California. As of 2023, Democrat John Garamendi represents the district. Currently, the 8th district includes parts of the Bay Area counties of Contra Costa County and Solano County, including the cities of Vallejo, Fairfield, Richmond and parts of Martinez.

<span class="mw-page-title-main">California's 41st congressional district</span> U.S. House district for California

California's 41st congressional district is a congressional district in Riverside County, in the U.S. state of California. The district is currently represented by Republican Ken Calvert.

California's 14th congressional district is a congressional district in the U.S. state of California. Eric Swalwell, a Democrat, has represented the district since January 2023.

California's 16th congressional district is a congressional district in the U.S. state of California. It includes portions of Santa Clara, San Mateo, and Santa Cruz counties, extending from the southwestern San Francisco Bay Area through the Santa Cruz Mountains to the Pacific coast. The district is currently represented by Democrat Anna Eshoo.

California's 17th congressional district is a congressional district in the U.S. state of California that is currently represented by Ro Khanna. It is located in the South Bay and East Bay regions of the San Francisco Bay Area.

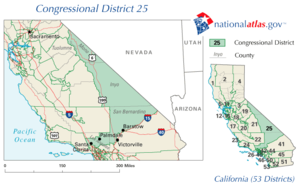
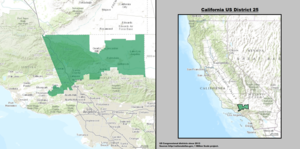
California's 23rd congressional district is a congressional district in the U.S. state of California. The district is represented in the 118th United States Congress by Jay Obernolte.

<span class="mw-page-title-main">California's 32nd congressional district</span> U.S. House district for California

California's 32nd congressional district is a congressional district in the U.S. state of California based in Los Angeles County. The 32nd district takes in the city of Malibu and the Los Angeles neighborhoods of Pacific Palisades, Beverly Glen, Bel Air, Studio City, Sherman Oaks, Woodland Hills, West Hills, Canoga Park, Winnetka, Reseda, Encino, Chatsworth, Northridge, Brentwood, North Hills, as well as the south side of Granada Hills.

<span class="mw-page-title-main">California's 39th congressional district</span> U.S. House district for California

California's 39th congressional district is a congressional district in the U.S. state of California. The district includes parts of Riverside County, including Jurupa Valley, Riverside, Moreno Valley, and Perris. The district has been represented by Democrat Mark Takano ever since he was redistricted from the 41st congressional district in 2022.

<span class="mw-page-title-main">California's 45th congressional district</span> U.S. House district for California

California's 45th congressional district is a congressional district in the U.S. state of California currently represented by Republican Michelle Steel. It was one of 18 districts that would have voted for Joe Biden in the 2020 presidential election had they existed in their current configuration while being won or held by a Republican in 2022.

<span class="mw-page-title-main">California's 47th congressional district</span> U.S. House district for California

California's 47th congressional district is a congressional district in the U.S. state of California.

California's 52nd congressional district is a congressional district in the U.S. state of California. The district is currently represented by Democrat Juan Vargas.

References

  1. Center for New Media & Promotion (CNMP), US Census Bureau. "My Congressional District". www.census.gov. Retrieved October 5, 2023.
  2. "2022 Cook PVI: District Map and List". Cook Political Report. Retrieved January 10, 2023.
  3. "CA 2022 Congressional". Dave's Redistricting. January 4, 2022. Retrieved November 14, 2022.
  4. "Supplement to the Statement of Vote, President by County (1992)" (PDF). Retrieved March 14, 2021.
  5. "Supplement to the Statement of Vote, Senator by County (1992)" (PDF). Retrieved March 14, 2021.
  6. "Supplement to the Statement of Vote, Senator by County (1992)" (PDF). Retrieved March 14, 2021.
  7. "Supplement to the Statement of Vote, United States Senator, Counties by Congressional Districts (1994)" (PDF). Retrieved March 14, 2021.
  8. "Supplement to the Statement of Vote, Governor, Counties by Congressional Districts (1994)" (PDF). Retrieved March 14, 2021.
  9. "Supplement to the Statement of Vote, President, Counties by Congressional Districts (1996)" (PDF). Retrieved March 14, 2021.
  10. "Supplement to the Statement of Vote, Senator, Counties by Congressional Districts (1998)" (PDF). Archived from the original (PDF) on October 1, 2011. Retrieved March 14, 2021.
  11. "Supplement to the Statement of Vote, Governor, Counties by Congressional Districts (1998)" (PDF). Archived from the original (PDF) on October 1, 2011. Retrieved March 14, 2021.
  12. "Statement of Vote (2000 President)" (PDF). Archived from the original (PDF) on May 20, 2011. Retrieved July 19, 2019.
  13. "Statement of Vote (2000 Senator)" (PDF). Archived from the original (PDF) on May 20, 2011. Retrieved July 19, 2019.
  14. "Statement of Vote (2002 Governor)" (PDF). Archived from the original (PDF) on November 11, 2010. Retrieved July 19, 2019.
  15. "Statement of Vote (2003 Recall Question)" (PDF). Archived from the original (PDF) on May 20, 2011. Retrieved July 19, 2019.
  16. "Statement of Vote (2003 Governor)" (PDF). Archived from the original (PDF) on May 20, 2011. Retrieved July 19, 2019.
  17. "Statement of Vote (2004 President)" (PDF). Archived from the original (PDF) on May 20, 2011. Retrieved July 19, 2019.
  18. "Statement of Vote (2004 Senator)" (PDF). Archived from the original (PDF) on August 10, 2011. Retrieved July 19, 2019.
  19. "Statement of Vote (2006 Senator)" (PDF). Archived from the original (PDF) on August 10, 2011. Retrieved July 19, 2019.
  20. "Statement of Vote (2006 Governor)" (PDF). Archived from the original (PDF) on August 10, 2011. Retrieved July 19, 2019.
  21. "(2008 President)". Archived from the original on February 14, 2009. Retrieved July 19, 2019.
  22. "Counties by Congressional District for Recall Question" (PDF). sos.ca.gov. September 14, 2021. Retrieved May 2, 2022.
  23. "1952 election results" (PDF). Clerk.house.gov. Retrieved September 22, 2018.
  24. "1954 election results" (PDF). Clerk.house.gov. Retrieved September 22, 2018.
  25. "1956 election results" (PDF). Clerk.house.gov. Retrieved September 22, 2018.
  26. "1958 election results" (PDF). Clerk.house.gov. Retrieved September 22, 2018.
  27. "1960 election results" (PDF). Clerk.house.gov. Retrieved September 22, 2018.
  28. "1962 election results" (PDF). Clerk.house.gov. Retrieved September 22, 2018.
  29. "1964 election results" (PDF). Clerk.house.gov. Retrieved September 22, 2018.
  30. "1966 election results" (PDF). Clerk.house.gov. Retrieved September 22, 2018.
  31. "1968 election results" (PDF). Clerk.house.gov. Retrieved September 22, 2018.
  32. "1970 election results" (PDF). Clerk.house.gov. Retrieved September 22, 2018.
  33. "1972 election results" (PDF). Clerk.house.gov. Retrieved September 22, 2018.
  34. "1974 election results" (PDF). Clerk.house.gov. Retrieved September 22, 2018.
  35. "1976 election results" (PDF). Clerk.house.gov. Retrieved September 22, 2018.
  36. "1978 election results" (PDF). Clerk.house.gov. Retrieved September 22, 2018.
  37. "1980 election results" (PDF). Clerk.house.gov. Retrieved September 22, 2018.
  38. "1982 election results" (PDF). Clerk.house.gov. Retrieved September 22, 2018.
  39. "1984 election results" (PDF). Clerk.house.gov. Retrieved September 22, 2018.
  40. "1986 election results" (PDF). Clerk.house.gov. Retrieved September 22, 2018.
  41. "1988 election results" (PDF). Clerk.house.gov. Retrieved September 22, 2018.
  42. "1990 election results" (PDF). Clerk.house.gov. Retrieved September 22, 2018.
  43. "1992 election results" (PDF). Clerk.house.gov. Retrieved September 22, 2018.
  44. "1994 election results" (PDF). Clerk.house.gov. Retrieved September 22, 2018.
  45. "1996 election results" (PDF). Clerk.house.gov. Retrieved September 22, 2018.
  46. "1998 election results" (PDF). Clerk.house.gov. Retrieved September 22, 2018.
  47. "2000 election results" (PDF). Clerk.house.gov. Retrieved September 22, 2018.
  48. "2002 general election results" (PDF). Archived from the original (PDF) on February 3, 2009. Retrieved July 19, 2019.
  49. [ permanent dead link ]
  50. "2006 general election results" (PDF). Archived from the original (PDF) on November 27, 2008. Retrieved July 19, 2019.
  51. "Archived copy" (PDF). Archived from the original (PDF) on February 2, 2014. Retrieved January 21, 2014.{{cite web}}: CS1 maint: archived copy as title (link)
  52. "Archived copy" (PDF). Archived from the original (PDF) on May 20, 2011. Retrieved January 21, 2014.{{cite web}}: CS1 maint: archived copy as title (link)
  53. "Archived copy" (PDF). Archived from the original (PDF) on October 19, 2013. Retrieved January 21, 2014.{{cite web}}: CS1 maint: archived copy as title (link)
  54. "U.S. House of Representatives District 25 - Districtwide Results | General Election | California Secretary of State". Archived from the original on December 22, 2014. Retrieved December 22, 2014.
  55. "2016 General Election Results | California Secretary of State". Archived from the original on November 30, 2016. Retrieved December 10, 2016.
  56. "United States Representative in Congress by District" (PDF). Retrieved March 19, 2019.
  57. "California Special Election Results: 25th Congressional District". The New York Times . New York, New York. May 13, 2020. Retrieved May 14, 2020.
  58. "U.S. House of Representatives District 25 - Districtwide Results" . Retrieved May 21, 2020.

34°33′N118°12′W / 34.55°N 118.2°W / 34.55; -118.2