This article is about energy flows at and above Earth's surface. For Earth's internal heat, see Earth's internal heat budget.
Earth's energy balance and imbalance, showing where the excess energy goes: Outgoing radiation is decreasing owing to increasing greenhouse gases in the atmosphere, leading to Earth's energy imbalance of about 460 TW. The percentage going into each domain of the climate system is also indicated.
Earth's energy budget (or Earth's energy balance) is the balance between the energy that Earth receives from the Sun and the energy the Earth loses back into outer space. Smaller energy sources, such as Earth's internal heat, are taken into consideration, but make a tiny contribution compared to solar energy. The energy budget also takes into account how energy moves through the climate system.[2]:2227 The Sun heats the equatorial tropics more than the polar regions. Therefore, the amount of solar irradiance received by a certain region is unevenly distributed. As the energy seeks equilibrium across the planet, it drives interactions in Earth's climate system, i.e., Earth's water, ice, atmosphere, rocky crust, and all living things.[2]:2224 The result is Earth's climate.
Earth's energy budget depends on many factors, such as atmospheric aerosols, greenhouse gases, surface albedo, clouds, and land use patterns. When the incoming and outgoing energy fluxes are in balance, Earth is in radiative equilibrium and the climate system will be relatively stable. Global warming occurs when earth receives more energy than it gives back to space, and global cooling takes place when the outgoing energy is greater.[3]
Multiple types of measurements and observations show a warming imbalance since at least year 1970.[4][5] The rate of heating from this human-caused event is without precedent.[6]:54 The main origin of changes in the Earth's energy is from human-induced changes in the composition of the atmosphere.[1] During 2005 to 2019 the Earth's energy imbalance (EEI) averaged about 460TW or globally 0.90±0.15W/m2.[1]
Earth's energy budget includes the "major energy flows of relevance for the climate system".[2] These are "the top-of-atmosphere energy budget; the surface energy budget; changes in the global energy inventory and internal flows of energy within the climate system".[2]:2227
Earth's energy flows
Incoming, top-of-atmosphere (TOA) shortwave flux radiation, shows energy received from the Sun as inferred from CERES measurements (26–27 Jan 2012). Brightest white areas show the highest reflectivity (least absorption) of solar energy, while darkest blue areas show the greatest absorption.
In spite of the enormous transfers of energy into and from the Earth, it maintains a relatively constant temperature because, as a whole, there is little net gain or loss: Earth emits via atmospheric and terrestrial radiation (shifted to longer electromagnetic wavelengths) to space about the same amount of energy as it receives via solar insolation (all forms of electromagnetic radiation).
The main origin of changes in the Earth's energy is from human-induced changes in the composition of the atmosphere, amounting to about 460TW or globally 0.90±0.15W/m2.[1]
The total amount of energy received per second at the top of Earth's atmosphere (TOA) is measured in watts and is given by the solar constant times the cross-sectional area of the Earth corresponded to the radiation. Because the surface area of a sphere is four times the cross-sectional area of a sphere (i.e. the area of a circle), the globally and yearly averaged TOA flux is one quarter of the solar constant and so is approximately 340watts per square meter (W/m2).[8][9] Since the absorption varies with location as well as with diurnal, seasonal and annual variations, the numbers quoted are multi-year averages obtained from multiple satellite measurements.[8]
Of the ~340W/m2 of solar radiation received by the Earth, an average of ~77W/m2 is reflected back to space by clouds and the atmosphere and ~23W/m2 is reflected by the surface albedo, leaving ~240W/m2 of solar energy input to the Earth's energy budget. This amount is called the absorbed solar radiation (ASR). It implies a value of about 0.3 for the mean net albedo of Earth, also called its Bond albedo (A):[8]
Outgoing longwave radiation
Outgoing, longwave flux radiation at the top-of-atmosphere (26–27 Jan 2012). Heat energy radiated from Earth (in watts per square metre) is shown in shades of yellow, red, blue and white. The brightest-yellow areas are the hottest and are emitting the most energy out to space, while the dark blue areas and the bright white clouds are much colder, emitting the least energy.
Energy leaves the planet in the form of outgoing longwave radiation (OLR). Longwave radiation is electromagnetic thermal radiation emitted by Earth's surface and atmosphere. Longwave radiation is in the infraredband, but the terms are not synonymous, as infrared radiation can be either shortwave or longwave. Sunlight contains significant amounts of shortwave infrared radiation. A threshold wavelength of 4 microns is sometimes used to distinguish longwave and shortwave radiation.
Generally, absorbed solar energy is converted to different forms of heat energy. Some of the solar energy absorbed by the surface is converted to thermal radiation at wavelengths in the "atmospheric window"; this radiation is able to pass through the atmosphere unimpeded and directly escape to space, contributing to OLR. The remainder of absorbed solar energy is transported upwards through the atmosphere through a variety of heat transfer mechanisms, until some of that energy is also able to escape to space, again contributing to OLR. For example, heat is transported into the atmosphere via evapotranspiration and latent heat fluxes or conduction/convection processes, as well as via radiative heat transport.[8] Ultimately, all outgoing energy is radiated into space in the form of longwave radiation.
A one-layer model produces an approximate description of OLR which yields temperatures at the surface (Ts=288Kelvin) and at the middle of the troposphere (Ta=242K) that are close to observed average values:[10]
In this expression σ is the Stefan–Boltzmann constant and ε represents the emissivity of the atmosphere, which is less than 1 because the atmosphere does not emit within the wavelength range known as the atmospheric window.
Aerosols, clouds, water vapor, and trace greenhouse gases contribute to an effective value of about ε = 0.78. The strong (fourth-power) temperature sensitivity maintains a near-balance of the outgoing energy flow to the incoming flow via small changes in the planet's absolute temperatures.
Increase in the Earth's non-cloud greenhouse effect (2000–2022) based on satellite data
As viewed from Earth's surrounding space, greenhouse gases influence the planet's atmospheric emissivity (ε). Changes in atmospheric composition can thus shift the overall radiation balance. For example, an increase in heat trapping by a growing concentration of greenhouse gases (i.e. an enhanced greenhouse effect) forces a decrease in OLR and a warming (restorative) energy imbalance.[11] Ultimately when the amount of greenhouse gases increases or decreases, in-situ surface temperatures rise or fall until the absorbed solar radiation equals the outgoing longwave radiation, or ASR equals OLR.
Earth's internal heat sources and other minor effects
The geothermal heat flow from the Earth's interior is estimated to be 47 terawatts (TW)[12] and split approximately equally between radiogenic heat and heat left over from the Earth's formation. This corresponds to an average flux of 0.087W/m2 and represents only 0.027% of Earth's total energy budget at the surface, being dwarfed by the 173000TW of incoming solar radiation.[13]
Human production of energy is even lower at an average 18TW, corresponding to an estimated 160,000TW-hr, for all of year 2019.[14] However, consumption is growing rapidly and energy production with fossil fuels also produces an increase in atmospheric greenhouse gases, leading to a more than 20 times larger imbalance in the incoming/outgoing flows that originate from solar radiation.[15]
Photosynthesis also has a significant effect: An estimated 140TW (or around 0.08%) of incident energy gets captured by photosynthesis, giving energy to plants to produce biomass.[16] A similar flow of heat is released over the course of a year when plants are used as food or fuel.
Other minor sources of energy are usually ignored in the calculations, including accretion of interplanetary dust and solar wind, light from stars other than the Sun and the thermal radiation from space. Earlier, Joseph Fourier had claimed that deep space radiation was significant in a paper often cited as the first on the greenhouse effect.[17]
Budget analysis
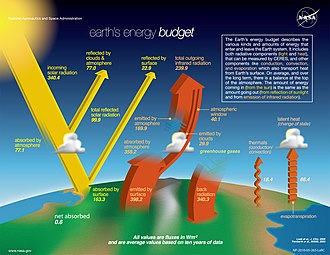
A Sankey diagram illustrating a balanced example of Earth's energy budget. Line thickness is linearly proportional to relative amount of energy.
In simplest terms, Earth's energy budget is balanced when the incoming flow equals the outgoing flow. Since a portion of incoming energy is directly reflected, the balance can also be stated as absorbed incoming solar (shortwave) radiation equal to outgoing longwave radiation:
Internal flow analysis
To describe some of the internal flows within the budget, let the insolation received at the top of the atmosphere be 100 units (=340W/m2), as shown in the accompanying Sankey diagram. Called the albedo of Earth, around 35 units in this example are directly reflected back to space: 27 from the top of clouds, 2 from snow and ice-covered areas, and 6 by other parts of the atmosphere. The 65 remaining units (ASR=220W/m2) are absorbed: 14 within the atmosphere and 51 by the Earth's surface.
The 51 units reaching and absorbed by the surface are emitted back to space through various forms of terrestrial energy: 17 directly radiated to space and 34 absorbed by the atmosphere (19 through latent heat of vaporisation, 9 via convection and turbulence, and 6 as absorbed infrared by greenhouse gases). The 48 units absorbed by the atmosphere (34 units from terrestrial energy and 14 from insolation) are then finally radiated back to space. This simplified example neglects some details of mechanisms that recirculate, store, and thus lead to further buildup of heat near the surface.
Ultimately the 65 units (17 from the ground and 48 from the atmosphere) are emitted as OLR. They approximately balance the 65 units (ASR) absorbed from the sun in order to maintain a net-zero gain of energy by Earth.[18]
Heat storage reservoirs
The rising accumulation of energy in the oceanic, land, ice, and atmospheric components of Earth's climate system since 1960
Land, ice, and oceans are active material constituents of Earth's climate system along with the atmosphere. They have far greater mass and heat capacity, and thus much more thermal inertia. When radiation is directly absorbed or the surface temperature changes, energy will flow as sensible heat either into or out of the bulk mass of these components via conduction/convection heat transfer processes. The transformation of water between its solid/liquid/vapor states also acts as a source or sink of potential energy in the form of latent heat. These processes buffer the surface conditions against some of the rapid radiative changes in the atmosphere. As a result, the daytime versus nighttime difference in surface temperatures is relatively small. Likewise, Earth's climate system as a whole shows a slow response to shifts in the atmospheric radiation balance.[19]
The top few meters of Earth's oceans harbor more energy than its entire atmosphere.[20] Like atmospheric gases, fluidic ocean waters transport vast amounts of energy over the planet's surface. Sensible heat also moves into and out of great depths under conditions that favor downwelling or upwelling.[21][22] Scientists observe these large-scale energy transfers by measuring changes in oceanic enthalpy.[23]
Over 90 percent of the extra energy that has accumulated on Earth from ongoing global warming since 1970 has been stored in the ocean.[20] About one-third has propagated to depths below 700meters. The overall rate of growth has also risen during recent decades, reaching close to 500TW (1W/m2) as of 2020.[24][5] That led to about 14zettajoules(ZJ) of heat gain for the year, exceeding the 570exajoules (=160,000TW-hr[14]) of total primary energy consumed by humans by a factor of at least 20.[15]
Heating/cooling rate analysis
Generally speaking, changes to Earth's energy flux balance can be thought of as being the result of external forcings (both natural and anthropogenic, radiative and non-radiative), system feedbacks, and internal system variability.[25] Such changes are primarily expressed as observable shifts in temperature (T), clouds (C), water vapor (W), aerosols (A), trace greenhouse gases (G), land/ocean/ice surface reflectance (S), and as minor shifts in insolation (I) among other possible factors. Earth's heating/cooling rate can then be analyzed over selected timeframes (Δt) as the net change in energy (ΔE) associated with these attributes:
Here the term ΔET, corresponding to the Planck response, is negative-valued when temperature rises due to its strong direct influence on OLR.[26][24]
The recent increase in trace greenhouse gases produces an enhanced greenhouse effect, and thus a positive ΔEG forcing term. By contrast, a large volcanic eruption (e.g. Mount Pinatubo 1991, El Chichón 1982) can inject sulfur-containing compounds into the upper atmosphere. High concentrations of stratospheric sulfur aerosols may persist for up to a few years, yielding a negative forcing contribution to ΔEA.[27][28] Various other types of anthropogenic aerosol emissions make both positive and negative contributions to ΔEA. Solar cycles produce ΔEI smaller in magnitude than those of recent ΔEG trends from human activity.[29][30]
Climate forcings are complex since they can produce direct and indirect feedbacks that intensify (positive feedback) or weaken (negative feedback) the original forcing. These often follow the temperature response. Water vapor trends as a positive feedback with respect to temperature changes due to evaporation shifts and the Clausius-Clapeyron relation. An increase in water vapor results in positive ΔEW due to further enhancement of the greenhouse effect. A slower positive feedback is the ice-albedo feedback. For example, the loss of Arctic ice due to rising temperatures makes the region less reflective, leading to greater absorption of energy and even faster ice melt rates, thus positive influence on ΔES.[31] Collectively, feedbacks excluding the Planck response tend to amplify global warming or cooling.[32]:94
Clouds are responsible for about half of Earth's albedo and are powerful expressions of internal variability of the climate system.[33][34] They may also act as feedbacks to forcings, and could be forcings themselves if for example a result of cloud seeding activity. Contributions to ΔEC vary regionally and depending upon cloud type. Measurements from satellites are gathered in concert with simulations from models in an effort to improve understanding and reduce uncertainty.[35]
Earth's energy budget (in W/m ) determines the climate. It is the balance of incoming and outgoing radiation and can be measured by satellites. The Earth's energy imbalance is the "net absorbed" energy amount.Earth's energy imbalance has increased in the 21st century, reaching values twice that of prior estimates from the IPCC. The ability to observe this imbalance is deteriorating because satellites are being decommissioned.
The Earth's energy imbalance (EEI) is defined as "the persistent and positive (downward) net top of atmosphere energy flux associated with greenhouse gas forcing of the climate system".[2]:2227
If Earth's incoming energy flux (ASR) is larger or smaller than the outgoing energy flux (OLR), then the planet will gain (warm) or lose (cool) net heat energy in accordance with the law of energy conservation:
.
Positive EEI thus defines the overall rate of planetary heating and is typically expressed as watts per square meter (W/m2). During 2005 to 2019 the Earth's energy imbalance averaged about 460 TW or globally 0.90 ± 0.15 W per m2.[1]
When Earth's energy imbalance (EEI) shifts by a sufficiently large amount, the shift is measurable by orbiting satellite-based instruments.[28][37] Imbalances that fail to reverse over time will also drive long-term temperature changes in the atmospheric, oceanic, land, and ice components of the climate system.[38] Temperature, sea level, ice mass and related shifts thus also provide measures of EEI.[5]
The biggest changes in EEI arise from changes in the composition of the atmosphere through human activities, thereby interfering with the natural flow of energy through the climate system.[1] The main changes are from increases in carbon dioxide and other greenhouse gases, that produce heating (positive EEI), and pollution. The latter refers to atmospheric aerosols of various kinds, some of which absorb energy while others reflect energy and produce cooling (or lower EEI).
It is not (yet) possible to measure the absolute magnitude of EEI directly at top of atmosphere, although changes over time as observed by satellite-based instruments are thought to be accurate. The only practical way to estimate the absolute magnitude of EEI is through an inventory of the changes in energy in the climate system. The biggest of these energy reservoirs is the ocean.[1]
Energy inventory assessments
The planetary heat content that resides in the climate system can be compiled given the heat capacity, density and temperature distributions of each of its components. Most regions are now reasonably well sampled and monitored, with the most significant exception being the deep ocean.[40]
Schematic drawing of Earth's excess heat inventory and energy imbalance for two recent time periods
Estimates of the absolute magnitude of EEI have likewise been calculated using the measured temperature changes during recent multi-decadal time intervals. For the 2006 to 2020 period EEI was about +0.76±0.2W/m2 and showed a significant increase above the mean of +0.48±0.1W/m2 for the 1971 to 2020 period.[5]
EEI has been positive because temperatures have increased almost everywhere for over 50 years. Global surface temperature (GST) is calculated by averaging temperatures measured at the surface of the sea along with air temperatures measured over land. Reliable data extending to at least 1880 shows that GST has undergone a steady increase of about 0.18°C per decade since about year 1970.[41]
Ocean waters are especially effective absorbents of solar energy and have a far greater total heat capacity than the atmosphere.[42] Research vessels and stations have sampled sea temperatures at depth and around the globe since before 1960. Additionally, after the year 2000, an expanding network of nearly 4000 Argo robotic floats has measured the temperature anomaly, or equivalently the ocean heat content change (ΔOHC). Since at least 1990, OHC has increased at a steady or accelerating rate. ΔOHC represents the largest portion of EEI since oceans have thus far taken up over 90% of the net excess energy entering the system over time (Δt):[43][44]
.
Earth's outer crust and thick ice-covered regions have taken up relatively little of the excess energy. This is because excess heat at their surfaces flows inward only by means of thermal conduction, and thus penetrates only several tens of centimeters on the daily cycle and only several tens of meters on the annual cycle.[45] Much of the heat uptake goes either into melting ice and permafrost or into evaporating more water from soils.
Measurements at top of atmosphere (TOA)
Several satellites measure the energy absorbed and radiated by Earth, and thus by inference the energy imbalance. These are located top of atmosphere (TOA) and provide data covering the globe. The NASAEarth Radiation Budget Experiment (ERBE) project involved three such satellites: the Earth Radiation Budget Satellite (ERBS), launched October 1984; NOAA-9, launched December 1984; and NOAA-10, launched September 1986.[46]
The growth in Earth's energy imbalance from satellite and in situ measurements (2005–2019). A rate of +1.0W/m summed over the planet's surface equates to a continuous heat uptake of about 500terawatts (~0.3% of the incident solar radiation).
NASA's Clouds and the Earth's Radiant Energy System (CERES) instruments are part of its Earth Observing System (EOS) since March 2000. CERES is designed to measure both solar-reflected (short wavelength) and Earth-emitted (long wavelength) radiation.[48] The CERES data showed increases in EEI from +0.42±0.48W/m2 in 2005 to +1.12±0.48W/m2 in 2019. Contributing factors included more water vapor, less clouds, increasing greenhouse gases, and declining ice that were partially offset by rising temperatures.[24][47] Subsequent investigation of the behavior using the GFDL CM4/AM4 climate model concluded there was a less than 1% chance that internal climate variability alone caused the trend.[49]
Other researchers have used data from CERES, AIRS, CloudSat, and other EOS instruments to look for trends of radiative forcing embedded within the EEI data. Their analysis showed a forcing rise of +0.53±0.11W/m2 from years 2003 to 2018. About 80% of the increase was associated with the rising concentration of greenhouse gases which reduced the outgoing longwave radiation.[50][51][52]
Further satellite measurements including TRMM and CALIPSO data have indicated additional precipitation, which is sustained by increased energy leaving the surface through evaporation (the latent heat flux), offsetting some of the increase in the longwave greenhouse flux to the surface.[53]
It is noteworthy that radiometric calibration uncertainties limit the capability of the current generation of satellite-based instruments, which are otherwise stable and precise. As a result, relative changes in EEI are quantifiable with an accuracy which is not also achievable for any single measurement of the absolute imbalance.[54][55]
Observations since 1994 show that ice has retreated from every part of Earth at an accelerating rate.[57]Mean global sea level has likewise risen as a consequence of the ice melt in combination with the overall rise in ocean temperatures.[58] These shifts have contributed measurable changes to the geometric shape and gravity of the planet.
Changes to the mass distribution of water within the hydrosphere and cryosphere have been deduced using gravimetric observations by the GRACE satellite instruments. These data have been compared against ocean surface topography and further hydrographic observations using computational models that account for thermal expansion, salinity changes, and other factors. Estimates thereby obtained for ΔOHC and EEI have agreed with the other (mostly) independent assessments within uncertainties.[56][59]
Importance as a climate change metric
Climate scientists Kevin Trenberth, James Hansen, and colleagues have identified the monitoring of Earth's energy imbalance as an important metric to help policymakers guide the pace for mitigation and adaptation measures. Because of climate system inertia, longer-term EEI (Earth's energy imbalance) trends can forecast further changes that are "in the pipeline".[38][60][61]
Scientists found that the EEI is the most important metric related to climate change. It is the net result of all the processes and feedbacks in play in the climate system.[1] Knowing how much extra energy affects weather systems and rainfall is vital to understand the increasing weather extremes.[1]
In 2012, NASA scientists reported that to stop global warming atmospheric CO2 concentration would have to be reduced to 350ppm or less, assuming all other climate forcings were fixed.[62] As of 2020, atmospheric CO2 reached 415ppm and all long-lived greenhouse gases exceeded a 500ppm CO2-equivalent concentration due to continued growth in human emissions.[63]
↑Fleming, James R. (1999). "Joseph Fourier, the 'greenhouse effect', and the quest for a universal theory of terrestrial temperatures". Endeavour. 23 (2): 72–75. doi:10.1016/S0160-9327(99)01210-7.
↑National Research Council (2005). Radiative Forcing of Climate Change: Expanding the Concept and Addressing Uncertainties. The National Academic Press. doi:10.17226/11175. ISBN978-0-309-09506-8.
↑Arias, P.A., N. Bellouin, E. Coppola, R.G. Jones, G. Krinner, J. Marotzke, V. Naik, M.D. Palmer, G.-K. Plattner, J. Rogelj, M. Rojas, J. Sillmann, T. Storelvmo, P.W. Thorne, B. Trewin, K. Achuta Rao, B. Adhikary, R.P. Allan, K. Armour, G. Bala, R. Barimalala, S. Berger, J.G. Canadell, C. Cassou, A. Cherchi, W. Collins, W.D. Collins, S.L. Connors, S. Corti, F. Cruz, F.J. Dentener, C. Dereczynski, A. Di Luca, A. Diongue Niang, F.J. Doblas-Reyes, A. Dosio, H. Douville, F. Engelbrecht, V. Eyring, E. Fischer, P. Forster, B. Fox-Kemper, J.S. Fuglestvedt, J.C. Fyfe, et al. 2021: Technical Summary. In Climate Change 2021: The Physical Science Basis. Contribution of Working Group I to the Sixth Assessment Report of the Intergovernmental Panel on Climate Change [Masson-Delmotte, V., P. Zhai, A. Pirani, S.L. Connors, C. Péan, S. Berger, N. Caud, Y. Chen, L. Goldfarb, M.I. Gomis, M. Huang, K. Leitzell, E. Lonnoy, J.B.R. Matthews, T.K. Maycock, T. Waterfield, O. Yelekçi, R. Yu, and B. Zhou (eds.)]. Cambridge University Press, Cambridge, United Kingdom and New York, NY, USA, pp. 33−144. doi:10.1017/9781009157896.002.
12Mauritsen, Thorsten; Tsushima, Yoko; Meyssignac, Benoit; Loeb, Normal G.; etal. (10 May 2025). "Earth's Energy Imbalance More Than Doubled in Recent Decades". AGU Advances. 6. American Geophysical Union: e2024AV001636. doi:10.1029/2024AV001636. The imbalance is derived from the CERES-EBAF Edition 4.2.1 data set.
↑Loeb, Norman G.; Lyman, John M.; Johnson, Gregory C.; Allan, Richard P.; etal. (22 January 2012). "Observed changes in top-of-the-atmosphere radiation and upper-ocean heating consistent within uncertainty". Nature Geoscience. 5 (2): 110–113. Bibcode:2012NatGe...5..110L. doi:10.1038/ngeo1375.
↑Hansen, James; Sato, Makiko; Kharecha, Pushker; von Schuckmann, Karina (January 2012). "Earth's Energy Imbalance". NASA. Archived from the original on 4 February 2012.
This page is based on this Wikipedia article Text is available under the CC BY-SA 4.0 license; additional terms may apply. Images, videos and audio are available under their respective licenses.