Energy return on investment

Last updated

In energy economics and ecological energetics, energy return on investment (EROI), also sometimes called energy returned on energy invested (ERoEI), is the ratio of the amount of usable energy (the exergy ) delivered from a particular energy resource to the amount of exergy used to obtain that energy resource. [1]

Contents

Arithmetically the EROI can be defined as:

. [2]

When the EROI of a source of energy is less than or equal to one, that energy source becomes a net "energy sink", and can no longer be used as a source of energy. A related measure, called energy stored on energy invested (ESOEI), is used to analyse storage systems. [3] [4]

To be considered viable as a prominent fuel or energy source a fuel or energy must have an EROI ratio of at least 3:1. [5] [2]

History

The energy analysis field of study is credited with being popularized by Charles A. S. Hall, a Systems ecology and biophysical economics professor at the State University of New York. Hall applied the biological methodology, developed at an Ecosystems Marine Biological Laboratory, and then adapted that method to research human industrial civilization. The concept would have its greatest exposure in 1984, with a paper by Hall that appeared on the cover of the journal Science. [6] [7]

Application to various technologies

Photovoltaic

Global PV market by technology in 2013. [8] :18,19

   multi-Si (54.9%)
   mono-Si (36.0%)
   CdTe (5.1%)
   a-Si (2.0%)
   CIGS (2.0%)

The issue is still subject of numerous studies, and prompting academic argument. That's mainly because the "energy invested" critically depends on technology, methodology, and system boundary assumptions, resulting in a range from a maximum of 2000 kWh/m2 of module area down to a minimum of 300 kWh/m2 with a median value of 585 kWh/m2 according to a meta-study from 2013. [9]

Regarding output, it obviously depends on the local insolation, not just the system itself, so assumptions have to be made.

Some studies (see below) include in their analysis that photovoltaic produce electricity, while the invested energy may be lower grade primary energy.

A 2015 review in Renewable and Sustainable Energy Reviews assessed the energy payback time and EROI of a variety of PV module technologies. In this study, which uses an insolation of 1700 kWh/m2/yr and a system lifetime of 30 years, mean harmonized EROIs between 8.7 and 34.2 were found. Mean harmonized energy payback time varied from 1.0 to 4.1 years. [10] [ better source needed ] In 2021, the Fraunhofer Institute for Solar Energy Systems calculated an energy payback time of around 1 year for European PV installations (0.9 years for Catania in Southern Italy, 1.1 years for Brussels) with wafer-based silicon PERC cells. [11]

Wind turbines

In the scientific literature EROIs wind turbines is around 16 unbuffered and 4 buffered. [12] Data collected in 2018 found that the EROI of operational wind turbines averaged 19.8 with high variability depending on wind conditions and wind turbine size. [13] EROIs tend to be higher for recent wind turbines compared to older technology wind turbines. Vestas reports an EROI of 31 for its V150 model wind turbine. [14]

Hydropower plants

The EROI for hydropower plants averages to about 110 when it is run for about 100 years. [15]

Oil sands

Because much of the energy required for producing oil from oil sands (bitumen) comes from low value fractions separated out by the upgrading process, there are two ways to calculate EROI, the higher value given by considering only the external energy inputs and the lower by considering all energy inputs, including self generated. One study found that in 1970 oil sands net energy returns was about 1.0 but by 2010 had increased to about 5.23. [16] [ clarification needed ]

Conventional oil

Conventional sources of oil have a rather large variation depending on various geologic factors. The EROI for refined fuel from conventional oil sources varies from around 18 to 43. [17]

Oil Shale

Due to the process heat input requirements for oil shale harvesting, the EROI is low. Typically natural gas is used, either directly combusted for process heat or used to power an electricity generating turbine, which then uses electrical heating elements to heat the underground layers of shale to produce oil from the kerogen. Resulting EROI is typically around 1.4-1.5. [17] Economically, oil shale might be viable due to the effectively free natural gas on site used for heating the kerogen, but opponents have debated that the natural gas could be extracted directly and used for relatively inexpensive transportation fuel rather than heating shale for a lower EROI and higher carbon emissions.

Oil liquids

The weighted average standard EROI of all oil liquids (including coal-to-liquids, gas-to-liquids, biofuels, etc.) is expected to decrease from 44.4 in 1950 to a plateau of 6.7 in 2050. [18]

Natural gas

The standard EROI for natural gas is estimated to decrease from 141.5 in 1950 to an apparent plateau of 16.8 in 2050. [19]

Nuclear plants

The EROI for nuclear plants ranges from 43 to 81. [20]

Non-manmade energy inputs

The natural or primary energy sources are not included in the calculation of energy invested, only the human-applied sources. For example, in the case of biofuels the solar insolation driving photosynthesis is not included, and the energy used in the stellar synthesis of fissile elements is not included for nuclear fission. The energy returned includes only human usable energy and not wastes such as waste heat.

Nevertheless, heat of any form can be counted where it is actually used for heating. However the use of waste heat in district heating and water desalination in cogeneration plants is rare, and in practice it is often excluded in EROI analysis of energy sources.[ clarification needed ]

Competing methodology

In a 2010 paper by Murphy and Hall, the advised extended ["Ext"] boundary protocol, for all future research on EROI, was detailed. In order to produce, what they consider, a more realistic assessment and generate greater consistency in comparisons, than what Hall and others view as the "weak points" in a competing methodology. [21] In more recent years, however, a source of continued controversy is the creation of a different methodology endorsed by certain members of the IEA which for example most notably in the case of photovoltaic solar panels, controversially generates more favorable values. [22] [23]

In the case of photovoltaic solar panels, the IEA method tends to focus on the energy used in the factory process alone. In 2016, Hall observed that much of the published work in this field is produced by advocates or persons with a connection to business interests among the competing technologies, and that government agencies had not yet provided adequate funding for rigorous analysis by more neutral observers. [24] [25]

Relationship to net energy gain

EROI and Net energy (gain) measure the same quality of an energy source or sink in numerically different ways. Net energy describes the amounts, while EROI measures the ratio or efficiency of the process. They are related simply by

or

For example, given a process with an EROI of 5, expending 1 unit of energy yields a net energy gain of 4 units. The break-even point happens with an EROI of 1 or a net energy gain of 0. The time to reach this break-even point is called energy payback period (EPP) or energy payback time (EPBT). [26] [27]

Economic influence

Although many qualities of an energy source matter (for example oil is energy-dense and transportable, while wind is variable), when the EROI of the main sources of energy for an economy fall that energy becomes more difficult to obtain and its relative price may increase.

In regard to fossil fuels, when oil was originally discovered, it took on average one barrel of oil to find, extract, and process about 100 barrels of oil. The ratio, for discovery of fossil fuels in the United States, has declined steadily over the last century from about 1000:1 in 1919 to only 5:1 in the 2010s. [2]

Since the invention of agriculture, humans have increasingly used exogenous sources of energy to multiply human muscle-power. Some historians have attributed this largely to more easily exploited (i.e. higher EROI) energy sources, which is related to the concept of energy slaves. Thomas Homer-Dixon [28] argues that a falling EROI in the Later Roman Empire was one of the reasons for the collapse of the Western Empire in the fifth century CE. In "The Upside of Down" he suggests that EROI analysis provides a basis for the analysis of the rise and fall of civilisations. Looking at the maximum extent of the Roman Empire, (60 million) and its technological base the agrarian base of Rome was about 1:12 per hectare for wheat and 1:27 for alfalfa (giving a 1:2.7 production for oxen). One can then use this to calculate the population of the Roman Empire required at its height, on the basis of about 2,500–3,000 calories per day per person. It comes out roughly equal to the area of food production at its height. But ecological damage (deforestation, soil fertility loss particularly in southern Spain, southern Italy, Sicily and especially north Africa) saw a collapse in the system beginning in the 2nd century, as EROI began to fall. It bottomed in 1084 when Rome's population, which had peaked under Trajan at 1.5 million, was only 15,000.

Evidence also fits the cycle of Mayan and Cambodian collapse too. Joseph Tainter [29] suggests that diminishing returns of the EROI is a chief cause of the collapse of complex societies, which has been suggested as caused by peak wood in early societies. Falling EROI due to depletion of high quality fossil fuel resources also poses a difficult challenge for industrial economies, and could potentially lead to declining economic output and challenge the concept (which is very recent when considered from a historical perspective) of perpetual economic growth. [30]

Criticism of EROI

Measuring energy output is a solved problem; measuring the input remains highly debated. Hydro quebec meter.JPG
Measuring energy output is a solved problem; measuring the input remains highly debated.

EROI is calculated by dividing the energy output by the energy input. Measuring total energy output is often easy, especially in the case for an electrical output where some appropriate electricity meter can be used. However, researchers disagree on how to determine energy input accurately and therefore arrive at different numbers for the same source of energy. [31]

How deep should the probing in the supply chain of the tools being used to generate energy go? For example, if steel is being used to drill for oil or construct a nuclear power plant, should the energy input of the steel be taken into account? Should the energy input into building the factory being used to construct the steel be taken into account and amortized? Should the energy input of the roads which are used to ferry the goods be taken into account? What about the energy used to cook the steelworkers' breakfasts? These are complex questions evading simple answers. [32] A full accounting would require considerations of opportunity costs and comparing total energy expenditures in the presence and absence of this economic activity.

However, when comparing two energy sources a standard practice for the supply chain energy input can be adopted. For example, consider the steel, but don't consider the energy invested in factories deeper than the first level in the supply chain. It is in part for these fully encompassed systems reasons, that in the conclusions of Murphy and Hall's paper in 2010, an EROI of 5 by their extended methodology is considered necessary to reach the minimum threshold of sustainability, [21] while a value of 12–13 by Hall's methodology is considered the minimum value necessary for technological progress and a society supporting high art. [22] [23]

Richards and Watt propose an Energy Yield Ratio for photovoltaic systems as an alternative to EROI (which they refer to as Energy Return Factor). The difference is that it uses the design lifetime of the system, which is known in advance, rather than the actual lifetime. This also means that it can be adapted to multi-component systems where the components have different lifetimes. [33]

Another issue with EROI that many studies attempt to tackle is that the energy returned can be in different forms, and these forms can have different utility. For example, electricity can be converted more efficiently than thermal energy into motion, due to electricity's lower entropy. In addition, the form of energy of the input can be completely different from the output. For example, energy in the form of coal could be used in the production of ethanol. This might have an EROI of less than one, but could still be desirable due to the benefits of liquid fuels (assuming the latters are not used in the processes of extraction and transformation).

Additional EROI calculations

There are three prominent expanded EROI calculations, they are point of use, extended and societal. Point of Use EROI expands the calculation to include the cost of refining and transporting the fuel during the refining process. Since this expands the bounds of the calculation to include more production process EROI will decrease. [2] Extended EROI includes point of use expansions as well as including the cost of creating the infrastructure needed for transportation of the energy or fuel once refined. [34] Societal EROI is a sum of all the EROIs of all the fuels used in a society or nation. A societal EROI has never been calculated and researchers believe it may currently be impossible to know all variables necessary to complete the calculation, but attempted estimates have been made for some nations. Calculations are done by summing all of the EROIs for domestically produced and imported fuels and comparing the result to the Human Development Index (HDI), a tool often used to understand well-being in a society. [35] According to this calculation, the amount of energy a society has available to them increases the quality of life for the people living in that country, and countries with less energy available also have a harder time satisfying citizens' basic needs. [36] This is to say that societal EROI and overall quality of life are very closely linked.

EROI and payback periods of some types of power plants

The following table is a compilation of sources of energy from German Wikipedia. The minimum requirement is a breakdown of the cumulative energy expenses according to material data. Frequently in literature harvest factors are reported, for which the origin of the values is not completely transparent. These are not included in this table.

The bold numbers are those given in the respective literature source, the normal printed ones are derived (see Mathematical Description).

TypeEROIAmortization periodAmortization period compared to an 'ideal' power station
EROIAmortization period
Nuclear power (a)
Pressurized water reactor, 100% Centrifuge enrichment  [ de ] [37] 1062 Months[ failed verification ]315 [ failed verification ]17 Days [ failed verification ]
Pressurized water reactor, 83% Centrifuge enrichment  [ de ] [37] 752 Months[ failed verification ]220 [ failed verification ]17 Days [ failed verification ]
Fossil energy (a)
Brown coal, Open-cast [37] 312 Months[ failed verification ]90 [ failed verification ]23 Days [ failed verification ]
Black coal, underground mining without coal transportation [37] 292 Months[ failed verification ]84 [ failed verification ]19 Days [ failed verification ]
Gas (CCGT), Natural gas [37] 289 Days[ failed verification ]81 [ failed verification ]3 Days [ failed verification ]
Gas (CCGT), Bio gas [37] 3.512 Days[ failed verification ]10 [ failed verification ]3 Days [ failed verification ]
Hydropower
River hydroelectric [37] 501 Year[ failed verification ]150 [ failed verification ]8 Months [ failed verification ]
Solar thermal (b)
Desert, parabolic troughs + phenyl compounds medium [37] 211.1 Years[ failed verification ]62 [ failed verification ]4 Months [ failed verification ]
Wind energy (b)
1,5 MW (E-66  [ de ]), 2000 Full load hours VLh  [ de ] (German coast) [37] 161.2 Years[ failed verification ]48 [ failed verification ]5 Months [ failed verification ]
1,5 MW (E-66  [ de ]), 2700 Full load hours VLh  [ de ] (German coast), shore) [38] 21 [ failed verification ]0.9 Years [ failed verification ]63[ failed verification ]3.7 Months[ failed verification ]
2,3 MW (E-82  [ de ]), 3200 Full load hours VLh  [ de ] (German coast), shore) [39] [40] (c)51[ failed verification ]4.7 Months[ failed verification ]150 [ failed verification ]1.6 Months [ failed verification ]
200 MW park (5 MW installation), 4400 Full load hours VLh  [ de ] (offshore) [41] 161.2 Years [ failed verification ]48 [ failed verification ]5 Months[ failed verification ]
Photovoltaics (b)
Poly-silicon, roof installation, 1000 Full load hours VLh  [ de ] (South Germany) [37] 4.06 Years[ failed verification ]12 [ failed verification ]2 Years [ failed verification ]
Poly-silicon, roof installation, 1800 Full load hours VLh  [ de ] (South Europe) [42] 7.03.3 Years [ failed verification ]21 [ failed verification ]1.1 Years[ failed verification ]
(a) The cost of fuel transportation is taken into account
(b) The values refer to the total energy output. The expense for storage power plants, seasonal reserves or conventional load balancing power plants is not taken into account.
(c) The data for the E-82 come from the manufacturer, but are confirmed by TÜV Rheinland.[ citation needed ]

ESOEI

ESOEI (or ESOIe) is used when EROI is below 1. "ESOIe is the ratio of electrical energy stored over the lifetime of a storage device to the amount of embodied electrical energy required to build the device." [4]

Storage TechnologyESOEI [4]
Lead acid battery 5
Zinc bromide battery 9
Vanadium redox battery 10
NaS battery 20
Lithium ion battery 32
Pumped hydroelectric storage 704
Compressed air energy storage 792

One of the notable outcomes of the Stanford University team's assessment on ESOI, was that if pumped storage was not available, the combination of wind energy and the commonly suggested pairing with battery technology as it presently exists, would not be sufficiently worth the investment, suggesting instead curtailment. [43]

EROI under rapid growth

A related recent concern is energy cannibalism where energy technologies can have a limited growth rate if climate neutrality is demanded. Many energy technologies are capable of replacing significant volumes of fossil fuels and concomitant green house gas emissions. Unfortunately, neither the enormous scale of the current fossil fuel energy system nor the necessary growth rate of these technologies is well understood within the limits imposed by the net energy produced for a growing industry. This technical limitation is known as energy cannibalism and refers to an effect where rapid growth of an entire energy producing or energy efficiency industry creates a need for energy that uses (or cannibalizes) the energy of existing power plants or production plants. [44]

The solar breeder overcomes some of these problems. A solar breeder is a photovoltaic panel manufacturing plant which can be made energy-independent by using energy derived from its own roof using its own panels. Such a plant becomes not only energy self-sufficient but a major supplier of new energy, hence the name solar breeder. Research on the concept was conducted by Centre for Photovoltaic Engineering, University of New South Wales, Australia. [45] [46] The reported investigation establishes certain mathematical relationships for the solar breeder which clearly indicate that a vast amount of net energy is available from such a plant for the indefinite future. [47] The solar module processing plant at Frederick, Maryland [48] was originally planned as such a solar breeder. In 2009 the Sahara Solar Breeder Project was proposed by the Science Council of Japan as a cooperation between Japan and Algeria with the highly ambitious goal of creating hundreds of GW of capacity within 30 years. [49]

See also

Related Research Articles

<span class="mw-page-title-main">Renewable energy</span> Energy collected from renewable resources

Renewable energy, green energy, or low-carbon energy is energy from renewable resources that are naturally replenished on a human timescale. Renewable resources include sunlight, wind, the movement of water, and geothermal heat. Although most renewable energy sources are sustainable, some are not. For example, some biomass sources are considered unsustainable at current rates of exploitation. Renewable energy is often used for electricity generation, heating and cooling. Renewable energy projects are typically large-scale, but they are also suited to rural and remote areas and developing countries, where energy is often crucial in human development.

<span class="mw-page-title-main">Distributed generation</span> Decentralised electricity generation

Distributed generation, also distributed energy, on-site generation (OSG), or district/decentralized energy, is electrical generation and storage performed by a variety of small, grid-connected or distribution system-connected devices referred to as distributed energy resources (DER).

<span class="mw-page-title-main">Photovoltaics</span> Method to produce electricity from solar radiation

Photovoltaics (PV) is the conversion of light into electricity using semiconducting materials that exhibit the photovoltaic effect, a phenomenon studied in physics, photochemistry, and electrochemistry. The photovoltaic effect is commercially used for electricity generation and as photosensors.

<span class="mw-page-title-main">Solar Energy Generating Systems</span> Concentrated solar thermal power station in the Mojave Desert of California

Solar Energy Generating Systems (SEGS) is a concentrated solar power plant in California, United States. With the combined capacity from three separate locations at 354 megawatt (MW), it was once the world's second largest solar thermal energy generating facility, until the commissioning of the even larger Ivanpah facility in 2014. It consisted of nine solar power plants in California's Mojave Desert, where insolation is among the best available in the United States.

Net Energy Gain (NEG) is a concept used in energy economics that refers to the difference between the energy expended to harvest an energy source and the amount of energy gained from that harvest. The net energy gain, which can be expressed in joules, differs from the net financial gain that may result from the energy harvesting process, in that various sources of energy can be priced differently for the same amount of energy.

<span class="mw-page-title-main">Renewable energy commercialization</span> Deployment of technologies harnessing easily replenished natural resources

Renewable energy commercialization involves the deployment of three generations of renewable energy technologies dating back more than 100 years. First-generation technologies, which are already mature and economically competitive, include biomass, hydroelectricity, geothermal power and heat. Second-generation technologies are market-ready and are being deployed at the present time; they include solar heating, photovoltaics, wind power, solar thermal power stations, and modern forms of bioenergy. Third-generation technologies require continued R&D efforts in order to make large contributions on a global scale and include advanced biomass gasification, hot-dry-rock geothermal power, and ocean energy. In 2019, nearly 75% of new installed electricity generation capacity used renewable energy and the International Energy Agency (IEA) has predicted that by 2025, renewable capacity will meet 35% of global power generation.

For solar power, South Asia has the ideal combination of both high solar insolation and a high density of potential customers.

<span class="mw-page-title-main">Solar power in Germany</span>

Solar power accounted for an estimated 10.7% electricity in Germany in 2022, up from 1.9% in 2010 and less than 0.1% in 2000.

<span class="mw-page-title-main">Renewable energy in Africa</span> Renewable energy in Africa

The developing nations of Africa are popular locations for the application of renewable energy technology. Currently, many nations already have small-scale solar, wind, and geothermal devices in operation providing energy to urban and rural populations. These types of energy production are especially useful in remote locations because of the excessive cost of transporting electricity from large-scale power plants. The applications of renewable energy technology has the potential to alleviate many of the problems that face Africans every day, especially if done in a sustainable manner that prioritizes human rights.

<span class="mw-page-title-main">Solar power</span> Conversion of energy from sunlight into electricity

Solar power, also known as solar electricity, is the conversion of energy from sunlight into electricity, either directly using photovoltaics (PV) or indirectly using concentrated solar power. Solar panels use the photovoltaic effect to convert light into an electric current. Concentrated solar power systems use lenses or mirrors and solar tracking systems to focus a large area of sunlight to a hot spot, often to drive a steam turbine.

<span class="mw-page-title-main">Low-carbon electricity</span> Power produced with lower carbon dioxide emissions

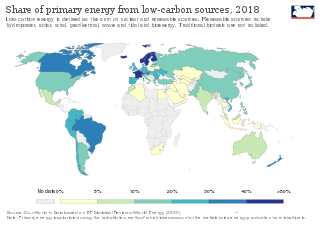
Low-carbon electricity or low-carbon power is electricity produced with substantially lower greenhouse gas emissions over the entire lifecycle than power generation using fossil fuels. The energy transition to low-carbon power is one of the most important actions required to limit climate change.

<span class="mw-page-title-main">Solar power in the United States</span>

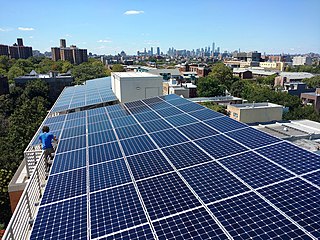
Solar power includes solar farms as well as local distributed generation, mostly on rooftops and increasingly from community solar arrays. In 2023, utility-scale solar power generated 164.5 terawatt-hours (TWh), or 3.9% of electricity in the United States. Total solar generation that year, including estimated small-scale photovoltaic generation, was 238 TWh.

A photovoltaic system, also called a PV system or solar power system, is an electric power system designed to supply usable solar power by means of photovoltaics. It consists of an arrangement of several components, including solar panels to absorb and convert sunlight into electricity, a solar inverter to convert the output from direct to alternating current, as well as mounting, cabling, and other electrical accessories to set up a working system. It may also use a solar tracking system to improve the system's overall performance and include an integrated battery.

Energy cannibalism refers to an effect where rapid growth of a specific energy producing industry creates a need for energy that uses the energy of existing power plants. Thus during rapid growth the industry as a whole produces no new energy because it is used to fuel the embodied energy of future power plants.

Different methods of electricity generation can incur a variety of different costs, which can be divided into three general categories: 1) wholesale costs, or all costs paid by utilities associated with acquiring and distributing electricity to consumers, 2) retail costs paid by consumers, and 3) external costs, or externalities, imposed on society.

<span class="mw-page-title-main">Renewable energy debate</span>

Policy makers often debate the constraints and opportunities of renewable energy.

<span class="mw-page-title-main">Energy in Malta</span> Energy production, consumption and import in Malta

Energy in Malta describes energy production, consumption and import in Malta. Malta has no domestic resource of fossil fuels and no gas distribution network, and relies overwhelmingly on imports of fossil fuels and electricity to cover its energy needs. Since 2015, the Malta–Sicily interconnector allows Malta to be connected to the European power grid and import a significant share of its electricity.

<span class="mw-page-title-main">Energy in Greece</span> Overview of the production, consumption, import and export of energy and electricity in Greece

Energy in Greece is dominated by fossil gas and oil. Electricity generation is dominated by the one third state owned Public Power Corporation. In 2009 DEI supplied for 85.6% of all electric energy demand in Greece, while the number fell to 77.3% in 2010. Almost half (48%) of DEI's power output in 2010 was generated using lignite. 12% of Greece's electricity comes from hydroelectric power plants and another 20% from natural gas. Between 2009 and 2010, independent companies' energy production increased by 56%, from 2,709 Gigawatt hour in 2009 to 4,232 GWh in 2010.

<span class="mw-page-title-main">Solar power in Italy</span>

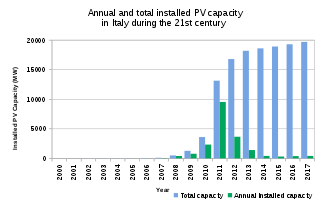
Solar power is an important contributor to electricity generation in Italy, accounting for 8% of the total in 2017. As of 2022, the country has a total installed capacity of 22.56 GW. In 2019, Italy set a national goal of reaching 50 GW by 2030.

<span class="mw-page-title-main">Renewable energy in South Africa</span>

Renewable energy in South Africa is energy generated in South Africa from renewable resources, those that naturally replenish themselves—such as sunlight, wind, tides, waves, rain, biomass, and geothermal heat. Renewable energy focuses on four core areas: electricity generation, air and water heating/cooling, transportation, and rural energy services. The energy sector in South Africa is an important component of global energy regimes due to the country's innovation and advances in renewable energy. South Africa's greenhouse gas (GHG) emissions is ranked as moderate and its per capita emission rate is higher than the global average. Energy demand within the country is expected to rise steadily and double by 2025.

References

  1. Murphy, D.J.; Hall, C.A.S. (2010). "Year in review EROI or energy return on (energy) invested". Annals of the New York Academy of Sciences. 1185 (1): 102–118. Bibcode:2010NYASA1185..102M. doi:10.1111/j.1749-6632.2009.05282.x. PMID   20146764. S2CID   6433639.
  2. 1 2 3 4 Hall, CA; Lambert, JG; Balogh, SB (2013). "EROI of different fuels and the implications for society". Energy Policy. 64: 141–52. doi: 10.1016/j.enpol.2013.05.049 .
  3. "Why energy storage is a dead-end industry - Energy Storage Report". 15 October 2014.
  4. 1 2 3 Barnhart, Charles J.; Dale, Michael; Brandt, Adam R.; Benson, Sally M. (2013). "The energetic implications of curtailing versus storing solar- and wind-generated electricity". Energy Environ. Sci. 6 (10): 2804–10. doi: 10.1039/c3ee41973h .
  5. Atlason, R; Unnthorsson, R (2014). "Ideal EROI (energy return on investment) deepens the understanding of energy systems". Energy. 67: 241–45. doi:10.1016/j.energy.2014.01.096.
  6. "Will Fossil Fuels be Able to Maintain Economic Growth? A Q&A with Charles Hall". Scientific American . April 2013.
  7. N.Y. Times article featuring Hall Retrieved November-3-09
  8. "Photovoltaics Report" (PDF). Fraunhofer ISE. July 28, 2014. Archived (PDF) from the original on July 25, 2014. Retrieved August 31, 2014.
  9. Dale, M.; et al. (2013). "Energy balance of the global photovoltaic (PV) industry -- is the PV industry a net electricity producer?. In". Environmental Science and Technology. 47 (7): 3482–3489. Bibcode:2013EnST...47.3482D. doi:10.1021/es3038824. PMID   23441588.
  10. Bhandari; et al. (2015). "Energy payback time (EPBT) and energy return on energy invested (EROI) of solar photovoltaic systems: A systematic review and meta-analysis. In". Renewable and Sustainable Energy Reviews . 47: 133–141. doi:10.1016/j.rser.2015.02.057.
  11. Fraunhofer Institut (2022), Photovoltaics Report, page 37, https://www.ise.fraunhofer.de/content/dam/ise/de/documents/publications/studies/Photovoltaics-Report.pdf
  12. "Energy intensities, EROIs, and energy payback times of electricity generating power plants" (PDF). Festkoerper-kernphysik.de. Retrieved July 26, 2022.
  13. "Meta-Analysis of Net Energy Return for Wind Power Systems". Researchgate.net.
  14. "Archived copy" (PDF). Archived from the original (PDF) on 2020-10-21. Retrieved 2020-10-20.{{cite web}}: CS1 maint: archived copy as title (link)
  15. Atlason, R. S.; Unnthorsson, R. (2014-06-01). "Energy return on investment of hydroelectric power generation calculated using a standardised methodology". Renewable Energy. 66: 364–370. doi:10.1016/j.renene.2013.12.029. ISSN   0960-1481 . Retrieved 2024-02-27.
  16. Brandt, A. R.; Englander, J.; Bharadwaj, S. (2013). "The energy efficiency of oil sands extraction: Energy return ratios from 1970 to 2010". Energy. 55: 693–702. doi:10.1016/j.energy.2013.03.080.
  17. 1 2 "An Assessment of Energy Return on Investment of Oil Shale". Western Resource Advocates. Retrieved 2020-04-21.
  18. Delannoy, Louis; Longaretti, Pierre-Yves; Murphy, David J.; Prados, Emmanuel (December 2021). "Peak oil and the low-carbon energy transition: A net-energy perspective". Applied Energy. 304: 117843. Bibcode:2021ApEn..30417843D. doi: 10.1016/j.apenergy.2021.117843 . S2CID   240530798.
  19. Delannoy, Louis; Longaretti, Pierre-Yves; Murphy, David J.; Prados, Emmanuel (January 2021). "Assessing Global Long-Term EROI of Gas: A Net-Energy Perspective on the Energy Transition". Energies. 14 (16): 5112. doi: 10.3390/en14165112 .
  20. "Energy Return on Investment - World Nuclear Association" . Retrieved 2024-02-27.
  21. 1 2 Ferroni, Ferruccio; Hopkirk, Robert J. (2016). "Energy Return on Energy Invested (ERoEI) for photovoltaic solar systems in regions of moderate insolation". Energy Policy. 94: 336–344. doi: 10.1016/j.enpol.2016.03.034 .
  22. 1 2 Fairley, Peter (30 August 2012). "Argument Over the Value of Solar Focuses on Spain: Analysts disagree on whether the energy returned from solar is worth the energy invested". IEEE Spectrum: Technology, Engineering, and Science News.
  23. 1 2 Pickard, William F. (2014). "Energy return on energy invested (eroi): A quintessential but possibly inadequate metric for sustainability in a solar-powered world? [point of view]". Proceedings of the IEEE. 102 (8): 1118–1122. doi: 10.1109/JPROC.2014.2332092 .
  24. "The Real EROI of Photovoltaic Systems: Professor Hall Weighs in". Resilience. May 27, 2016.
  25. Hall, Charles (2016-05-26). "The real EROI of photovoltaic systems: professor Hall weighs in". Cassandra's Legacy. Ugo Bardi.
  26. Marco Raugei; Pere Fullana-i-Palmer; Vasilis Fthenakis (March 2012). "The Energy Return on Energy Investment (EROI) of Photovoltaics: Methodology and Comparisons with Fossil Fuel Life Cycles" (PDF). Brookhaven National Laboratory. Archived (PDF) from the original on 8 March 2016.
  27. Ibon Galarraga, M. González-Eguino, Anil Markandya (1 January 2011). Handbook of Sustainable Energy. Edward Elgar Publishing. p. 37. ISBN   978-0857936387 . Retrieved 9 May 2017 via Google Books.{{cite book}}: CS1 maint: multiple names: authors list (link)
  28. Homer-Dixon, Thomas (2007). The Upside of Down; Catastrophe, Creativity and the Renewal of Civilisation. Island Press. ISBN   978-1-59726-630-7.
  29. Tainter, Joseph (1990). The Collapse of Complex Societies. Cambridge University Press. ISBN   978-0521386739.
  30. Morgan, Tim (2013). Life After Growth. Petersfield, UK: Harriman House. ISBN   9780857193391.
  31. Mason Inman. Behind the Numbers on Energy Return on Investment. Scientific American, April 1, 2013. Archive
  32. Richards, Michael; Hall, Charles (2014). "Does a Change in Price of Fuel Affect GDP Growth? An Examination of the US Data from 1950–2013". Energies. 7 (10): 6558–6570. doi: 10.3390/en7106558 .
  33. Richards, B.S.; Watt, M.E. (2006). "Permanently dispelling a myth of photovoltaics via the adoption of a new net energy indicator" (PDF). Renewable and Sustainable Energy Reviews. 11: 162–172. doi:10.1016/j.rser.2004.09.015.
  34. Hall CA, Lambert JG, Balogh SB. 2013. EROEI of different fuels and the implications for society. Energy Policy. 141–52
  35. Lambert JG, Hall CA, Balogh S, Gupta A, Arnold M. 2014. Energy, EROI and quality of life. Energy Policy.
  36. Lambert JG, Hall CA, Balogh S, Gupta A, Arnold M. 2014. Energy, EROI and quality of life. Energy Policy. 153–67 & Arvesen A, Hertwich EG. 2014. More caution is needed when using life cycle assessment to determine energy return on investment (EROI). Energy Policy. 1–6
  37. 1 2 3 4 5 6 7 8 9 10 D. Weißbach et al. (2013): Energy intensities, EROIs (energy returned on invested), and energy payback times of electricity generating power plants. Energy, Band 52, S. 210 ff. doi : 10.1016/j.energy.2013.01.029
  38. E. Pick, Hermann-Josef Wagner: Beitrag zum kumulierten Energieaufwand ausgewählter Windenergiekonverter. Arbeitsbericht des Instituts für ökologisch verträgliche Energiewirtschaft, Universität Essen, 1998.
  39. Mehr Windkraft an Land rückt Ökologie ins Blickfeld Archived 2011-10-09 at the Wayback Machine . In: vdi Nachrichten. 2 September 2011. Retrieved 17 September 2011.
  40. Enercon Windblatt 4/2011 (PDF; 1,2 MB). Internetseite von Enercon. Retrieved 10 January 2012.
  41. Rodoula Tryfonidou, Hermann-Josef Wagner: Offshore-Windkraft – Technikauswahl und aggregierte Ergebnisdarstellung. (Kurzfassung Archived 2007-02-08 at the Wayback Machine , PDF-Datei, 109 kB) Lehrstuhl für Energiesysteme und Energiewirtschaft, Ruhr-Universität, Bochum 2004.
  42. Mariska de Wild-Scholten: Environmental profile of PV mass production: globalization. (PDF; 1,8 MB) 2011.
  43. Report, Energy Storage (October 15, 2014). "Why energy storage is a dead-end industry". Energy Storage Report.
  44. Pearce, J.M. (2008). "Limitations of Greenhouse Gas Mitigation Technologies Set by Rapid Growth and Energy Cannibalism". Klima. Archived from the original on 2009-08-17. Retrieved 2011-04-06.
  45. "The Azimuth Project: Solar Breeder". Archived from the original on 2013-05-28. Retrieved 2011-04-06.
  46. Lindmayer, Joseph (1978). The solar breeder. Proceedings, Photovoltaic Solar Energy Conference, Luxembourg, September 27–30, 1977. Dordrecht: D. Reidel Publishing. pp. 825–835. Bibcode:1978pvse.conf..825L. ISBN   9027708894. OCLC   222058767.
  47. Lindmayer, Joseph (1977). The Solar Breeder. NASA.
  48. "The BP Solarex Facility Tour in Frederick, MD". Sustainable Cooperative for Organic Development. 2010-03-29. Retrieved 28 February 2013.
  49. Koinuma, H.; Kanazawa, I.; Karaki, H.; Kitazawa, K. (Mar 26, 2009). Sahara solar breeder plan directed toward global clean energy superhighway. G8+5 Academies' meeting in Rome. Science Council of Japan.