Environmental Vulnerability Index

Last updated

The Environmental Vulnerability Index (EVI) is a measurement devised by the South Pacific Applied Geoscience Commission (SOPAC), the United Nations Environment Program and others [1] to characterize the relative severity of various types of environmental issues suffered by 243 enumerated individual nations and other geographies (such as Antarctica). The results of the EVI are used to focus on planned solutions to negative pressures on the environment, whilst promoting sustainability.

Contents

Development

The beginning stages of the Environmental Vulnerability Index (EVI) were developed to be appropriate for Small Island Developing States (SIDs), this theoretical idea at the time was presented by the South Pacific Applied Geoscience Commission (SOPAC) on February 4, 1999. The ideas and plans for The Environmental Vulnerability Index were worked on further with the creation of a (EVI) Think Tank that took place from September 7–10, 1999 in Pacific Harbour, Fiji. Expanding the (EVI) to other SIDS was aided by a meeting of experts convened in Malta on November 29 – December 3, 1999 by (SOPAC) and the Foundation for International Studies (of the University of Malta's Islands and Small States Institute) with the support of the United Nations Environment Programme (UNEP).

During the second phase of the development, the Environmental Vulnerability Index (EVI) was tested in five different countries. A workshop was made to expand the application of the Environmental Vulnerability Index to a demonstrative set of countries from around the world. The workshop was hosted by UNEP in Geneva, Switzerland on August 27 – August 29, 2001. Continuation of work and development on The Environmental Vulnerability Index, lead to a presentation of the first functional results with the Demonstration EVI.

Calculation

To be able to calculate an Environmental Vulnerability Index it requires the compilation of relevant environmental vulnerability data for the 50 indicators. Once compiled then this data must be used to calculate each indicator. As the indicators are heterogeneous, include variables for which responses are numerical, qualitative and on different scales (linear, non-linear, or with different ranges) they are mapped onto a 1–7 vulnerability scale. Where data is not available, no value is given for the indicator and the denominator of the average adjusted down by one value. Where an indicator is considered 'non-applicable' in a country (such as volcanic eruptions in Tuvalu which has no volcanoes), the lowest vulnerability score of 1 is attributed to that indicator. The vulnerability scores for each indicator are then accumulated either into categories or sub-indices and the average calculated. An overall average of all indicators is calculated to generate the country EVI. The EVI is accumulated into three sub-indices: Hazards, Resistance, Damage

The 50 EVI indicators are also divided up in the issue categories for use as required: Climate change, Biodiversity, Water, Agriculture and fisheries, Human health aspects, Desertification, and Exposure to Natural Disasters.

Indicators

  1. High Winds – Average annual excess winds over the last five years (summing speeds on days during which the maximum recorded wind speed is greater than 20% higher than the 30 year average maximum wind speed for that month) averaged over all reference climate stations.
  2. Dry Periods – Average annual rainfall deficit (mm) over the past 5 years for all months with more than 20% lower rainfall than the 30 year monthly average, averaged over all reference climate stations.
  3. Wet Periods – Average annual excess rainfall (mm) over the past 5 years for all months with more than 20% higher rainfall than the 30 year monthly average, averaged over all reference climate stations
  4. Hot Periods – Average annual excess heat (degrees C) over the past 5 years for all days more than 5°C (9°F) hotter than the 30 year mean monthly maximum, averaged over all reference climate stations.
  5. Cold Periods – Average annual heat deficit (degrees C) over the past 5 years for all days more than 5°C (9°F) cooler than the 30 year mean monthly minimum, averaged overall reference climate stations.
  6. Sea Temperatures – Average annual deviation in Sea Surface Temperatures (SST) in the last 5 years in relation to the 30 year monthly means
  7. Volcanoes – Cumulative volcano risk as the weighted number of volcanoes with the potential for eruption greater than or equal to a Volcanic Explosively Index of 2 (VEI 2) within 100 km of the country land boundary (divided by the area of land).
  8. Earthquakes – Cumulative earthquake energy within 100 km of country land boundaries measured as Local Magnitude (ML) ≥ 6.0 and occurring at a depth of less than or equal to fifteen kilometers(≤15 km depth) over 5 years (divided by land area).
  9. Tsunamis – Number of tsunamis or storms surges with run-up greater than 2 meters above Mean High Water Spring tide (MHWS) per 1000 km coastline since 1900.
  10. Slides – Number of slides recorded in the last 5 years (EMDAT definitions), divided by land area
  11. Land Area – Total land area (km2)
  12. Country Dispersion – Ratio of length of borders (land and maritime) to total land area.
  13. Isolation – Distance to nearest continent (km)
  14. Relief – Altitude range (highest point subtracted from the lowest point in country)
  15. Lowlands – Percentage of land area less than or equal to 50m above sea level
  16. Borders – Number of land and sea borders (including EEZ shared with other countries.)
  17. Ecosystem Imbalance – Weighted average change in trophic level since fisheries began (for trophic level slice ≤
  18. Environmental Openness – Average annual USD freight imports over the past 5 years by any means per km2 land area
  19. Migrations – Number of known species that migrate outside the territorial area at any time during their life spans (including land and all aquatic species) / area of land
  20. Endemics – Number of known endemic species per million square kilometer land area
  21. Introductions – Number of introduced species per 1000 square kilometer of land area
  22. Endangered Species – Number of endangered and vulnerable species per 1000 km2 land area (IUCN definitions)
  23. Extinctions – Number of species known to have become extinct since 1900 per 1000 km2 land area (IUCN definitions)
  24. Vegetation Cover – Percentage of natural and regrowth vegetation cover remaining (include forests, wetlands, prairies, tundra, desert and alpine associations).
  25. Loss Of Cover – Net percentage change in natural vegetation cover over the last five years
  26. Habitat fragmentation – Total length of all roads in a country divided by land area.
  27. Degradation – Percent of land area that is either severely or very severely degraded (FAO/AGL Terrastat definitions)
  28. Terrestrial Reserves – Percent of terrestrial land area legally set aside as no take reserves
  29. Marine Reserves – Percentage of continental shelf legally designated as marine protected areas (MPAs).
  30. Intensive Farming – Annual tonnage of intensively farmed animal products (includes aquaculture, pigs, poultry) produced over the last five years per square kilometer land area.
  31. Fertilizers – Average annual intensity of fertilizer use over the total land area over the last 5 years.
  32. Pesticides – Average annual pesticides used as kg/km2/year over total land area over last 5 years.
  33. Biotechnology – Cumulative number of deliberate field trials of genetically modified organisms conducted in the country since 1986.
  34. Productivity Over-fishing – Average ratio of productivity : fisheries catch over the last 5 years
  35. Fishing Effort – Average annual number of fishers per kilometer of coastline over the last 5 years
  36. Renewable Water – Average annual water usage as percentage of renewable water resources over the last 5 years
  37. SO2 Emissions – Average annual SO2 emissions over the last 5 years.
  38. Generated and imported toxic, hazardous and municipal wastes per square kilometer land area over the last 5 years
  39. Waste Treatment – Mean annual percent of hazardous, toxic and municipal waste effectively managed and treated over the past 5 years.
  40. Industry – Average annual use of electricity for industry over the last 5 years per square kilometer of land
  41. Spills – Total number of spills of oil and hazardous substances greater than 1000 liters on land, in rivers or within territorial waters per million km maritime coast during the last five years
  42. Mining – Average annual mining production (include all surface and subsurface mining and quarrying) per km2 of land area over the past 5 years.
  43. Sanitation – Density of population without access to safe sanitation (WHO definitions)
  44. Vehicles – Number of vehicles per square kilometer of land area (most recent data)
  45. Population – Total human population density (number per km2 land area)
  46. Population Growth – Annual human population growth rate over the last 5 years
  47. Tourists Average annual number of international tourists per km2 land over the past 5 years.
  48. Coastal Settlements – Density of people living in coastal settlements, i.e. with a city center within 100 km of any maritime or lake* coast.
  49. Environmental Agreements – Number of environmental treaties in force in a country.
  50. Conflicts – Average number of conflict years per decade within the country over the past 50 years.

List

RankCountryIndexBracket
1Flag of France.svg  French Guiana 174Resilient
2Flag of the Sahrawi Arab Democratic Republic.svg  Western Sahara 175Resilient
3Flag of Botswana.svg  Botswana 181Resilient
4Flag of the Central African Republic.svg  Central African Republic 193Resilient
5Flag of Namibia.svg  Namibia 200Resilient
6Flag of Zimbabwe.svg  Zimbabwe 200Resilient
7Flag of Guyana.svg  Guyana 207Resilient
8Flag of Mongolia.svg  Mongolia 208Resilient
9Flag of Niger.svg  Niger 208Resilent
10Flag of Djibouti.svg  Djibouti 210Resilient
11Flag of Zambia.svg  Zambia 210Resilient
12Flag of Gabon.svg  Gabon 211Resilient
13Flag of Suriname.svg  Suriname 211Resilient
14Flag of Kazakhstan.svg  Kazakhstan 215At risk
15Flag of Mali.svg  Mali 215At risk
16Flag of Norway.svg  Svalbard 215At risk
17Flag of Chad.svg  Chad 217At risk
18Flag of the Republic of the Congo.svg  Congo 219At risk
19Flag of the Falkland Islands.svg  Falkland Islands 223At risk
20Flag of Mozambique.svg  Mozambique 225At risk
21Flag of Angola.svg  Angola 227At risk
22Flag of Cameroon.svg  Cameroon 229At risk
23Flag of Burkina Faso.svg  Burkina Faso 229At risk
24Flag of Qatar.svg  Qatar 229At risk
25Flag of Mauritania.svg  Mauritania 233At risk
26Flag of Kyrgyzstan (2023).svg  Kyrgyzstan 234At risk
27Blank flag.svg  Antarctica 235At risk
28Flag of Australia (converted).svg  Australia 238At risk
29Flag of Belarus.svg  Belarus 239At risk
30Flag of Equatorial Guinea.svg  Equatorial Guinea 243At risk
31Flag of Greenland.svg  Greenland 243At risk
32Flag of Laos.svg  Laos 243At risk
33Flag of Eswatini.svg  Swaziland 243At risk
34Flag of South Georgia and the South Sandwich Islands.svg  South Georgia and the South Sandwich Islands 245At risk
35Flag of Panama.svg  Panama 247At risk
36Flag of Armenia.svg  Armenia 247At risk
37Flag of the Bahamas.svg  Bahamas 248At risk
38Flag of Cote d'Ivoire.svg  Cote d'Ivoire 248At risk
39Flag of Turkmenistan.svg  Turkmenistan 249At risk
40Flag of Malawi.svg  Malawi 249At risk
41Flag of Oman.svg  Oman 250At risk
42Bandera de Bolivia (Estado).svg  Bolivia 250At risk
43Flag of Canada (Pantone).svg  Canada 251At risk
44Flag of Papua New Guinea.svg  Papua New Guinea 251At risk
45Flag of Bhutan.svg  Bhutan 253At risk
46Flag of Eritrea.svg  Eritrea 254At risk
47Flag of Guinea.svg  Guinea 254At risk
48Flag of Libya.svg  Libya 256At risk
49Flag of Andorra.svg  Andorra 257At risk
50Flag of Tanzania.svg  Tanzania 257At risk
51Flag of Belize.svg  Belize 258At risk
52Flag of Uruguay.svg  Uruguay 259At risk
53Flag of Ethiopia.svg  Ethiopia 260At risk
54Flag of Paraguay.svg  Paraguay 260At risk
55Flag of Georgia.svg  Georgia 261At risk
56Flag of Kenya.svg  Kenya 262At risk
57Flag of Finland.svg  Finland 265Vulnerable
58Flag of Sao Tome and Principe.svg  São Tomé and Príncipe 265Vulnerable
59Flag of Somalia.svg  Somalia 265Vulnerable
60Flag of Peru.svg  Peru 268Vulnerable
61Flag of Cambodia.svg  Cambodia 270Vulnerable
62Flag of Latvia.svg  Latvia 270Vulnerable
63Flag of Myanmar.svg  Myanmar 270Vulnerable
64Flag of Norway.svg  Bouvet Island 271Vulnerable
65Flag of Guinea-Bissau.svg  Guinea-Bissau 271Vulnerable
66Flag of Liberia.svg  Liberia 271Vulnerable
67Flag of Tajikistan.svg  Tajikistan 271Vulnerable
68Flag of Nicaragua.svg  Nicaragua 272Vulnerable
69Flag of Honduras.svg  Honduras 273Vulnerable
70Flag of Norway.svg  Norway 273Vulnerable
71Flag of Russia.svg  Russia 273Vulnerable
72Flag of Saudi Arabia.svg  Saudi Arabia 274Vulnerable
73Flag of Sudan.svg  Sudan 274Vulnerable
74Flag of Algeria.svg  Algeria 275Vulnerable
75Flag of the Comoros.svg  Comoros 277Vulnerable
76Flag of The Gambia.svg  Gambia 277Vulnerable
77Flag of Senegal.svg  Senegal 277Vulnerable
78Flag of Benin.svg  Benin 278Vulnerable
79Flag of Ghana.svg  Ghana 279Vulnerable
80Flag of Madagascar.svg  Madagascar 279Vulnerable
81Flag of Saint Helena.svg  Saint Helena 279Vulnerable
82Flag of Lesotho.svg  Lesotho 280Vulnerable
83Flag of Estonia.svg  Estonia 280Vulnerable
84Flag of Morocco.svg  Morocco 281Vulnerable
85Flag of the Solomon Islands.svg  Solomon Islands 281Vulnerable
86Flag of Cape Verde.svg  Cape Verde 282Vulnerable
87Flag of Sierra Leone.svg  Sierra Leone 283Vulnerable
88Flag of Uganda.svg  Uganda 283Vulnerable
89Flag of the Cocos (Keeling) Islands.svg  Cocos (Keeling) Islands 285Vulnerable
90Flag of Vanuatu.svg  Vanuatu 285Vulnerable
91Flag of Uzbekistan.svg  Uzbekistan 286Vulnerable
92Flag of Argentina.svg  Argentina 287Vulnerable
93Flag of Chile.svg  Chile 287Vulnerable
94Flag of Burundi.svg  Burundi 288Vulnerable
95Flag of the Democratic Republic of the Congo.svg  Democratic Republic of the Congo 288Vulnerable
96Flag of the Taliban.svg  Afghanistan 289Vulnerable
97Flag of Yemen.svg  Yemen 289Vulnerable
98Flags of New Caledonia.svg  New Caledonia 290Vulnerable
99Flag of Aruba.svg  Aruba 291Vulnerable
100Flag of Venezuela.svg  Venezuela 291Vulnerable
101Flag of New Zealand.svg  New Zealand 292Vulnerable
102Flag of the Turks and Caicos Islands.svg  Turks and Caicos Islands 292Vulnerable
103Flag of Togo.svg  Togo 293Vulnerable
104Flag of the United Arab Emirates.svg  United Arab Emirates 293Vulnerable
105Flag of the Vatican City (2023-present).svg  Vatican City 293Vulnerable
106Flag of Australia (converted).svg  Heard Island and McDonald Islands 294Vulnerable
107Flag of the Commissioner of the British Indian Ocean Territory.svg  British Indian Ocean Territory 295Vulnerable
108Flag of Colombia.svg  Colombia 296Vulnerable
109Flag of the Faroe Islands.svg  Faroe Islands 296Vulnerable
110Flag of France.svg  Saint Pierre and Miquelon 296Vulnerable
111Flag of Egypt.svg  Egypt 298Vulnerable
112Flag of Iceland.svg  Iceland 298Vulnerable
113Flag of Rwanda.svg  Rwanda 298Vulnerable
114Flag of Norway.svg  Jan Mayen 300Vulnerable
115Flag of the United States.svg  United States 300Vulnerable
116Flag of Slovakia.svg  Slovakia 303Vulnerable
117Flag of Ecuador.svg  Ecuador 304Vulnerable
118Flag of France.svg  Mayotte 304Vulnerable
119Flag of the Pitcairn Islands.svg  Pitcairn 304Vulnerable
120Flag of France.svg  Wallis and Futuna 304Vulnerable
121Flag of Nepal.svg    Nepal 305Vulnerable
122Flag of San Marino.svg  San Marino 305Vulnerable
123Flag of Bosnia and Herzegovina.svg  Bosnia & Herzegovina 306Vulnerable
124Flag of Mexico.svg  Mexico 306Vulnerable
125Flag of Tunisia.svg  Tunisia 306Vulnerable
126Flag of Antigua and Barbuda.svg  Antigua & Barbuda 307Vulnerable
127Flag of Thailand.svg  Thailand 308Vulnerable
128Flag of Hong Kong.svg  Hong Kong 309Vulnerable
129Flag of Niue.svg  Niue 309Vulnerable
130Flag of Jordan.svg  Jordan 310Vulnerable
131Flag of Sweden.svg  Sweden 311Vulnerable
132Flag of Anguilla.svg  Anguilla 312Vulnerable
133Flag of Malaysia.svg  Malaysia 312Vulnerable
134Flag of Brunei.svg  Brunei 313Vulnerable
135Flag of Iran.svg  Iran 313Vulnerable
136Flag of Cyprus.svg  Cyprus 314Vulnerable
137Flag of Lithuania.svg  Lithuania 314Vulnerable
138Flag of the Czech Republic.svg  Czech Republic 315Vulnerable
139Flag of Grenada.svg  Grenada 315Vulnerable
140Flag of Malta.svg  Malta 316Highly vulnerable
141Flag of Indonesia.svg  Indonesia 316Highly vulnerable
142Flag of North Macedonia.svg  Macedonia 316Highly vulnerable
143Flag of Ukraine.svg  Ukraine 317Highly vulnerable
144Flag of Ireland.svg  Ireland 318Highly vulnerable
145Flag of Moldova.svg  Moldova 322Highly vulnerable
146Flag of Bulgaria.svg  Bulgaria 323Highly vulnerable
147Flag of Kuwait.svg  Kuwait 323Highly vulnerable
148Flag of the Netherlands Antilles (1986-2010).svg  Netherlands Antilles 323Highly vulnerable
149Flag of the Dominican Republic.svg  Dominican Republic 324Highly vulnerable
150Flag of South Africa.svg  South Africa 324Highly vulnerable
151Flag of the Republic of China.svg  Taiwan 324Highly vulnerable
152Flag of Bahrain.svg  Bahrain 326Highly vulnerable
153Flag of Luxembourg.svg  Luxembourg 327Highly vulnerable
154Flag of Gibraltar.svg  Gibraltar 328Highly vulnerable
155Flag of Samoa.svg  Samoa 328Highly vulnerable
156Flag of Tokelau.svg  Tokelau 328Highly vulnerable
157Flag of Cuba.svg  Cuba 329Highly vulnerable
158Flag of Albania.svg  Albania 330Highly vulnerable
159Flag of Sri Lanka.svg  Sri Lanka 331Highly vulnerable
160Flag of Monaco.svg  Monaco 332Highly vulnerable
161Flag of Fiji.svg  Fiji 333Highly vulnerable
162Flag of Puerto Rico.svg  Puerto Rico 334Highly vulnerable
163Flag of Portugal.svg  Portugal 335Highly vulnerable
164Flag of Romania.svg  Romania 335Highly vulnerable
165Flag of Nigeria.svg  Nigeria 336Highly vulnerable
166Flag of Saint Vincent and the Grenadines.svg  Saint Vincent and the Grenadines 337Highly vulnerable
167Flag of Guatemala.svg  Guatemala 338Highly vulnerable
168Flag of Palau.svg  Palau 338Highly vulnerable
169Flag of Bangladesh.svg  Bangladesh 340Highly vulnerable
170Flag of France.svg  Réunion 341Highly vulnerable
171Flag of Montserrat.svg  Montserrat 342Highly vulnerable
172Flag of the Cayman Islands.svg  Cayman Islands 343Highly vulnerable
173Flag of Croatia.svg  Croatia 343Highly vulnerable
174Flag of Haiti.svg  Haiti 343Highly vulnerable
175Flag of Iraq.svg  Iraq 344Highly vulnerable
176Flag of Denmark.svg  Denmark 345Highly vulnerable
177Flag of Liechtenstein.svg  Liechtenstein 346Highly vulnerable
178Flag of El Salvador.svg  El Salvador 348Highly vulnerable
179Flag of the Marshall Islands.svg  Marshall Islands 348Highly vulnerable
180Flag of Switzerland (Pantone).svg   Switzerland 348Highly vulnerable
181Flag of Christmas Island.svg  Christmas Island 350Highly vulnerable
182Flag of Syria.svg  Syria 350Highly vulnerable
183Flag of Spain.svg  Spain 352Highly vulnerable
184Flag of Greece.svg  Greece 353Highly vulnerable
185Flag of Turkey.svg  Turkey 353Highly vulnerable
186Flag of Azerbaijan.svg  Azerbaijan 354Highly vulnerable
187Flag of Costa Rica.svg  Costa Rica 354Highly vulnerable
188Flag of Poland.svg  Poland 354Highly vulnerable
189Flag of Seychelles.svg  Seychelles 355Highly vulnerable
190Flag of Germany.svg  Germany 357Highly vulnerable
191Flag of Vietnam.svg  Vietnam 357Highly vulnerable
192Flag of Mauritius.svg  Mauritius 358Highly vulnerable
193Flag of Saint Kitts and Nevis.svg  Saint Kitts and Nevis 359Highly vulnerable
194Flag of the People's Republic of China.svg  China 360Highly vulnerable
195Flag of France.svg  France 361Highly vulnerable
196Flag of Slovenia.svg  Slovenia 362Highly vulnerable
197Flag of Hungary.svg  Hungary 363Highly vulnerable
198Flag of North Korea.svg  North Korea 363Highly vulnerable
199Flag of France.svg  Martinique 364Highly vulnerable
200Flag of Tuvalu.svg  Tuvalu 367Extremely vulnerable
201Flag of Pakistan.svg  Pakistan 368Extremely vulnerable
202Flag of Norfolk Island.svg  Norfolk Island 368Extremely vulnerable
203Flag of Austria.svg  Austria 369Extremely vulnerable
204Flag of Bermuda.svg  Bermuda 373Extremely vulnerable
205Flag of South Korea.svg  South Korea 373Extremely vulnerable
206Flag of Brazil.svg  Brazil 373Extremely vulnerable
207Flag of the United Kingdom.svg  United Kingdom 373Extremely vulnerable
208Flag of the British Virgin Islands.svg  British Virgin Islands 377Extremely vulnerable
209Flag of the Northern Mariana Islands.svg  Northern Mariana Islands 378Extremely vulnerable
210Flag of Israel.svg  Israel 380Extremely vulnerable
211Flag of French Polynesia.svg  French Polynesia 381Extremely vulnerable
212Flag of Jamaica.svg  Jamaica 381Extremely vulnerable
213Flag of Trinidad and Tobago.svg  Trinidad and Tobago 381Extremely vulnerable
214Flag of the Cook Islands.svg  Cook Islands 383Extremely vulnerable
215Flag of Maldives.svg  Maldives 383Extremely vulnerable
216Flag of India.svg  India 385Extremely vulnerable
217Flag of Italy.svg  Italy 386Extremely vulnerable
218Flag of Belgium (civil).svg  Belgium 387Extremely vulnerable
219Flag of Lebanon.svg  Lebanon 387Extremely vulnerable
220Flag of the Netherlands.svg  Netherlands 388Extremely vulnerable
221Flag of Japan.svg  Japan 389Extremely vulnerable
222Flag of Guam.svg  Guam 390Extremely vulnerable
223Flag of the Federated States of Micronesia.svg  Micronesia 392Extremely vulnerable
224Flag of Tonga.svg  Tonga 392Extremely vulnerable
225Flag of Saint Lucia.svg  Saint Lucia 393Extremely vulnerable
226Flag of Kiribati.svg  Kiribati 395Extremely vulnerable
227Flag of the United States Virgin Islands.svg  United States Virgin Islands 396Extremely vulnerable
228Flag of the Philippines.svg  Philippines 402Extremely vulnerable
229Flag of Barbados.svg  Barbados 403Extremely vulnerable
230Flag of Macau.svg  Macau 407Extremely vulnerable
231Flag of France.svg  Guadeloupe 412Extremely vulnerable
232Flag of Nauru.svg  Nauru 421Extremely vulnerable
233Flag of Singapore.svg  Singapore 428Extremely vulnerable
234Flag of American Samoa.svg  American Samoa 436Extremely vulnerable

See also

Related Research Articles

<span class="mw-page-title-main">Geography of Ecuador</span>

Ecuador is a country in western South America, bordering the Pacific Ocean at the Equator, for which the country is named. Ecuador encompasses a wide range of natural formations and climates, from the desert-like southern coast to the snowcapped peaks of the Andes mountain range to the plains of the Amazon Basin. Cotopaxi in Ecuador is one of the world's highest active volcanos. It also has a large series of rivers that follow the southern border and spill into the northwest area of Peru.

<span class="mw-page-title-main">Geography of Israel</span>

The geography of Israel is very diverse, with desert conditions in the south, and snow-capped mountains in the north. Israel is located at the eastern end of the Mediterranean Sea in West Asia. It is bounded to the north by Lebanon, the northeast by Syria, the east by Jordan and the West Bank, and to the southwest by Egypt. To the west of Israel is the Mediterranean Sea, which makes up the majority of Israel's 273 km (170 mi) coastline, and the Gaza Strip. Israel has a small coastline on the Red Sea in the south.

<span class="mw-page-title-main">Geography of Japan</span>

Japan is an archipelagic country comprising a stratovolcanic archipelago over 3,000 km (1,900 mi) along the Pacific coast of East Asia. It consists of 14,125 islands. The five main islands are Hokkaido, Honshu, Kyushu, Shikoku, and Okinawa. The other 14,120 islands are classified as "remote islands" by the Japanese government. The Ryukyu Islands and Nanpō Islands are south and east of the main islands.

<span class="mw-page-title-main">Geography of Kenya</span> Geographical features of Kenya

The Geography of Kenya is diverse, varying amongst its 47 counties. Kenya has a coastline on the Indian Ocean, which contains swamps of East African mangroves. Inland are broad plains and numerous hills. Kenya borders South Sudan to the northwest, Uganda to the west, Somalia to the east, Tanzania to the south, and Ethiopia to the north. Kenya currently faces border disputes with South Sudan over the Ilemi Triangle and with Somalia over Jubbaland where, if the Somalian Government gives it up, it could be a new part of Kenya, which would bring the total land area of Kenya to approximately 692,939 km2.

<span class="mw-page-title-main">Geography of Laos</span>

Laos is a country in and the only landlocked nation in mainland Southeast Asia, northeast of Thailand and west of Vietnam. It covers approximately 236,800 square kilometers in the center of the Southeast Asian peninsula and it is surrounded by Myanmar (Burma), Cambodia, the People's Republic of China, Thailand, and Vietnam.

<span class="mw-page-title-main">Geography of the Philippines</span>

The Philippines is an archipelago that comprises 7,641 islands, and with a total land area of 300,000 square kilometers (115,831 sq mi), it is the world's fifth largest island country. The eleven largest islands contain 95% of the total land area. The largest of these islands is Luzon at about 105,000 square kilometers (40,541 sq mi). The next largest island is Mindanao at about 95,000 square kilometers (36,680 sq mi). The archipelago is around 800 kilometers (500 mi) from the Asian mainland and is located between Taiwan and Borneo.

<span class="mw-page-title-main">Geography of Uruguay</span> Geographical features of Uruguay

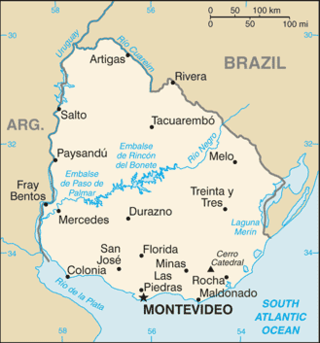
Uruguay is a country in the southeastern region of South America, bordering the Atlantic Ocean, between Argentina and Brazil. It is located in the Southern Hemisphere on the Atlantic seaboard of South America between 53 and 58 west longitude and 30 and 35 south latitude. It is bordered to the west by Argentina, on the north and northeast by Brazil, and on the southeast by the Atlantic Ocean, which makes up Uruguay's coast.

<span class="mw-page-title-main">Geography of Uzbekistan</span> Overview of the geography of Uzbekistan

Uzbekistan is a country in Central Asia, located north of Turkmenistan and Afghanistan. With an area of 447,000 square kilometers, Uzbekistan stretches 1,425 km (885 mi) from west to east and 930 km (580 mi) from north to south. It borders Turkmenistan to the southwest, Kazakhstan to the north and Tajikistan and Kyrgyzstan to the south and east. Uzbekistan also has four small exclaves in Turkmenistan.

<span class="mw-page-title-main">Geography of Mexico</span> Overview of the geography of Mexico

The geography of Mexico describes the geographic features of Mexico, a country in the Americas. Mexico is located at about 23° N and 102° W in the southern portion of North America. From its farthest land points, Mexico is a little over 3,200 km (2,000 mi) in length. Mexico is bounded to the north by the United States, to the west and south by the Pacific Ocean, to the east by the Gulf of Mexico, and to the southeast by Belize, Guatemala, and the Caribbean Sea. The northernmost constituent of Latin America, it is the most populous Spanish-speaking country in the world. Mexico is the world's 13th largest country, three times the size of Texas.

<span class="mw-page-title-main">Geography of Bangladesh</span> Geography of Bangladesh

Bangladesh is a densely populated, low-lying, mainly riverine country located in South Asia with a coastline of 580 km (360 mi) on the northern littoral of the Bay of Bengal. The delta plain of the Ganges (Padma), Brahmaputra (Jamuna), and Meghna Rivers and their tributaries occupy 79 percent of the country. Four uplifted blocks occupy 9 percent and steep hill ranges up to approximately 1,000 metres (3,300 ft) high occupy 12 percent in the southeast and in the northeast. Straddling the Tropic of Cancer, Bangladesh has a tropical monsoon climate characterised by heavy seasonal rainfall, high temperatures, and high humidity. Natural disasters such as floods and cyclones accompanied by storm surges periodically affect the country. Most of the country is intensively farmed, with rice the main crop, grown in three seasons. Rapid urbanisation is taking place with associated industrial and commercial development. Exports of garments and shrimp plus remittances from Bangladeshis working abroad provide the country's three main sources of foreign exchange income.

The Pacific Islands Applied Geoscience Commission (SOPAC) was an inter-governmental regional organisation dedicated to providing services to promote sustainable development in the countries it serves. In 2010, its functions had been transferred to the Pacific Community (SPC) and the Pacific Regional Environment Programme (SPREP), thus ending SOPAC as a separate entity. Today, SOPAC is a division of the SPC with its main office in Suva, Fiji.

<span class="mw-page-title-main">Development geography</span>

Development geography is a branch of geography which refers to the standard of living and its quality of life of its human inhabitants. In this context, development is a process of change that affects peoples' lives. It may involve an improvement in the quality of life as perceived by the people undergoing change. However, development is not always a positive process. Gunder Frank commented on the global economic forces that lead to the development of underdevelopment. This is covered in his dependency theory.

<span class="mw-page-title-main">Belford Roxo, Rio de Janeiro</span> Municipality in Southeast, Brazil

Belford Roxo is a city in the state of Rio de Janeiro, Brazil. It is a part of the metropolitan region of the city of Rio de Janeiro and was created in 1990. Its population was 513,118 in 2020 and its area is 79 km². Belford Roxo is one of the less prosperous cities in the state, due to its low GDP and relatively large population. Its climate is tropical with an average temperature of 18 °C (63 °F). Bayer and Lubrizol are the biggest companies in the municipality. It was named after Engineer Raimundo Teixeira Belfort Roxo. While serving as General Construction and Building Inspector for the city of Rio de Janeiro, Belfort Roxo, together with fellow engineer Paulo de Frontin, solved the water shortage problems of the area during the summer of 1889.

<span class="mw-page-title-main">Environment of Australia</span>

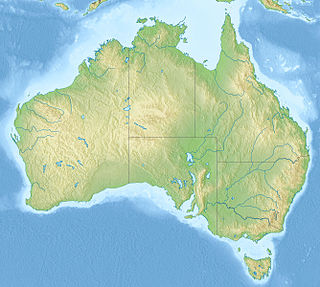
The Australian environment ranges from virtually pristine Antarctic territory and rainforests to degraded industrial areas of major cities. Forty distinct ecoregions have been identified across the Australian mainland and islands. Central Australia has a very dry climate. The interior has a number of deserts while most of the coastal areas are populated. Northern Australia experiences tropical cyclones while much of the country is prone to periodic drought. This dry and warm environment and exposure to cyclones, makes Australia particularly vulnerable to climate change -- with some areas already experiencing increases in wildfires and fragile ecosystems.

Water resources management is a significant challenge for Mexico. The country has in place a system of water resources management that includes both central (federal) and decentralized institutions. Furthermore, water management is imposing a heavy cost to the economy.

<span class="mw-page-title-main">Geography of Belarus</span> Overview of the geography of Belarus

Belarus is a landlocked, generally flat country without natural borders, that occupies an area of 207,600 square kilometers (80,200 sq mi). Its neighbors are Russia to the east and northeast, Latvia to the north, Lithuania to the northwest, Poland to the west, and Ukraine to the south. Its extension from north to south is 560 km (350 mi), from west to east is 650 km (400 mi).

A vulnerability index is a measure of the exposure of a population to some hazard. Typically, the index is a composite of multiple quantitative indicators that via some formula, delivers a single numerical result. Through such an index "diverse issues can be combined into a standardised framework...making comparisons possible". For instance, indicators from the physical sciences can be combined with social, medical and even psychological variables to evaluate potential complications for disaster planning.

Bangladesh is an under-devoloped nation. Despite rapid economic growth, poverty remains a major issue. However, poverty has declined sharply in recent history. Shortly after its independence, approximately 90% of the population lived under the poverty line. However, since economic reforms and trade liberalization of early 1990s, along with accelerated economic growth since early-2000s, Bangladesh have experienced a dramatic progress in reducing poverty. The remarkable progress in poverty alleviation has been recognized by international institutions. According to World Bank, more than 33 million Bangladeshi people have been lifted out of poverty since 2000; as measured by the percentage of people living on the equivalent of US$1.90 or less per day in 2011 purchasing price parity terms.

<span class="mw-page-title-main">Climate change in Algeria</span>

Climate change in Algeria has wide-reaching effects on the country. Algeria was not a significant contributor to climate change, but, like other countries in the Middle East and North Africa (MENA) region, is expected to be among the most affected by climate change impacts. Because a large part of the country is in already hot and arid geographies, including part of the Sahara, already strong heat and water resource access challenges are expected to get worse. As early as 2014, scientists were attributing extreme heat waves to climate change in Algeria. Algeria was ranked 46th of countries in the 2020 Climate Change Performance Index.

References

  1. Environmental Vulnerability Index Secretariat of the Pacific Community. Retrieved 4 November 2013.

Further reading