Geography of Louisville, Kentucky

Last updated

McAlpine Locks and Dam, Louisville, Kentucky, the only man-made portion of the Ohio River McAlpine Locks and Dam.jpg
McAlpine Locks and Dam, Louisville, Kentucky, the only man-made portion of the Ohio River

Louisville is a city in Jefferson County, in the U.S. state of Kentucky. It is located at the Falls of the Ohio River.

Contents

Louisville is located at 38°13′31″N85°44′30″W / 38.225371°N 85.741613°W / 38.225371; -85.741613 . [1] According to the U.S. Census Bureau, Louisville Metro (in 2015 measurements for Jefferson County) has a total area of 397.68 square miles (1,030.0 km2), of which 380.46 square miles (985.4 km2) is land and 17.23 square miles (44.6 km2) (4.33%) is covered by water. [2]

Topography and geomorphology

The Jefferson Memorial Forest is the largest municipal urban forest in the United States. Jefferson Memorial forest 5.jpg
The Jefferson Memorial Forest is the largest municipal urban forest in the United States.

Although the soils and underlying rocks officially put Louisville in the outer Bluegrass region, the city's landscape is better described as being in a very wide part of the Ohio River flood plain. Louisville's part of the valley is located between two plateaus, the karst plateau of Southern Indiana and the Bluegrass plateau of Kentucky, both with an elevation of around 900 feet. Elevations drop off the Indiana plateau very sharply via the Muldraugh Escarpment, whereas the rise in elevation up to the Bluegrass plateau is more gradual.

The flood plain is much longer north to south than it is east to west. For example, within several miles of downtown, the Highlands sitting at 540 feet is out of the thousand-year flood plain, whereas areas 10 miles from downtown such as Fairdale and Okolona (both between seven and 11 miles from the river) have the same elevation as downtown Louisville. Most areas in the east end have an elevation from 600 to 700 feet, which, with the typically eastbound winds, trap in heat and pollutants.

Areas along and west of the south fork of Beargrass Creek (and more generally, I-65) are located where the Ohio River once ran, so the land here is very flat and is composed of harder rocks. Prior to urbanization much of this area was composed of wetlands, and early roads through these were made of wooden planks. This history is occasionally still readily evident in street names, for example, the spoke road Poplar Level, whose name describes its original construction on planks of poplar. 3rd Street was formerly called Central Plank Road for the same reason. As an industry, namely Standiford Field airport, moved into the area in the 1950s most creeks through the area were rerouted into ditches to alleviate the area's poor drainage and constant flooding.

Areas east of I-65 were generally not in the flood plain and thus are mostly gentle rolling hills composed of soft loess soils, hence the reason roads here (such as Eastern Parkway) are very prone to potholes. The southern quarter of Jefferson County is in the scenic and rugged Knobs region. This is the only part of Jefferson County to not have experienced any urbanization and is today almost entirely parkland for the Jefferson Memorial Forest. The eastern third is in the Eden Shale Hills section of the Bluegrass region and has also experienced less urbanization than the flood plain, although that is starting to change.

Political geography and population

Population density of Jefferson County, darkest green representing the most dense areas, which include Old Louisville, parts of the West End and the Highlands, the Churchill Downs area, Crescent Hill and Newburg. Jefferson county population density.gif
Population density of Jefferson County, darkest green representing the most dense areas, which include Old Louisville, parts of the West End and the Highlands, the Churchill Downs area, Crescent Hill and Newburg.

The Louisville-Jefferson County, KY-IN Metropolitan Statistical Area (MSA), the 43rd-largest in the United States, [3] includes the Kentucky counties of Jefferson (coterminous with Louisville Metro), Bullitt, Henry, Meade, Nelson, Oldham, Shelby, Spencer and Trimble. The southern Indiana counties Clark, Floyd, Harrison and Washington are also included in the Louisville MSA. This MSA is included in the Louisville-Elizabethtown-Scottsburg, KY-IN Combined Statistical Area (CSA), which also includes the Elizabethtown, KY MSA (composed of Hardin and LaRue Counties) as well as the Scottsburg, IN Micropolitan Statistical Area.

Louisville's Metro Area was expanded more than any other in the country during a March 2003 overhaul of U.S. Metropolitan Area statistics by the federal government. In the 2000 census, even very fast growing counties such as Spencer County weren't included. The Metro Area's ranking rose from 49th to 42nd, and the added Combined Statistical Area measured the area as the nation's 31st-largest. The total Metro area population also increased dramatically from just over 1 million to nearly 1.4 for the CSA.

Seventeen percent of the state's population lives in Jefferson County and 25% live in counties in the Louisville CSA, and also Jefferson County has two-and-a-half times more people than Kentucky's second-most populous county, Fayette County. Twelve of the 15 buildings in Kentucky over 300 feet are located in Downtown Louisville. Almost 40% of the population growth in Kentucky are in Louisville's CSA counties.[ citation needed ]

Climate

Louisville
Climate chart (explanation)
J
F
M
A
M
J
J
A
S
O
N
D
 
 
3.2
 
 
43
27
 
 
3.2
 
 
48
30
 
 
4.2
 
 
58
38
 
 
4
 
 
69
47
 
 
5.3
 
 
77
57
 
 
3.8
 
 
85
66
 
 
4.2
 
 
89
70
 
 
3.3
 
 
88
69
 
 
3.1
 
 
81
60
 
 
3.2
 
 
70
49
 
 
3.6
 
 
58
40
 
 
3.8
 
 
46
30
Average max. and min. temperatures in °F
Precipitation totals in inches
Source: NOAA
Metric conversion
J
F
M
A
M
J
J
A
S
O
N
D
 
 
82
 
 
6
−3
 
 
81
 
 
9
−1
 
 
106
 
 
14
3
 
 
102
 
 
20
9
 
 
134
 
 
25
14
 
 
96
 
 
30
19
 
 
107
 
 
32
21
 
 
85
 
 
31
20
 
 
77
 
 
27
16
 
 
82
 
 
21
9
 
 
91
 
 
14
4
 
 
97
 
 
8
−1
Average max. and min. temperatures in °C
Precipitation totals in mm

Louisville has a humid subtropical climate (Köppen Cfa), typical of the Upper South, with four distinct seasons and is located in USDA hardiness zones 6b and 7a. [4] Spring-like conditions typically begin in mid-to-late March, summer from mid-to-late-May to late September, with fall in the October–November period. Seasonal extremes in both temperature and precipitation are not uncommon during early spring and late fall; severe weather is not uncommon, with occasional tornado outbreaks in the region. Winter typically brings a mix of rain, sleet, and snow, with occasional heavy snowfall and icing. Louisville averages 5.8 days with low temperatures dipping to 10 °F (−12 °C), while readings of 0 °F (−18 °C) or below occur on average every several years, the last occurrence being January 7, 2014; the average window for freezing temperatures is October 31 thru April 6, allowing a growing season of 207 days. [5] Summer is typically hazy, hot, and humid with long periods of 90–100 °F (32–38 °C) temperatures and drought conditions at times. Louisville averages 35 days a year with high temperatures at or above 90 °F (32 °C), [lower-alpha 1] and the average window for such temperatures on average fall on June 7 and September 10, respectively. The mean annual temperature is 58.2 °F (14.6 °C), [lower-alpha 2] with an average seasonal snowfall of 12.5 in (32 cm) and an average annual rainfall of 44.9 inches (1,140 mm). [lower-alpha 3] [lower-alpha 4] The first and last measurable (≥0.1 in or 0.25 cm) snowfalls of the season on average fall on December 8 and March 12, respectively. The greatest amount of precipitation in 24 hours was 10.48 inches (266.2 mm) on March 1, 1997, and the heaviest 24-hour snowfall total was 15.5 in (39.4 cm), occurring only two days before the all-time record low (see below). [5]

The wettest seasons are spring and summer, although rainfall is fairly constant year round. During the winter, particularly in January and February, several days of snow can be expected. January is the coldest month, with a mean temperature of 34.9 °F (1.6 °C). July is the average hottest month with a mean of 79.3 °F (26.3 °C). [6] The highest recorded temperature was 107 °F (42 °C), which last occurred on July 14, 1936, and the lowest recorded temperature was −22 °F (−30 °C) on January 19, 1994. [7] The record high daily minimum was 84 °F (29 °C) on August 19, 1936, while the record low daily maximum was −2 °F (−19 °C) on January 12, 1918; the only other sub-0 °F (−18 °C) daily maximum occurred on January 5, 1884. In 2012, Louisville had the fourth-hottest summer on record, with the temperature rising up to 106 °F (41 °C) in July and the June all-time monthly record-high temperature being broken on two consecutive days. [5] As the city exemplifies the urban heat island effect, temperatures in commercial areas and in the industrialized areas along interstates are often higher than in the suburbs, often as much as 5 °F (2.8 °C).

A 2012 study by the Urban Climate Lab at Georgia Tech shows that Louisville has the highest index of the heat island effect in America. According to Brian Stone of the Urban Climate Lab and author of The City and the Coming Climate, "The average increase in the temperature difference between urban and rural environments in the Louisville area has been 1.67 degrees Fahrenheit every decade between 1961 and 2010. That's nearly double the rate of the next city on the list, Phoenix, which saw an average change of .96 degrees in the same period." Stone said that part of Louisville's problem stems from the unfortunate meteorological conditions of the Ohio River Valley, which is prone to stagnant air conditions but also that the lack of tree cover in the urban core contributes as well. Stone states that "The tree canopy downtown is one of the sparsest of any city I have seen in the country." The tree cover in Louisville's larger metro area is around 30 percent, according to Stone's research, with the urban core at just 10 percent. That compares to about 45 percent in the city of Atlanta. [8]

Air pollution is trapped in Louisville's Ohio River Valley location. The city is ranked by Environmental Defense as America's 38th-worst city for air quality. [9]

Louisville's lowest solar noon is 28.4 degrees with the shortest daylength being 9 hours and 30 seconds, both occurring from December 17–26. The city's highest solar noon is 75.2 degrees with the longest daylength being 14 hours and 39 seconds, both occurring from June 17–25. The city's March and September equinox occurs at 50.5 degrees. [10]

Climate data for Louisville International Airport, Kentucky (1991–2020 normals, [lower-alpha 5] extremes 1872–present [lower-alpha 6] )
MonthJanFebMarAprMayJunJulAugSepOctNovDecYear
Record high °F (°C)77
(25)
82
(28)
88
(31)
91
(33)
98
(37)
105
(41)
107
(42)
105
(41)
104
(40)
97
(36)
85
(29)
76
(24)
107
(42)
Mean maximum °F (°C)65.2
(18.4)
70.4
(21.3)
77.8
(25.4)
84.1
(28.9)
89.0
(31.7)
93.6
(34.2)
95.7
(35.4)
95.6
(35.3)
92.9
(33.8)
85.4
(29.7)
75.1
(23.9)
67.0
(19.4)
97.3
(36.3)
Mean daily maximum °F (°C)43.6
(6.4)
48.3
(9.1)
58.1
(14.5)
69.6
(20.9)
77.8
(25.4)
85.7
(29.8)
89.0
(31.7)
88.4
(31.3)
82.2
(27.9)
70.5
(21.4)
57.6
(14.2)
47.2
(8.4)
68.2
(20.1)
Daily mean °F (°C)35.7
(2.1)
39.5
(4.2)
48.4
(9.1)
59.0
(15.0)
68.3
(20.2)
76.4
(24.7)
79.9
(26.6)
78.9
(26.1)
72.0
(22.2)
60.3
(15.7)
48.5
(9.2)
39.6
(4.2)
58.9
(14.9)
Mean daily minimum °F (°C)27.8
(−2.3)
30.7
(−0.7)
38.6
(3.7)
48.5
(9.2)
58.7
(14.8)
67.2
(19.6)
70.8
(21.6)
69.5
(20.8)
61.9
(16.6)
50.1
(10.1)
39.4
(4.1)
32.1
(0.1)
49.6
(9.8)
Mean minimum °F (°C)6.0
(−14.4)
11.4
(−11.4)
20.3
(−6.5)
31.7
(−0.2)
41.9
(5.5)
53.6
(12.0)
60.5
(15.8)
58.7
(14.8)
46.9
(8.3)
33.7
(0.9)
23.1
(−4.9)
13.0
(−10.6)
3.3
(−15.9)
Record low °F (°C)−22
(−30)
−19
(−28)
−1
(−18)
21
(−6)
31
(−1)
42
(6)
49
(9)
45
(7)
33
(1)
23
(−5)
−1
(−18)
−15
(−26)
−22
(−30)
Average precipitation inches (mm)3.39
(86)
3.41
(87)
4.60
(117)
4.80
(122)
5.18
(132)
4.27
(108)
4.05
(103)
3.71
(94)
3.66
(93)
3.72
(94)
3.42
(87)
4.13
(105)
48.34
(1,228)
Average snowfall inches (cm)4.5
(11)
4.1
(10)
2.1
(5.3)
0.1
(0.25)
0.0
(0.0)
0.0
(0.0)
0.0
(0.0)
0.0
(0.0)
0.0
(0.0)
0.1
(0.25)
0.3
(0.76)
2.2
(5.6)
13.4
(34)
Average precipitation days (≥ 0.01 in)11.210.412.111.912.610.510.28.27.97.99.811.8124.5
Average snowy days (≥ 0.1 in)3.73.71.70.10.00.00.00.00.00.00.62.512.3
Average relative humidity (%)68.668.164.061.567.268.970.971.772.969.969.470.268.6
Mean monthly sunshine hours 140.5148.9188.6221.1263.4288.9293.6272.6234.3208.5135.7118.32,514.4
Percent possible sunshine 46495156606565656360454056
Average ultraviolet index 1.82.84.66.58.08.99.18.26.44.02.31.65.3
Source 1: NOAA (relative humidity and sun 1961–1990) [11] [5] [12]
Source 2: UV Index Today (1995 to 2022) [13]

See also

Notes

  1. The number of 90 °F+ days has historically ranged from 3 in 1974 to 85 in 2010. [5]
  2. The coolest year on record was 53.6 °F (12.0 °C) in 1917, while the warmest 60.8 °F (16.0 °C) in 2012. Monthly mean temperatures have ranged from 18.6 °F (−7.4 °C) in January 1977 to 85.0 °F (29.4 °C) in August 2007, although the highest average monthly minimum temperature was 74.5 °F (23.6 °C) in July 2011. [5]
  3. Historically, winter snowfall has ranged from 0.9 in (2.3 cm) in 1988–89 to 50.2 in (128 cm) in 1917–18.
  4. Annual precipitation has ranged from 23.88 in (607 mm) in 1930 to 68.02 in (1,728 mm) in 2011.
  5. Mean monthly maxima and minima (i.e. the expected highest and lowest temperature readings at any point during the year or given month) calculated based on data at said location from 1991 to 2020.
  6. Official records for Louisville were kept at the Weather Bureau Office from August 1872 to June 1945, Bowman Field from July 1945 to November 1947, Louisville Int'l from December 1947 to October 1995, the Weather Forecast Office ( 38°06′54″N85°38′42″W / 38.1150°N 85.6450°W ) from November 1995 to December 2005, and again at Louisville Int'l since January 2006. For more information, see Threadex

Related Research Articles

<span class="mw-page-title-main">Kentucky</span> U.S. state

Kentucky, officially the Commonwealth of Kentucky, is a landlocked state in the Southeastern region of the United States. Kentucky borders Illinois, Indiana, and Ohio to the north, West Virginia to the northeast, Virginia to the east, Tennessee to the south, and Missouri to the west. Its northern border is defined by the Ohio River. Its capital is Frankfort and its largest city is Louisville. As of 2020, the population was approximately 4.5 million.

<span class="mw-page-title-main">Lexington, Kentucky</span> City in Kentucky, United States

Lexington is the second-most-populous city in the Commonwealth of Kentucky, and the 60th-most populous city in the United States. It is the county seat of Fayette County. By land area, it is the country's 30th-largest city.

<span class="mw-page-title-main">Frankfort, Kentucky</span> Capital city of Kentucky, United States

Frankfort is the capital city of the U.S. state of Kentucky and the seat of Franklin County. It is a home rule-class city. The population was 28,602 at the 2020 United States census. Located along the Kentucky River, Frankfort is the principal city of the Frankfort, Kentucky Micropolitan Statistical Area, which includes all of Franklin and Anderson counties. It is the 4th least populous state capital in the United States, and the 13th most populous city in Kentucky.

<span class="mw-page-title-main">Louisville, Kentucky</span> Largest city in Kentucky, United States

Louisville is the most populous city in the Commonwealth of Kentucky, sixth-most populous city in the Southeast, and the 27th-most-populous city in the United States. By land area, it is the country's 24th-largest city, although by population density, it is the 265th most dense city. Louisville is the historical county seat and, since 2003, the nominal seat of Jefferson County, on the Indiana border.

<span class="mw-page-title-main">LaRue County, Kentucky</span> County in Kentucky, United States

LaRue County is a county in the central region of the U.S. state of Kentucky, outside the Bluegrass Region and larger population centers. As of the 2020 census, the population was 14,867. Its county seat is Hodgenville, which is best known as the birthplace of United States President Abraham Lincoln. The county was established on March 4, 1843, from the southeast portion of Hardin County. It was named for John P. LaRue, an early settler. LaRue County is included in the Elizabethtown-Fort Knox, KY Metropolitan Statistical Area, which is also included in the Louisville/Jefferson County-Elizabethtown-Bardstown, KY-IN Combined Statistical Area. It is a dry county.

<span class="mw-page-title-main">Jefferson County, Kentucky</span> County in Kentucky, United States

Jefferson County is located in the north central portion of the U.S. state of Kentucky. As of the 2020 census, the population was 782,969. It is the most populous county in the commonwealth.

<span class="mw-page-title-main">Jackson, Kentucky</span> City in Kentucky, United States

Jackson is a home rule-class city in and the county seat of Breathitt County, Kentucky, in the United States. The population was 2,231 according to the 2010 U.S. census.

<span class="mw-page-title-main">St. Matthews, Kentucky</span> City in Kentucky, United States

St. Matthews is a city in Jefferson County, Kentucky, United States. It forms part of the Louisville Metro government but is separately incorporated as a home rule-class city. The population was 17,472 at the 2010 census, up from 15,852 at the 2000 census. It is the 23rd-largest city in the state. St. Matthews is one of the state's major shopping areas, home to the fifth-largest mall in Kentucky along with many smaller shopping centers along Shelbyville Road.

<span class="mw-page-title-main">Phoenix metropolitan area</span> Metropolitan statistical area in Arizona, United States

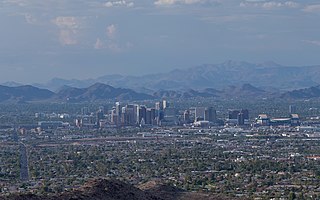
The Phoenix metropolitan area, also known as the Valley of the Sun, the Salt River Valley, metro Phoenix, or The Valley, is the largest metropolitan statistical area in the Southwestern United States, with its largest principal city being the city of Phoenix. It includes much of central Arizona. The United States Office of Management and Budget designates the area as the Phoenix–Mesa–Chandler Metropolitan Statistical Area (MSA), defining it as Maricopa and Pinal counties. It anchors the Arizona Sun Corridor megaregion along with the second-most populous metropolitan area in the state, the Tucson metropolitan area. The gross domestic product of the Phoenix metropolitan area was $255 billion in 2018, 16th highest amongst metro areas in the United States.

<span class="mw-page-title-main">Louisville metropolitan area</span> Geographic region surrounding Louisville, KY, USA

The Louisville metropolitan area is the 43rd largest metropolitan statistical area (MSA) in the United States. It had a population of 1,395,855 in 2020 according to the latest official census, and its principal city is Louisville, Kentucky.

The climate of Salt Lake City, Utah features cold and snowy winters, hot and dry summers, and modest to light seasonal rainfall. Lying in the Salt Lake Valley, the city is surrounded by mountains and the Great Salt Lake. Under the Köppen climate classification, Salt Lake City has either a Mediterranean climate (Csa) or dry-summer continental climate (Dsa) depending on which variant of the system is used, though it borders on a cold semi-arid climate (BSk) due to the city's relatively low precipitation.

<span class="mw-page-title-main">Ohio Valley in Kentucky</span> Valley in Kentucky, United States of America

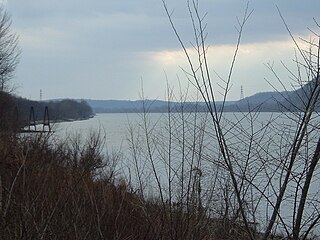
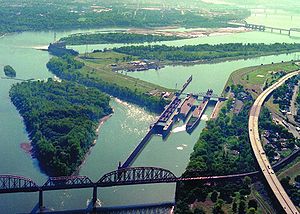
The Ohio Valley is a sub region in Kentucky running 658 miles (1,059 km) long including parts of 25 counties and across five regions of the state. Over 45% of Kentucky's population live in counties that border the Ohio River, although those counties are only 16% of the state's land area.

The Point was a thriving 19th century neighborhood in Louisville, Kentucky, east of Downtown Louisville and opposite Towhead Island along the Ohio River. It was also located north of the present day Butchertown area.

<span class="mw-page-title-main">Geography of Toronto</span> Geography of the city of Toronto, Canada

The geography of Toronto, Ontario, covers an area of 630 km2 (240 sq mi) and is bounded by Lake Ontario to the south; Etobicoke Creek, Eglinton Avenue, and Highway 427 to the west; Steeles Avenue to the north; and the Rouge River and the Scarborough–Pickering Townline to the east. In addition to Etobicoke Creek and the Rouge River, the city is trisected by two minor rivers and their tributaries, the Humber River in the west end and the Don River east of downtown. Both flow southward to Lake Ontario at Humber Bay and Toronto Harbour respectively, which are part of the longer Waterfront, as well as Etobicoke Creek and the Rouge River.

The Louisville/Jefferson County metro government (balance) is a statistical entity in the U.S. state of Kentucky defined by the United States Census Bureau to represent the portion of the consolidated city-county of Louisville-Jefferson County that does not include any of the 83 separate incorporated places (municipalities) located within the city and county. It is made of the portion of Jefferson County that was the city of Louisville prior to the 2003 creation of Louisville Metro, plus a large swath of previously unincorporated territory.

Dallas is located in North Texas, built along the Trinity River. It has a humid subtropical climate that is characteristic of the southern plains of the United States. Dallas experiences mild winters and hot summers.

<span class="mw-page-title-main">Climate of the United States</span> Varies due to changes in latitude, and a range of geographic features

The climate of the United States varies due to changes in latitude, and a range of geographic features, including mountains and deserts. Generally, on the mainland, the climate of the U.S. becomes warmer the further south one travels, and drier the further west, until one reaches the West Coast.

<span class="mw-page-title-main">Geography of Kentucky</span> Overview of the Geography of Kentucky

Kentucky is situated in the Upland South region of the United States. A significant portion of eastern Kentucky is part of Appalachia.

<span class="mw-page-title-main">Outline of Kentucky</span> Overview of and topical guide to Kentucky

The following outline is provided as an overview of and topical guide to the United States Commonwealth of Kentucky:

<span class="mw-page-title-main">Cincinnati metropolitan area</span> Metropolitan Statistical Area in the United States

The Cincinnati metropolitan area is a metropolitan area with its core in Ohio and Kentucky. Its largest city is Cincinnati and includes surrounding counties in the U.S. states of Ohio, Kentucky, and Indiana.

References

  1. "U.S. Gazetteer file for Kentucky places (Louisville city)". United States Census Bureau. 2015. Archived from the original on February 8, 2017. Retrieved August 26, 2016.
  2. "U.S. Gazetteer file for Kentucky counties (Jefferson County)". United States Census Bureau. 2015. Archived from the original on February 8, 2017. Retrieved August 26, 2016.
  3. "Table 1. Annual Estimates of the Population of Metropolitan and Micropolitan Statistical Areas: April 1, 2010 to July 1, 2013" (CSV). 2013 Population Estimates. United States Census Bureau, Population Division. March 2014. Retrieved June 15, 2014.[ permanent dead link ]
  4. "USDA Plant Hardiness Zone Interactive Map". Planthardiness.ars.usda.gov. Archived from the original on February 9, 2014. Retrieved March 31, 2014.
  5. 1 2 3 4 5 6 "NowData – NOAA Online Weather Data". National Oceanic and Atmospheric Administration . Retrieved June 2, 2021.
  6. Climate information from NOAA Archived September 4, 2013, at the Wayback Machine
  7. Maximum and minimum temperatures from Yahoo! Weather
  8. Goodyear, Sarah (May 8, 2013). "There Are Few Trees in Louisville, America's Fastest Warming City". Next City . Archived from the original on December 6, 2013. Retrieved March 31, 2014.
  9. "Clean Air in your city". Environmental Defense. Archived from the original on August 13, 2007. Retrieved July 24, 2007.
  10. "Sunrise and sunset in Louisville – Kentucky – U.S.A". Timeanddate.com. Archived from the original on June 12, 2011. Retrieved January 27, 2011.
  11. "Station Name: KY Louisville Intl. AP". U.S. Climate Normals 2020: U.S. Monthly Climate Normals (1991–2020). National Oceanic and Atmospheric Administration. Retrieved June 2, 2021.
  12. "WMO Climate Normals for Louisville/Standiford Field KY 1961–1990". National Oceanic and Atmospheric Administration. Retrieved March 11, 2014.
  13. "Historical UV Index Data - Louisdville, KY". UV Index Today. Retrieved April 21, 2023.

Further reading