
A blizzard is a severe snowstorm characterized by strong sustained winds and low visibility, lasting for a prolonged period of time—typically at least three or four hours. A ground blizzard is a weather condition where snow is not falling but loose snow on the ground is lifted and blown by strong winds. Blizzards can have an immense size and usually stretch to hundreds or thousands of kilometres.

The 1993 Storm of the Century was a cyclonic storm that formed over the Gulf of Mexico on March 12, 1993. The cold weather, heavy snowfall, high winds and storm surges that the storm brought affected a very large area; at its height, it stretched from Canada to Honduras. The cyclone moved through the Gulf of Mexico and then through the eastern United States before moving on to eastern Canada. It eventually dissipated in the North Atlantic Ocean on March 15.

The North American blizzard of 1996 was a severe nor'easter that paralyzed the United States East Coast with up to 4 feet (1.2 m) of wind-driven snow from January 6 to January 8, 1996. The City University of New York reported that the storm "dropped 20 inches of snow, had wind gusts of 50 mph and snow drifts up to 8 feet high." This storm was a classic example of a nor'easter, but the storm would not have been as historically significant without the presence of the arctic high pressure system located to the north of New York. It was followed by another storm, an Alberta Clipper, on January 12, then unusually warm weather and torrential rain which caused rapid melting and river flooding in the Northeast Floods later that month. Along with the March Superstorm of 1993 and the January 2016 United States blizzard, it is one of only three snowstorms to receive the top rating of 5, or "Extreme", on the Northeast Snowfall Impact Scale (NESIS).

The North American blizzard of 2006 was a nor'easter that began on the evening of February 11, 2006. It dumped heavy snow across the Mid-Atlantic and New England states, from Virginia to Maine through the early evening of February 12, and ended in Atlantic Canada on February 13. The major cities from Baltimore to Boston received at least a foot of snow, with a second-highest amount of 26.9 inches (68 cm) in New York City, the most since at least 1869, the start of record keeping, only broken by the January 2016 United States blizzard nearly 10 years later.

The February 25–27, 2010 North American blizzard was a winter storm and severe weather event that occurred in the Mid-Atlantic and New England regions of the United States between February 24 and 26, 2010. The storm dropped its heaviest snow of 12 to 24 inches across a wide area of interior New England, New York, and Pennsylvania. The storm also brought flooding rains to coastal sections of New England, with some areas experiencing as much as 4 inches (10 cm). Aside from precipitation, the Nor'easter brought hurricane-force sustained winds to coastal New England.

Global storm activity of 2008 profiles the major worldwide storms, including blizzards, ice storms, and other winter events, from January 1, 2008 to December 31, 2008. A winter storm is an event in which the dominant varieties of precipitation are forms that only occur at cold temperatures, such as snow or sleet, or a rainstorm where ground temperatures are cold enough to allow ice to form. It may be marked by strong wind, thunder and lightning, heavy precipitation, such as ice, or wind transporting some substance through the atmosphere. Major dust storms, Hurricanes, cyclones, tornados, gales, flooding and rainstorms are also caused by such phenomena to a lesser or greater existent.

The December 1969 nor'easter was a strong winter storm that mainly affected the Northeastern United States and southern Quebec between December 25 and December 28, 1969. The multi-faceted storm system included a tornado outbreak, record snow accumulations, a damaging ice storm, and flooding rains.
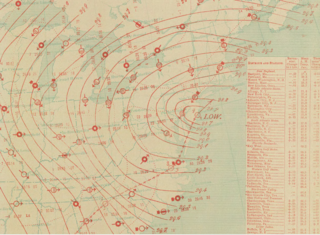
The January 1886 blizzard in North America was caused by a strong extratropical cyclone which initially dropped southeast across Texas before strengthening while it moved through the South and East, near the Eastern Seaboard through New England. The cyclone was at its strongest as it moved by New Jersey. This system formed within an active pattern which brought significant snow to the southern Rockies over many days. The system brought high winds and snowfall near and west of its path, resulting in blizzard conditions across portions of the Plains and East. A significant cold spell was ushered in by this system across portions of the southern and eastern United States. A slightly stronger storm on January 3, 1913, broke January low sea level pressure records originally set by this storm.

The 2015–16 North American winter was not as frigid across North America and the United States as compared to the 2013–14 and 2014–15 winters. This was mainly due to a strong El Niño, which caused generally warmer-than-average conditions. However, despite the warmth, significant weather systems still occurred, including a snowstorm and flash flooding in Texas at the end of December and a large tornado outbreak at the end of February. The main event of the winter season, by far and large, was when a crippling and historic blizzard struck the Northeastern United States in late January, dumping up to 3 feet of snow in and around the metropolitan areas. Several other smaller snow events affected the Northeast as well, but for the most part the heaviest snowstorms and ice stayed out further west, such as a severe blizzard in western Texas in late December, and a major late-season snowstorm in Colorado in mid-April.

The 2011–12 North American winter by and large saw above normal average temperatures across North America, with the Contiguous United States encountering its fourth-warmest winter on record, along with an unusually low number of significant winter precipitation events. The primary outlier was Alaska, parts of which experienced their coldest January on record.

The 2017–18 North American winter saw weather patterns across North America that were very active, erratic, and protracted, especially near the end of the season, resulting in widespread snow and cold across the continent during the winter. Significant events included rare snowfall in the South, an outbreak of frigid temperatures that affected the United States during the final week of 2017 and early weeks of January, and a series of strong nor'easters that affected the Northeastern United States during the month of March. In addition, flooding also took place during the month of February in the Central United States. Finally the winter came to a conclusion with a powerful storm system that caused a tornado outbreak and blizzard in mid-April. The most intense event, however, was an extremely powerful cyclonic blizzard that impacted the Northeastern United States in the first week of 2018. Similar to the previous winter, a La Niña was expected to influence the winter weather across North America.

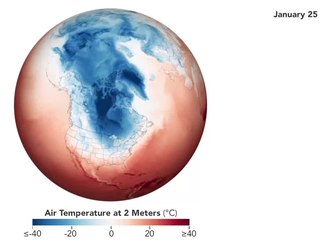
The January 2018 North American blizzard caused widespread severe disruption and blizzard conditions across much of the East Coasts of the United States and Canada in early January 2018. The storm dropped up to 2 feet of snow in the Mid-Atlantic states, New England, and Atlantic Canada, while areas as far south as southern Georgia and far northern Florida had brief wintry precipitation, with 0.1 inches of snow measured officially in Tallahassee, Florida. The storm originated on January 3 as an area of low pressure off the coast of the Southeast. Moving swiftly to the northeast, the storm explosively deepened while moving parallel to the Eastern Seaboard, causing significant snowfall accumulations. The storm received various unofficial names, such as Winter Storm Grayson, Blizzard of 2018 and Storm Brody. The storm was also dubbed a "historic bomb cyclone".
The 2018–19 North American winter was unusually cold within the Northern United States, with frigid temperatures being recorded within the middle of the season. Several notable events occurred, such as a rare snow in the Southeast in December, a strong cold wave and several major winter storms in the Midwest, and upper Northeast and much of Canada in late January and early February, record snowstorms in the Southwest in late February, deadly tornado outbreaks in the Southeast and a historic mid-April blizzard in the Midwest, but the most notable event of the winter was a record-breaking bomb cyclone that affected much of the Central United States and Canada in mid-March. Unlike previous winters, a developing weak El Niño was expected to influence weather patterns across North America. Overall, however, winter of 2018–19 was mild along the mid- and lower parts of the East Coast, the West Coast, and most of the southern Plains. Overall, the meteorological winter of 2018-19 became the wettest on record for the United States.

The 2019–20 North American winter was unusually warm for many parts of the United States; in many areas, neutral ENSO conditions controlled the weather patterns, resulting in the sixth-warmest winter on record, and many areas in the Northeastern United States saw one of the least snowy winters in years. In fact, Baltimore and Islip saw no snow in February for the first time. Some notable events still occurred, such as a powerful blizzard that impacted the Western United States in late November, a series of cold shots in January and February, a snowstorm within the Texas Panhandle and a late-season blizzard in the High Plains.
The November 26 – December 3, 2019 North American blizzard was a major winter storm from the Rocky Mountains to the Northeast as well as a record-breaking windstorm along the West Coast. It occurred the week of American Thanksgiving, hampering travel for millions across the United States.

The 2020–21 North American winter was the most significant winter season to affect North America in several years, and the costliest on record, with a damage total of at least $33.35 billion. The season featured 6 storms ranking on the Regional Snowfall Index scale, with 4 storms ranking as at least a Category 3. Most of the winter's damage and fatalities occurred due to a historic and major cold wave in mid-February. Several other significant events occurred, including a crippling early-season ice storm in the Southern Plains, a powerful nor'easter in mid-December, another major nor'easter in early February, two major and widespread winter storms in mid-February, and a major blizzard in the Rocky Mountains in mid-March. The winter-related events were responsible for at least 358 fatalities, making it the deadliest season since 1992–93. A La Niña pattern influenced much of the winter in North America.

Hurricane Zeta was a late-season major hurricane in 2020 that made landfall on the Yucatán Peninsula and then in southeastern Louisiana, the latest on record to do so at such strength in the United States. Zeta was the record-tying sixth hurricane of the year to make landfall in the United States. The twenty-seventh named storm, twelfth hurricane and fifth major hurricane of the extremely active 2020 Atlantic hurricane season, Zeta formed from a broad area of low pressure that formed in the western Caribbean Sea on October 19. After battling wind shear, the quasi-stationary low organized into Tropical Depression Twenty-Eight on October 24. The system strengthened into Tropical Storm Zeta early on October 25 before becoming a hurricane the next day as it began to move northwestward. Hurricane Zeta made landfall on the Yucatán Peninsula late on October 26 and weakened while inland to a tropical storm, before moving off the northern coast of the peninsula on October 27. After weakening due to dry air entrainment, Zeta reorganized and became a hurricane again, and eventually a Category 2 hurricane, as it turned northeastward approaching the United States Gulf Coast on October 28. It continued to strengthen until it reached its peak intensity as a major Category 3 hurricane with 115-mile-per-hour (185 km/h) sustained winds and a minimum pressure of 970 mbar (28.64 inHg) as it made landfall at Cocodrie, Louisiana, that evening. Zeta continued on through Mississippi and parts of Alabama with hurricane-force winds. Zeta gradually weakened as it accelerated northeastward, and became post-tropical on October 29, as it moved through central Virginia, dissipating shortly afterwards off the coast of New Jersey. After bringing accumulating snow to parts of New England, the extratropical low-pressure system carrying Zeta's remnant energy impacted the United Kingdom on November 1 and 2.
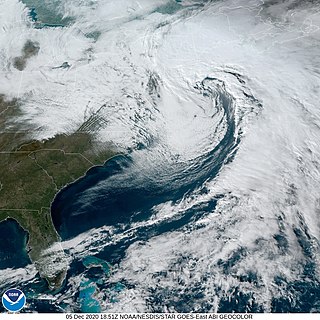
The December 5–6, 2020 nor'easter brought heavy snowfall, hurricane-force wind gusts, blizzard conditions, and coastal flooding to much of New England in the first few days of December 2020. The system originated on the Mid-Atlantic coast late on December 4. It then moved up the East Coast of the United States from December 5–6, bombing out and bringing heavy wet snow to the New England states. It brought up to 18 inches (46 cm) of snow in northern New England, with widespread totals of 6–12 inches (15–30 cm) farther south.

The 2021–22 North American winter was not as significant and record-breaking as the previous winter season. Despite this, several notable and significant events still occurred, including two separate record-breaking tornado outbreaks in mid-December, a significant winter storm in the South in mid-January, a powerful blizzard that impacted the Northeast coast at the end of January and a wide-ranging, significant winter storm that affected most of the eastern half of the country in early February. Additional significant events included a late-season winter storm in March that affected the Appalachian Mountains, and a major blizzard that affected North and South Dakota in mid-April. Additionally, a very late out-of-season snowstorm struck the Rocky Mountains in late May. During the season, four storms have been ranked on the Regional Snowfall Index (RSI), although none attained the “Major” category. Similar to the previous winter, a developing La Niña was expected to influence weather patterns across the continent.
