List of Indian states and territories by Human Development Index

Last updated

Map of the Indian states and territories by HDI in 2017 (published in 2018). Indian States & Union Territories by HDI (2018).png
Map of the Indian states and territories by HDI in 2017 (published in 2018).

The national average HDI for India in 2008 was 0.467. [1] By 2010, its average HDI had risen to 0.519. [2] [3] UNDP, the sponsor of Human Development Index methodology since 1990, reported India's HDI to be 0.554 for 2012, [4] an 18% increase over its 2008 HDI. United Nations declared India's HDI is 0.586 in 2014, [5] a 5.77% increase over 2012. As for the year 2018, HDI for India stood at 0.647. [6] [7] [8]

Contents

HDI is composite index that takes into consideration (1) health, (2) Education and (3) Per capita income.

List

This is a list of Indian states and union territories by Human Development Index as of 2018. [7]

RankState/Union TerritoryHDI (2018)Comparable country
High human development
1 Kerala 0.779Flag of Sri Lanka.svg  Sri Lanka
2 Chandigarh 0.775Flag of Antigua and Barbuda.svg  Antigua and Barbuda
3 Goa 0.761Flag of Brazil.svg  Brazil
4 Lakshadweep 0.750Flag of Ukraine.svg  Ukraine
5 Delhi 0.746Flag of the Dominican Republic.svg  Dominican Republic
6 Andaman and Nicobar Islands 0.739Flag of Tunisia.svg  Tunisia
7 Puducherry 0.738
8 Himachal Pradesh 0.725Flag of Saint Vincent and the Grenadines.svg  Saint Vincent and the Grenadines
9 Punjab 0.723Flag of Jordan.svg  Jordan
10 Sikkim 0.716Flag of Maldives.svg  Maldives
11 Daman and Diu 0.708Flag of Libya.svg  Libya
Haryana
Tamil Nadu
14 Mizoram 0.705Flag of Indonesia.svg  Indonesia
Medium human development
15 Maharashtra 0.696Flag of Egypt.svg  Egypt
Manipur
17 Jammu and Kashmir 0.688Flag of Vietnam.svg  Vietnam
18 Uttarakhand 0.684
19 Karnataka 0.682
20 Nagaland 0.679Flag of Morocco.svg  Morocco
21 Gujarat 0.672Flag of Kyrgyzstan.svg  Kyrgyzstan
22 Telangana 0.669Flag of Guyana.svg  Guyana
23 Dadra and Nagar Haveli 0.663Flag of El Salvador.svg  El Salvador
24 Tripura 0.658Flag of El Salvador.svg  El Salvador
25 Arunachal Pradesh 0.660Flag of Tajikistan.svg  Tajikistan
26 Meghalaya 0.656Flag of Tajikistan.svg  Tajikistan
27 Andhra Pradesh 0.650Flag of Cape Verde.svg  Cape Verde
Flag of India.svg  India (average)0.647Flag of Nicaragua.svg  Nicaragua
28 West Bengal 0.641Flag of Namibia.svg  Namibia
29 Rajasthan 0.629Flag of East Timor.svg  East Timor
30 Assam 0.614Flag of Bangladesh.svg  Bangladesh
31 Chhattisgarh 0.613Flag of Federated States of Micronesia.svg  Federated States of Micronesia
32 Odisha 0.606

Flag of Sao Tome and Principe.svg  São Tomé and Príncipe

33 Madhya Pradesh 0.606

Flag of Sao Tome and Principe.svg  São Tomé and Príncipe

34 Jharkhand 0.599Flag of Laos.svg  Laos
35 Uttar Pradesh 0.596Flag of Ghana.svg  Ghana
36 Bihar 0.576Flag of Angola.svg  Angola

Human Development Index (by UN Method) of Indian states since 1990 (2018 revision). [7]

StateHDI 1990HDI 1995HDI 2000HDI 2005HDI 2010HDI 2015HDI 2018
Northern India
Chandigarh 0.6330.6410.6380.6630.6480.7340.775
New Delhi 0.5770.6200.6640.6900.7090.7300.746
Haryana 0.4670.5060.5490.5910.6340.6860.708
Himachal Pradesh 0.4790.5300.5890.6440.6670.7040.725
Jammu and Kashmir 0.4930.5110.5280.5870.6400.6740.688
Madhya Pradesh 0.4060.4330.4600.5010.5380.5850.606
Punjab 0.4960.5360.5780.6150.6570.7030.723
Uttar Pradesh 0.3970.4290.4630.5040.5350.5770.596
Uttarakhand 0.6290.6350.6300.6560.6410.6640.684
Western India
Dadra and Nagar Haveli 0.6720.6830.6840.7090.6960.6630.663
Daman and Diu 0.6510.6620.6640.6880.6770.6900.708
Goa 0.5520.5810.6140.6710.7370.7540.761
Gujarat 0.4700.4980.5270.5730.6060.6510.672
Maharashtra 0.4930.5250.5580.6020.6440.6800.696
Rajasthan 0.4030.4360.4690.5100.5480.6050.629
Eastern India
Andaman and Nicobar Islands 0.6830.6930.6940.7200.7070.7210.739
West Bengal 0.4400.4730.5050.5390.5720.6190.641
Bihar 0.3780.4070.4360.4700.5140.5570.576
Chhattisgarh 0.5620.5690.5640.5880.5740.5940.613
Jharkhand 0.5620.5680.5640.5880.5740.5840.599
Odisha 0.4000.4290.4580.4940.5350.5850.606
Northeastern India
Assam 0.4110.4470.4880.5310.5670.5980.614
Arunachal Pradesh 0.4370.4710.5020.5350.6410.6610.660
Manipur 0.4950.5260.5590.5980.6810.6940.696
Meghalaya 0.4560.4690.4770.5330.6200.6480.656
Mizoram 0.5250.5470.5690.6300.6860.6980.705
Nagaland 0.5310.5330.5220.5570.6610.6790.679
Sikkim 0.5410.5480.5480.5900.6330.6910.716
Tripura 0.4470.4880.5310.5610.6080.6430.658
Southern India
Andhra Pradesh 0.4240.4500.4780.5300.5800.6290.650
Karnataka 0.4440.4790.5180.5650.6050.6590.682
Kerala 0.5440.5680.5980.6780.7240.7570.779
Lakshadweep 0.6930.7040.7050.7310.7170.7320.750
Puducherry 0.7170.7300.7300.7570.7430.7300.738
Tamil Nadu 0.4710.5040.5420.5990.6460.6890.708
Telangana 0.6220.6300.6270.6520.6380.6510.669
India0.4310.4630.4980.5390.5820.6270.647

Trend analysis by Indian National Development Reports

Compared with the previous Indian National Human Development Reports and the latest state-level government statistical report, India has significantly improved its HDI in all of its administrative subdivisions:

Legend

Very High/High Human Development Index

  0.850–0.899
  0.800–0.849
  0.750–0.799
  0.700–0.749

Medium human development index

  0.650–0.699
  0.600–0.649
  0.550–0.599
  0.500–0.549

Low human development index

  0.450–0.499
  0.400–0.449
  0.350–0.399
  0.300–0.349
  0.250–0.299
  ≤0.250
  Lack of information
Human Development Index map for Indian states in 2006, as calculated by Government of India and UNDP India. 2006 Human Development Index for India map by states, HDI data by GoI and UNDP India.svg
Human Development Index map for Indian states in 2006, as calculated by Government of India and UNDP India.

This is a list of Indian states by their respective Human Development Index (HDI), as of 2008. [1] Kerala stands first in Human Development Index among the states in India.

Consumption-based HDI

There are many ways to calculate HDI, and its calculation is sensitive to base data and assumptions. Using another approach, UNDP India and Government of India calculated the HDI nationwide average to be 0.605 in 2006. [10] This data was published by the Indian Government. [1] Note that the 2007-2008 HDI values in the table below is not based on income as is the UNDP standard practice for global comparisons, but on estimated consumption expenditure – an assumption which underestimates the HDI than actual. [11] Further, data was unavailable for the following states and union territories: Chandigarh, Lakshadweep, Andaman and Nicobar Islands, Daman and Diu, Puducherry, and Dadra and Nagar Haveli. [12] [13]

RankState/Union Territoryconsumption
based HDI [14]
(2007–08)
1 Kerala 0.810
2 Delhi 0.750
3 Himachal Pradesh 0.652
4 Goa 0.617
5 Punjab 0.605
6 Northeast India (excluding Assam)0.573
7 Maharashtra 0.572
8 Tamil Nadu 0.570
9 Haryana 0.552
10 Jammu and Kashmir 0.542
11 Gujarat 0.527
12 Karnataka 0.519
National average0.513
13 West Bengal 0.492
14 Uttarakhand 0.490
15 Andhra Pradesh 0.473
16 Assam 0.444
17 Rajasthan 0.434
18 Uttar Pradesh 0.380
19 Jharkhand 0.376
20 Madhya Pradesh 0.375
21 Bihar 0.367
22 Odisha 0.362
23 Chhattisgarh 0.358

Related Research Articles

Economy of Bhutan

The economy of Bhutan, one of the world's smallest and least developed countries, is based on agriculture and forestry, which provide the main livelihood for more than 60% of the population. Agriculture consists largely of subsistence farming and animal husbandry. Rugged mountains dominate the terrain and make the building of roads and other infrastructure difficult and expensive.

Human capital is the stock of habits, knowledge, social and personality attributes embodied in the ability to perform labour so as to produce economic value.

Developed country Country with a developed industry and infrastructure

A developed country, industrialized country, more developed country (MDC), or more economically developed country (MEDC), is a sovereign state that has a developed economy and advanced technological infrastructure relative to other less industrialized nations. Most commonly, the criteria for evaluating the degree of economic development are gross domestic product (GDP), gross national product (GNP), the per capita income, level of industrialization, amount of widespread infrastructure and general standard of living. Which criteria are to be used and which countries can be classified as being developed are subjects of debate.

Human Development Index Composite statistic of life expectancy, education, and income indices

The Human Development Index (HDI) is a statistic composite index of life expectancy, education, and per capita income indicators, which are used to rank countries into four tiers of human development. A country scores a higher HDI when the lifespan is higher, the education level is higher, and the gross national income GNI (PPP) per capita is higher. It was developed by Pakistani economist Mahbub ul Haq and was further used to measure a country's development by the United Nations Development Programme (UNDP)'s Human Development Report Office.

Kerala model

The Kerala model of development is a model of development based on the practices adopted in the state of Kerala, India. It is characterized by achievements in social indicators such as education, healthcare, high life expectancy, low infant mortality and low birth rate, by the creation of productive social infrastructure rather than materialistic infrastructure. Kerala has achieved material conditions of living, reflected in indicators of social development comparable to those of developed countries, even though the state's per capita income is low. These achievements along with the factors responsible for such achievements have been considered characteristic results of the Kerala model.

The Human Poverty Index (HPI) was an indication of the poverty of community in a country, developed by the United Nations to complement the Human Development Index (HDI) and was first reported as part of the Human Deprivation Report in 1997. It was considered to better reflect the extent of deprivation in deprived countries compared to the HDI. In 2010 it was supplanted by the UN's Multidimensional Poverty Index.

Human Development Report

The Human Development Report (HDR) is an annual report published by the Human Development Report Office of the United Nations Development Programme (UNDP).

Human development is the process characterized by the variation of material conditions. These conditions influence the possibilities of satisfying needs and desires. They also explore and realize the physical and psychic, biological and cultural, individual and social potentials of each person. It is also the name of the science that seeks to understand how and why the people of all ages and circumstances change or remain the same over time. It involves studies of the human condition with its core being the capability approach. The inequality adjusted Human Development Index is used as a way of measuring actual progress in human development by the United Nations. It is an alternative approach to a single focus on economic growth, and focused more on social justice, as a way of understanding progress.

Gender inequality in India

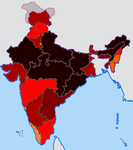
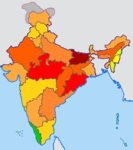
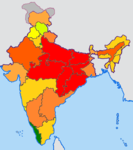
Gender inequality in India refers to health, education, economic and political inequalities between men and women in India. Various international gender inequality indices rank India differently on each of these factors, as well as on a composite basis, and these indices are controversial.

Multidimensional Poverty Index

Multidimensional Poverty Indices use a range of indicators to calculate a summary poverty figure for a given population, in which a larger figure indicates a higher level of poverty. This figure considers both the proportion of the population that is deemed poor, and the 'breadth' of poverty experienced by these 'poor' households, following the Alkire & Foster 'counting method'. The method was developed following increased criticism of monetary and consumption based poverty measures, seeking to capture the deprivations in non-monetary factors that contribute towards well-being. While there is a standard set of indicators, dimensions, cutoffs & thresholds used for a 'Global MPI', the method is flexible and there are many examples of poverty studies that modify it to best suit their environment. The methodology has been mainly, but not exclusively, applied to developing countries.

Gender Inequality Index

The Gender Inequality Index (GII) is an index for measurement of gender disparity that was introduced in the 2010 Human Development Report 20th anniversary edition by the United Nations Development Programme (UNDP). According to the UNDP, this index is a composite measure to quantify the loss of achievement within a country due to gender inequality. It uses three dimensions to measure opportunity cost: reproductive health, empowerment, and labor market participation. The new index was introduced as an experimental measure to remedy the shortcomings of the previous indicators, the Gender Development Index (GDI) and the Gender Empowerment Measure (GEM), both of which were introduced in the 1995 Human Development Report.

Sustainable Development Goals Set of 17 global development goals defined by the United Nations for the year 2030

The Sustainable Development Goals (SDGs) or Global Goals are a collection of 17 interlinked goals designed to be a "blueprint to achieve a better and more sustainable future for all". The SDGs were set in 2015 by the United Nations General Assembly and are intended to be achieved by the year 2030. They are included in a UN Resolution called the 2030 Agenda or what is colloquially known as Agenda 2030.

Santosh Mehrotra is a human development economist, whose research and writings have had most influence in the areas of labour, employment, skill development, child poverty, and the economics of education. He was an economic adviser in the United Nations system in New York City, Italy, and Thailand (1991–2006), and technocrat in the government of India (2006–2014), apart from making contributions to academic research since the mid-1980s. He has also in recent years established a reputation as an institution-builder in the field of research in India, despite facing difficult odds. He brings a combination of professional experience: with the Indian government as a policy maker and adviser, with international organisations as a technical expert, having lived on three continents and travelled to 63 countries providing technical advice to governments; and as an academic whose research work has been translated into French, Spanish, Portuguese, Italian and German.

References

  1. 1 2 3 "India Human Development Report 2011 (Towards Social Inclusion)" (PDF). IAMR, Planning Commission, Government of India. p. 257. Archived from the original (PDF) on 5 March 2016. Retrieved 5 April 2014.
  2. "Selected Socio-Economic Statistics India, 2011" (PDF). Ministry of Statistics and Programme Implementation, Government of India. October 2011. Table 11.1, page 165. Archived from the original (PDF) on 3 March 2016. Retrieved 24 January 2015.
  3. "India Human Development Report 2011 (Towards Social Inclusion)" (PDF). IAMR, Planning Commission, Government of India. p. 17. Archived from the original (PDF) on 5 March 2016. Retrieved 2 July 2014.
  4. Human Development Report 2013 UNDP, page 64, Tabel 3.1
  5. "Human Development Report 2014 – Sustaining Human Progress: Reducing Vulnerabilities and Building Resilience". United Nations Development Programme. Retrieved 24 January 2016.
  6. "India slips in human development index". The Hindu. Retrieved 14 September 2017.
  7. 1 2 3 "Sub-national HDI - Area Database - Global Data Lab". hdi.globaldatalab.org. Retrieved 24 October 2018.
  8. "| Human Development Reports". hdr.undp.org. Retrieved 16 February 2019.
  9. "Gendering Human Development Indices" (PDF). Ministry of Women and Child Development, Government of India with UNDP India. March 2009.
  10. Gendering Human Development Indices, Ministry of Women and Child Development, Govt of India with UNDP India (2009)
  11. "India Human Development Report 2011 (Towards Social Inclusion)" (PDF). IAMR, Planning Commission, Government of India. p. 24. Archived from the original (PDF) on 5 March 2016. Retrieved 2 July 2014.
  12. "Meghalaya Human Development Report 2008" (PDF). p. 23.
  13. "General Reports: Planning Commission, Government of India". planningcommission.nic.in. Archived from the original on 4 March 2016. Retrieved 24 January 2016.
  14. "India Human Development Report 2011 (Towards Social Inclusion) – Summary" (PDF). IAMR, Planning Commission, Government of India. p. 2. Retrieved 27 October 2014.