

This is a list of countries by current account balance .
This is a list of countries by current account balance .
This is a list of the 20 countries and territories with the largest surplus in current account balance (CAB), based on data from 2019 est. as listed in the CIA World Factbook. [1]
| Rank | Economy | CAB (million US dollars) | Year |
|---|---|---|---|
| 1 | 280,238 | 2019 EST. | |
| 2 | 185,644 | 2019 EST. | |
| 3 | 141,335 | 2019 EST. | |
| 4 | 90,207 | 2019 EST. | |
| 5 | 79,937 | 2019 EST. | |
| 6 | 65,311 | 2019 EST. | |
| 7 | 65,173 | 2019 EST. | |
| 8 | 63,109 | 2019 EST. | |
| 9 | 59,971 | 2019 EST. | |
| 10 | 59,517 | 2019 EST. | |
| 11 | 37,033 | 2019 EST. | |
| 12 | 30,935 | 2019 EST. | |
| 13 | 29,603 | 2019 EST. | |
| 14 | 26,470 | 2017 EST. | |
| 15 | 22,469 | 2019 EST. | |
| 16 | 22,339 | 2019 EST. | |
| 17 | 20,642 | 2020 EST. | |
| 18 | 16,750 | 2017 EST. | |
| 19 | 16,656 | 2019 EST. | |
| 20 | 15,230 | 2017 EST. | |

This is a list of the 20 countries and territories with the largest deficit in current account balance (CAB), based on data from 2019 est. as listed in the CIA World Factbook. [1]
| Rank | Country | CAB (Million US dollars) | Year |
|---|---|---|---|
| 1 | -480,225 | 2019 EST. | |
| 2 | -121,921 | 2019 EST. | |
| 3 | -57,594 | 2019 EST. | |
| 4 | -50,927 | 2019 EST. | |
| 5 | -44,954 | 2019 EST. | |
| 6 | -35,425 | 2019 EST. | |
| 7 | -30,359 | 2019 EST. | |
| 8 | -29,748 | 2019 EST. | |
| 9 | -22,100 | 2017 EST. | |
| 10 | -18,102 | 2019 EST. | |
| 11 | -13,748 | 2019 EST. | |
| 12 | -12,370 | 2017 EST. | |
| 13 | -11,389 | 2019 EST. | |
| 14 | -10,933 | 2019 EST. | |
| 15 | -10,760 | 2017 EST. | |
| 16 | -10,626 | 2019 EST. | |
| 17 | -8,915 | 2019 EST. | |
| 18 | -7,206 | 2019 EST. | |
| 19 | -7,143 | 2019 EST. | |
| 20 | -6,962 | 2019 EST. |
This is a list of the 20 countries and territories with the largest deficit in gross domestic product (GDP), based on data from 2017 est. as listed in the CIA World Factbook. [2]
| Rank | Country | Deficit (As % of GDP) | Year |
|---|---|---|---|
| 1 | -75.7 | 2017 EST. | |
| 2 | -64.1 | 2017 EST. | |
| 3 | -46.1 | 2017 EST. | |
| 4 | -25.1 | 2017 EST. | |
| 5 | -17.3 | 2017 EST. | |
| 6 | -15.1 | 2017 EST. | |
| 7 | -13.8 | 2017 EST. | |
| 8 | -12.6 | 2017 EST. | |
| 9 | -10.8 | 2017 EST. | |
| 10 | -10.6 | 2017 EST. | |
| 11 | -10.1 | 2017 EST. | |
| 11 | -10.1 | 2017 EST. | |
| 13 | -10 | 2017 EST. | |
| 14 | -9.8 | 2017 EST. | |
| 15 | -9.6 | 2017 EST. | |
| 15 | -9.6 | 2017 EST. | |
| 17 | -9.2 | 2017 EST. | |
| 18 | -9 | 2017 EST. | |
| 19 | -8.9 | 2017 EST. | |
| 20 | -8.7 | 2017 EST. |
This table shows the account balance of both the Euro Area and the European Union as a whole, according to data from Eurostat (in EUR). [3]
| Rank | Country | CAB (million Euros) | Year |
|---|---|---|---|
| 1 | | 386,567 | 2017 |
| 2 | 201,910 | 2017 | |
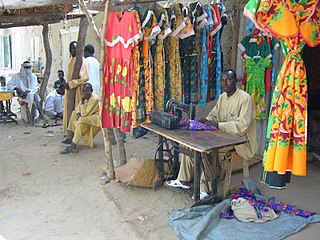
The economy of Chad suffers from the landlocked country's geographic remoteness, drought, lack of infrastructure, and political turmoil. About 85% of the population depends on agriculture, including the herding of livestock. Of Africa's Francophone countries, Chad benefited least from the 50% devaluation of their currencies in January 1994. Financial aid from the World Bank, the African Development Bank, and other sources is directed largely at the improvement of agriculture, especially livestock production. Because of lack of financing, the development of oil fields near Doba, originally due to finish in 2000, was delayed until 2003. It was finally developed and is now operated by ExxonMobil. In terms of GDP Chad ranks 143rd global.

The economy of Grenada is a largely tourism-based, small and open economy. Over the past two decades, the main thrust of Grenada's economy has shifted from agriculture to services, with tourism serving as the leading foreign currency earning sector. The country's principal export crops are the spices nutmeg and mace. Other crops for export include cocoa, citrus fruits, bananas, cloves, and cinnamon. Manufacturing industries in Grenada operate mostly on a small scale, including production of beverages and other foodstuffs, textiles, and the assembly of electronic components for export.

The economy of Latvia is an open economy in Eastern Europe and is part of the European Single Market. Latvia is a member of the World Trade Organization (WTO) since 1999, a member of the European Union since 2004, a member of the Eurozone since 2014 and a member of the OECD since 2016. Latvia is ranked the 14th in the world by the Ease of Doing Business Index prepared by the World Bank Group. According to the Human Development Report 2011, Latvia belongs to the group of very high human development countries. Due to its geographical location, transit services are highly developed, along with timber and wood-processing, agriculture and food products, and manufacturing of machinery and electronic devices.

The economy of Luxembourg is largely dependent on the banking, steel, and industrial sectors. Luxembourgers enjoy the highest per capita gross domestic product in the world.
The economy of Romania is a high-income mixed economy with a skilled labour force, ranked 10th in the European Union by total nominal GDP and 7th largest when adjusted by purchasing power parity.
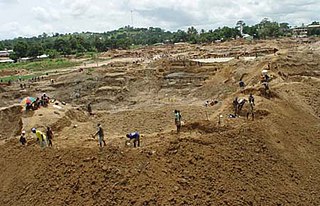
The economy of Sierra Leone is that of a least developed country with a gross domestic product (GDP) of approximately US$1.9 billion in 2009. Since the end of the Sierra Leone Civil War in 2002 the economy is gradually recovering with a GDP growth rate between 4 and 7%. In 2008 its GDP in PPP ranked between 147th and 153rd (CIA) largest in the world.

The economy of Slovenia is a developed economy, and the country enjoys a high level of prosperity and stability as well as above-average GDP per capita by purchasing power parity at 83% of the EU28 average in 2015. Nominal GDP in 2018 is 42.534 billion EUR, nominal GDP per capita (GDP/pc) in 2018 is EUR 21,267. The highest GDP/pc is in central Slovenia, where the capital city Ljubljana is located. It is part of the Western Slovenia statistical region, which has a higher GDP/pc than eastern Slovenia.

The economy of the United Kingdom is a highly developed social market and market-oriented economy. It is the fifth-largest national economy in the world measured by nominal gross domestic product (GDP), tenth-largest by purchasing power parity (PPP), and twenty first-highest by GDP per capita, constituting 3.3% of world GDP.
The economy of Belgium is a modern, capitalist economy that has capitalised on the country's central geographic location, highly developed transport network, and diversified industrial and commercial base. Belgium was the first country to undergo an Industrial Revolution on the continent of Europe in the early 19th century. It has since developed an excellent transportation infrastructure of ports, canals, railways, and highways, in order to integrate its industry with that of its neighbours. Industry is concentrated mainly in the populous region of Flanders in the north, around Brussels and in the two biggest Walloon cities, Liège and Charleroi, along the sillon industriel. Belgium imports raw materials and semi-finished goods that are further processed and re-exported. Except for its coal, which is no longer economical to exploit, Belgium has few natural resources other than fertile soils. Nonetheless, most traditional industrial sectors are represented in the economy, including steel, textiles, refining, chemicals, food processing, pharmaceuticals, automobiles, electronics, and machinery fabrication. Despite the heavy industrial component, services account for 74.9% of GDP, while agriculture accounts for only 1% of GDP.

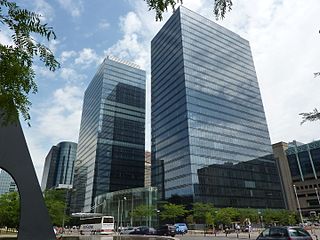
The economy of Bahrain is heavily dependent upon oil and gas. The Bahraini Dinar is the second-highest-valued currency unit in the world. Since the late 20th century, Bahrain has heavily invested in the banking and tourism sectors. The country's capital, Manama is home to many large financial structures. Bahrain's finance industry is very successful. In 2008, Bahrain was named the world's fastest growing financial center by the City of London's Global Financial Centres Index. Bahrain's banking and financial services sector, particularly Islamic banking, have benefited from the regional boom driven by demand for oil. Petroleum is Bahrain's most exported product, accounting for 60% of export receipts, 70% of government revenues, and 11% of GDP. Aluminium is the second most exported product, followed by finance and construction materials.
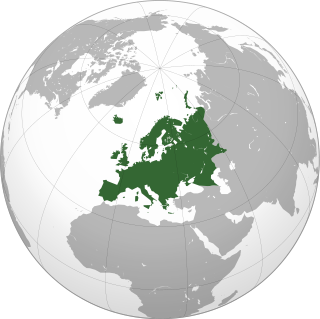
This page compares the sovereign states of Europe on economic, financial and social indicators.

In economics, a country's current account records the value of exports and imports of both goods and services and international transfers of capital. It is one of the three components of its balance of payments, the others being the capital account and the financial account. Current account measures the nation's earnings and spendings abroad and it consists of the balance of trade, net primary income or factor income and net unilateral transfers, that have taken place over a given period of time. The current account balance is one of two major measures of a country's foreign trade. A current account surplus indicates that the value of a country's net foreign assets grew over the period in question, and a current account deficit indicates that it shrank. Both government and private payments are included in the calculation. It is called the current account because goods and services are generally consumed in the current period.

The economy of the European Union is the joint economy of the member states of the European Union (EU). It is the third largest economy in the world in nominal terms, after the United States and China, and the third one in purchasing power parity (PPP) terms, after China and the United States. The European Union's GDP was estimated to be around $15 trillion (nominal) in 2020, representing around 1/6 of the global economy.

The Kosovo Agency of Statistics monitors various demographic features of the population of Kosovo, such as population density, ethnicity, education level, health of the populace, economic status, religious affiliations and other aspects of the population. Censuses, normally conducted at ten-year intervals, record the demographic characteristics of the population. According to the first census conducted after the 2008 declaration of independence in 2011, the permanent population of Kosovo had reached 1,810,366.