This list shows the government budget of each country divided by its total population, not adjusted to purchasing power parity. It is based on data from the 2018 CIA World Factbook. [1] [2] The Chinese, Brazilian, Indian, and United States government budgets used are the figures reported by the International Monetary Fund. [3]
Country | Government budget per capita (US$, nominal) | Year |
---|---|---|
Afghanistan | 189 | 2016 est. [1] |
Albania | 1,231 | 2017 est. [1] |
Algeria | 1,698 | 2017 est. [1] |
American Samoa | 4,800 | 2013 est. [1] |
Andorra | 24,035 | 2016 [1] |
Angola | 1,470 | 2017 est. [1] |
Antigua and Barbuda | 3,368 | 2017 est. [1] |
Argentina | 3,604 | 2017 est. [1] |
Armenia | 957 | 2017 est. [1] |
Aruba | 6,450 | 2016 est. [1] |
Australia | 20,660 | 2017 est. [1] |
Austria | 22,960 | 2017 est. [1] |
Azerbaijan | 1,035 | 2017 est. [1] |
Bahamas | 7,816 | 2017 est. [1] |
Bahrain | 6,433 | 2017 est. [1] |
Bangladesh | 246 | 2017 est. [1] |
Barbados | 5,628 | 2017 est. [1] |
Belarus | 2,365 | 2017 est. [1] |
Belgium | 22,470 | 2017 est. [1] |
Belize | 1,425 | 2017 est. [1] |
Benin | 199 | 2017 est. [1] |
Bermuda | 16,213 | 2016 est. [1] |
Bhutan | 1,068 | 2017 est. [1] |
Bolivia | 1,534 | 2017 est. [1] |
Bosnia and Herzegovina | 2,076 | 2017 est. [1] |
Botswana | 2,699 | 2017 est. [1] |
Brazil | 3,732 | 2017 est. [4] |
British Virgin Islands | 8,379 | 2016 est. [1] |
Brunei | 8,915 | 2017 est. [1] |
Bulgaria | 2,877 | 2017 est. [1] |
Burkina Faso | 168 | 2017 est. [1] |
Burma | 205 | 2017 est. [1] |
Burundi | 63 | 2017 est. [1] |
Cabo Verde | 816 | 2017 est. [1] |
Cambodia | 285 | 2017 est. [1] |
Cameroon | 271 | 2017 est. [1] |
Canada | 18,321 | 2017 est. [1] |
Cayman Islands | 12,279 | 2016 est. [1] |
Central African Republic | 47 | 2017 est. [1] |
Chad | 96 | 2017 est. [1] |
Chile | 3,620 | 2017 est. [1] |
China | 2,735 | 2017 est. [5] |
Colombia | 1,978 | 2017 est. [1] |
Comoros | 222 | 2017 est. [1] |
Congo, Democratic Republic of the | 39 | 2017 est. [1] |
Congo, Republic of the | 659 | 2017 est. [1] |
Costa Rica | 2,273 | 2017 est. [1] |
Cote d'Ivoire | 338 | 2017 est. [1] |
Croatia | 6,303 | 2017 est. [1] |
Cuba | 5,448 | 2017 est. [1] |
Cyprus | 6,365 | 2017 est. [1] |
Czech Republic | 7,854 | 2017 est. [1] |
Denmark | 30,209 | 2017 est. [1] |
Djibouti | 978 | 2017 est. [1] |
Dominican Republic | 1,239 | 2017 est. [1] |
Ecuador | 2,285 | 2017 est. [1] |
Egypt | 554 | 2017 est. [1] |
El Salvador | 1,091 | 2017 est. [1] |
Equatorial Guinea | 4,302 | 2017 est. [1] |
Eritrea | 435 | 2017 est. [1] |
Estonia | 7,948 | 2017 est. [1] |
Ethiopia | 134 | 2017 est. [1] |
Faroe Islands | 17,327 | 2014 est. [1] |
Fiji | 1,821 | 2017 est. [1] |
Finland | 25,409 | 2017 est. [1] |
France | 20,960 | 2017 est. [1] |
French Polynesia | 6,312 | 2012 [1] |
Gabon | 1,883 | 2017 est. [1] |
Gambia | 176 | 2017 est. [1] |
Georgia | 1,212 | 2017 est. [1] |
Germany | 19,550 | 2017 est. [1] |
Ghana | 440 | 2017 est. [1] |
Gibraltar | 15,342 | 2008 est. [1] |
Greece | 9,113 | 2017 est. [1] |
Greenland | 32,518 | 2015 [1] |
Grenada | 2,539 | 2017 est. [1] |
Guam | 7,081 | 2013 est. [1] |
Guatemala | 578 | 2017 est. [1] |
Guernsey | 7,961 | 2005 [1] |
Guinea | 157 | 2017 est. [1] |
Guinea-Bissau | 116 | 2017 est. [1] |
Guyana | 1,555 | 2017 est. [1] |
Haiti | 208 | 2017 est. [1] |
Honduras | 553 | 2017 est. [1] |
Hong Kong | 8,714 | 2017 est. [1] |
Hungary | 6,814 | 2017 est. [1] |
Iceland | 28,339 | 2017 est. [1] |
India | 559 | 2017 est. [6] |
Indonesia | 589 | 2017 est. [1] |
Iran | 1,038 | 2017 est. [1] |
Iraq | 1,899 | 2017 est. [1] |
Ireland | 17,209 | 2017 est. [1] |
Isle of Man | 10,547 | FY05/06 est. [1] |
Israel | 12,118 | 2017 est. [1] |
Italy | 14,905 | 2017 est. [1] |
Jamaica | 1,475 | 2017 est. [1] |
Japan | 14,964 | 2017 est. [1] |
Jersey | 8,544 | 2005 [1] |
Jordan | 1,129 | 2017 est. [1] |
Kazakhstan | 2,021 | 2017 est. [1] |
Kenya | 416 | 2017 est. [1] |
Kiribati | 1,645 | 2013 est. [1] |
Korea, North | 130 | 2007 est. [1] |
Korea, South | 6,573 | 2017 est. [1] |
Kosovo | 843 | 2017 est. [1] |
Kuwait | 21,049 | 2017 est. [1] |
Kyrgyzstan | 393 | 2017 est. [1] |
Laos | 566 | 2017 est. [1] |
Latvia | 5,422 | 2017 est. [1] |
Lebanon | 2,621 | 2017 est. [1] |
Lesotho | 591 | 2017 est. [1] |
Liberia | 151 | 2017 est. [1] |
Libya | 3,304 | 2017 est. [1] |
Liechtenstein | 23,088 | 2012 est. [1] |
Lithuania | 7,743 | 2017 est. [1] |
Luxembourg | 45,199 | 2017 est. [1] |
Macau | 17,399 | 2017 est. [1] |
Madagascar | 67 | 2017 est. [1] |
Malawi | 81 | 2017 est. [1] |
Malaysia | 1,894 | 2017 est. [1] |
Maldives | 2,945 | 2016 est. [1] |
Mali | 194 | 2017 est. [1] |
Malta | 9,696 | 2017 est. [1] |
Mauritania | 338 | 2017 est. [1] |
Mauritius | 2,445 | 2017 est. [1] |
Mexico | 2,500 | 2017 est. [1] |
Micronesia, Federated States of | 1,852 | FY12/13 est. [1] |
Moldova | 880 | 2017 est. [1] |
Monaco | 31,665 | 2011 est. [1] |
Mongolia | 1,195 | 2017 est. [1] |
Montenegro | 3,174 | 2016 est. [1] |
Morocco | 894 | 2017 est. [1] |
Mozambique | 132 | 2017 est. [1] |
Namibia | 1,878 | 2017 est. [1] |
Nepal | 297 | 2018 actual [7] |
Netherlands | 19,835 | 2017 est. [1] |
New Caledonia | 3,791 | 2001 est. [1] |
New Zealand | 15,817 | 2017 est. [1] |
Nicaragua | 669 | 2017 est. [1] |
Niger | 112 | 2017 est. [1] |
Nigeria | 108 | 2017 est. [1] |
North Macedonia | 1,724 | 2017 est. [1] |
Northern Mariana Islands | 4,808 | 2013 est. [1] |
Norway | 36,856 | 2017 est. [1] |
Oman | 6,951 | 2017 est. [1] |
Pakistan | 285 | 2017 est. [1] |
Panama | 3,567 | 2017 est. [1] |
Papua New Guinea | 677 | 2017 est. [1] |
Paraguay | 836 | 2017 est. [1] |
Peru | 2,089 | 2017 est. [1] |
Philippines | 505 | 2017 est. [1] |
Poland | 2,660 | 2017 est. [1] |
Portugal | 9,350 | 2017 est. [1] |
Puerto Rico | 3,027 | 2017 est. [1] |
Qatar | 23,257 | 2017 est. [1] |
Romania | 3,054 | 2017 est. [1] |
Russia | 2,022 | 2017 est. [1] |
Rwanda | 185 | 2017 est. [1] |
Saint Kitts and Nevis | 6,968 | 2017 est. [1] |
Saint Lucia | 2,604 | 2017 est. [1] |
Saint Vincent and the Grenadines | 2,621 | 2017 est. [1] |
Samoa | 1,351 | 2016 est. [1] |
San Marino | 21,107 | 2011 est. [1] |
Saudi Arabia | 8,912 | 2019 est. [1] |
Senegal | 297 | 2017 est. [1] |
Serbia | 2,391 | 2017 est. [1] |
Seychelles | 5,885 | 2017 est. [1] |
Sierra Leone | 152 | 2017 est. [1] |
Singapore | 9,421 | 2017 est. [1] |
Slovakia | 7,074 | 2017 est. [1] |
Slovenia | 9,975 | 2017 est. [1] |
Solomon Islands | 715 | 2017 est. [1] |
Somalia | 23 | 2017 est. [1] |
South Africa | 1,865 | 2017 est. [1] |
South Sudan | 221 | FY 2013 est. [1] |
Spain | 10,863 | 2017 est. [1] |
Sri Lanka | 737 | 2017 est. [1] |
Sudan | 310 | 2017 est. [1] |
Suriname | 1,347 | 2017 est. [1] |
Sweden | 26,879 | 2017 est. [1] |
Switzerland | 26,782 | 2017 est. [notes 1] [1] |
Syria | 163 | 2017 est. [1] |
Taiwan | 3,893 | 2017 est. [1] |
Tajikistan | 269 | 2017 est. [1] |
Tanzania | 167 | 2017 est. [1] |
Thailand | 1,559 | 2019 est. [1] |
Timor-Leste | 1,664 | 2017 est. [1] |
Togo | 207 | 2017 est. [1] |
Trinidad and Tobago | 6,448 | 2017 est. [1] |
Tunisia | 1,008 | 2017 est. [1] |
Turkey | 2,343 | 2017 est. [1] |
Turkmenistan | 869 | 2017 est. [1] |
Turks and Caicos Islands | 3,482 | 2016 est. [1] |
Uganda | 128 | 2017 est. [1] |
Ukraine | 885 | 2017 est. [1] |
United Arab Emirates | 11,586 | 2017 est. [1] |
United Kingdom | 17,202 | 2018 [8] |
United States | 20,674 | 2017 est. [9] |
Uruguay | 5,906 | 2017 est. [1] |
Uzbekistan | 663 | 2017 est. [1] |
Vanuatu | 718 | 2017 est. [1] |
Venezuela | 5,049 | 2017 est. [1] |
Vietnam | 714 | 2017 est. [1] |
Yemen | 182 | 2017 est. [1] |
Zambia | 428 | 2017 est. [1] |
Zimbabwe | 342 | 2017 est. [1] |
The economy of Burkina Faso is based primarily on subsistence farming and livestock raising. Burkina Faso has an average income purchasing-power-parity per capita of $1,900 and nominal per capita of $790 in 2014. More than 80% of the population relies on subsistence agriculture, with only a small fraction directly involved in industry and services. Highly variable rainfall, poor soils, lack of adequate communications and other infrastructure, a low literacy rate, and a stagnant economy are all longstanding problems of this landlocked country. The export economy also remained subject to fluctuations in world prices.
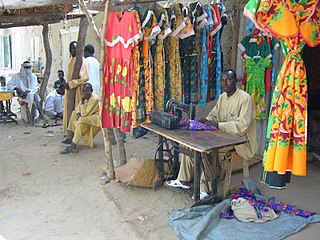
The economy of Chad suffers from the landlocked country's geographic remoteness, drought, lack of infrastructure, and political turmoil. About 85% of the population depends on agriculture, including the herding of livestock. Of Africa's Francophone countries, Chad benefited least from the 50% devaluation of their currencies in January 1994. Financial aid from the World Bank, the African Development Bank, and other sources is directed largely at the improvement of agriculture, especially livestock production. Because of lack of financing, the development of oil fields near Doba, originally due to finish in 2000, was delayed until 2003. It was finally developed and is now operated by ExxonMobil. In terms of GDP Chad ranks 143rd global.
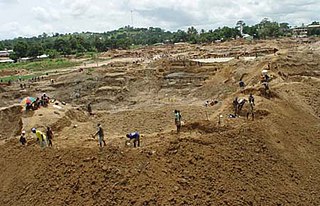
The economy of Sierra Leone is that of a least developed country with a gross domestic product (GDP) of approximately US$1.9 billion in 2009. Since the end of the Sierra Leone Civil War in 2002 the economy is gradually recovering with a GDP growth rate between 4 and 7%. In 2008 its GDP in PPP ranked between 147th and 153rd (CIA) largest in the world.
The economy of Slovenia is a developed economy, and the country enjoys a high level of prosperity and stability as well as above-average GDP per capita by purchasing power parity at 83% of the EU28 average in 2015. Nominal GDP in 2018 is 42.534 billion EUR, nominal GDP per capita (GDP/pc) in 2018 is EUR 21,267. The highest GDP/pc is in central Slovenia, where the capital city Ljubljana is located. It is part of the Western Slovenia statistical region, which has a higher GDP/pc than eastern Slovenia.
The economy of the European Union is the joint economy of the member states of the European Union (EU). It is the third largest economy in the world in nominal terms, after the United States and China, and the third one in purchasing power parity (PPP) terms, after China and the United States. The European Union's GDP was estimated to be around $15 trillion (nominal) in 2020, representing around 1/6 of the global economy.
The following are the international rankings of Taiwan.
The Arab League is rich in resources, with enormous oil and natural gas reserves. The region's instability has not affected its tourism industry, which is considered the fastest growing sector in the region, with Egypt, the United Arab Emirates, Lebanon, Saudi Arabia and Jordan leading the way. Another industry that is growing steadily in the Arab League is telecommunications. Within less than a decade, local companies such as Orascom and Etisalat have managed to successfully compete internationally as global power players.
The economy of Ivory Coast is stable and currently growing, in the aftermath of political instability in recent decades. The Ivory Coast's economy is largely market-based and depends heavily on the agricultural sector. Almost 70% of the Ivorian people are engaged in some form of agricultural activity. GDP per capita grew 82% in the 1960s, reaching a peak growth of 360% in the 1970s, but this proved unsustainable and it shrank by 28% in the 1980s and a further 22% in the 1990s. This decline, coupled with high population growth, resulted in a steady fall in living standards. The Gross national product per capita, now rising again, was about US$727 in 1996. It was substantially higher two decades before.
The following are international rankings of Myanmar (Burma).
Energy in Qatar describes energy production, consumption, and policies of the State of Qatar. The International Monetary Fund ranked Qatar as having the fifth highest GDP per capita in 2016 with a 60,787 USD per capita nominal GDP over a population of 2.421 million inhabitants. In 2014, oil and natural gas production made up 51.1% of Qatar's nominal GDP. Thus, Qatar has a worldwide high ranking of per capita GDP due to its significance production and exports in both crude oil and natural gas in proportion to its relatively small population.