List of countries by gross fixed investment as percentage of GDP

Last updated

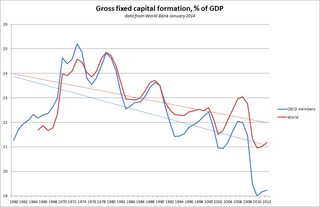
This is the list of countries by gross fixed investment of infrastructure as percentage of GDP. Gross fixed investment is defined as total business spending on fixed assets, such as factories, machinery, equipment, dwellings, and inventories of raw materials, which provide the basis for future production. It is measured gross of the depreciation of the assets, i.e., it includes investment that merely replaces worn-out or scrapped capital.

The list is based on the CIA World Factbook and World Bank data. [1] [2] Dependent territories and not fully recognized states are not ranked.

RankCountryInvestment 2017 est.
(gross fixed)
(% of GDP)
Investment 2012 est.
(gross fixed)
(% of GDP)
Investment 2008 est.
(gross fixed)
(% of GDP)
1Flag of Guinea.svg  Guinea 75.1517.411.70
2Flag of Mauritania.svg  Mauritania 58.53N/AN/A
3Flag of Suriname.svg  Suriname 56.5219.7N/A
4Flag of Bhutan.svg  Bhutan 47.16N/AN/A
5Flag of Haiti.svg  Haiti 43.363728.90
6Flag of the People's Republic of China.svg  China 41.8946.140.20
7Flag of Panama.svg  Panama 40.61
(2016 est.)
28.924.90
8Flag of Ethiopia.svg  Ethiopia 39.0026.825.40
9Flag of Zambia.svg  Zambia 36.42
(2016 est.)
19.526.00
10Flag of the Seychelles.svg  Seychelles 35.25
(2016 est.)
37.210.10
11Flag of Brunei.svg  Brunei 34.59N/AN/A
12Flag of Cape Verde.svg  Cape Verde 34.52
(2014 est.)
34.241.30
13Flag of Nepal.svg    Nepal 33.80N/AN/A
14Flag of Myanmar.svg  Burma 34.72
(2015 est.)
16.314.10
15Flag of Oman.svg  Oman 34.28
(2015 est.)
26.217.90
16Flag of Tanzania.svg  Tanzania 33.70
(2016 est.)
26.524.20
17Flag of Niger.svg  Niger 33.66N/AN/A
18Flag of Indonesia.svg  Indonesia 32.1633.223.60
19Flag of South Korea.svg  South Korea 31.1226.727.10
20Flag of Botswana.svg  Botswana 31.06
(2016 est.)
3023.90
21Flag of Tajikistan.svg  Tajikistan 30.73
(2016 est.)
16.620.00
22Flag of Bangladesh.svg  Bangladesh 30.5125.424.30
23Flag of Morocco.svg  Morocco 30.5031.431.90
24Flag of Kyrgyzstan.svg  Kyrgyzstan 30.3025.725.80
25Flag of Guyana.svg  Guyana 30.0721.640.50
26Flag of Algeria.svg  Algeria 29.8831.524.80
27Flag of Turkey.svg  Turkey 29.8120.321.00
28Flag of Georgia.svg  Georgia 29.5422.829.50
29Flag of Laos.svg  Laos 29.04N/AN/A
30Flag of Benin.svg  Benin 28.5722.619.50
31Flag of India.svg  India 28.4929.939.00
32Flag of Nicaragua.svg  Nicaragua 28.1132.832.10
33Flag of Kosovo.svg  Kosovo 27.0335
(2010 est.)
30.00
(2007 est.)
34Flag of Togo.svg  Togo 26.5525.418.40
35Flag of Sri Lanka.svg  Sri Lanka 26.3528.930.00
36Flag of the Bahamas.svg  Bahamas 26.28N/AN/A
37Flag of the Republic of the Congo.svg  Republic of the Congo 26.2651.919.30
38Flag of Vanuatu.svg  Vanuatu 25.92
(2016 est.)
N/AN/A
39Flag of Bahrain.svg  Bahrain 25.90
(2016 est.)
20.427.30
40Flag of Malaysia.svg  Malaysia 25.3025.720.70
41Flag of the Czech Republic.svg  Czech Republic 25.2323.627.80
42Flag of Albania.svg  Albania 25.222622.80
43Flag of Montenegro.svg  Montenegro 25.198.330.50
(2006 est.)
44Flag of East Timor.svg  Timor-Leste 25.17
(2016 est.)
N/AN/A
45Flag of the Philippines.svg  Philippines 25.1619.416.80
46Flag of Senegal.svg  Senegal 25.0925.525.40
47Flag of Belarus.svg  Belarus 25.0132.831.50
48Flag of Sweden.svg  Sweden 24.9218.919.60
49Flag of Djibouti.svg  Djibouti 24.91N/AN/A
50Flag of Uzbekistan.svg  Uzbekistan 25.90N/AN/A
51Flag of Singapore.svg  Singapore 24.8124.145.00
52Flag of Burkina Faso.svg  Burkina Faso 24.5720.924.50
53Flag of Switzerland.svg   Switzerland 24.502021.50
54Flag of Ecuador.svg  Ecuador 24.3526.523.30
55Flag of Norway.svg  Norway 24.0720.620.30
56Flag of New Zealand.svg  New Zealand 24.0418.923.60
57Flag of Thailand.svg  Thailand 24.02
(2016 est.)
28.522.20
58Flag of Australia (converted).svg  Australia 24.0028.527.60
59Flag of Lesotho.svg  Lesotho 23.95
(2016 est.)
37.339.20
60Flag of Mongolia.svg  Mongolia 23.77N/AN/A
61Flag of Estonia.svg  Estonia 23.7424.529.40
62Flag of Azerbaijan.svg  Azerbaijan 23.6222.521.00
63Flag of Uganda.svg  Uganda 23.5224.626.50
64Flag of Japan.svg  Japan 23.55
(2016 est.)
21.222.50
65Flag of Austria.svg  Austria 23.5121.520.70
66Flag of Ireland.svg  Ireland 23.441019.80
 World23.3223.821.90
67Flag of Belgium (civil).svg  Belgium 23.2820.721.30
68Flag of North Macedonia.svg  Macedonia 23.2621.818.00
69Flag of Malta.svg  Malta 23.17
(2016 est.)
14.620.00
70Flag of Honduras.svg  Honduras 23.0825.431.50
71Flag of Vietnam.svg  Vietnam 23.0828.244.50
72Flag of Canada (Pantone).svg  Canada 22.992422.60
73Flag of the United Arab Emirates.svg  United Arab Emirates 22.992920.80
74Flag of Rwanda.svg  Rwanda 22.9020.422.50
75Flag of Gabon.svg  Gabon 22.88
(2016 est.)
30.332.00
76Flag of Colombia.svg  Colombia 22.8523.923.10
77Flag of Kazakhstan.svg  Kazakhstan 22.72
(2016 est.)
21.127.80
78Flag of Saudi Arabia.svg  Saudi Arabia 22.6826.619.50
79Flag of Finland.svg  Finland 22.5919.420.50
80Flag of Romania.svg  Romania 22.5626.731.50
81Flag of France.svg  France 22.5119.821.00
82Flag of Palestine.svg  Palestine 22.42N/AN/A
83Flag of Mexico.svg  Mexico 22.3520.722.90
84Flag of Iceland.svg  Iceland 22.1414.421.90
85Flag of Cambodia.svg  Cambodia 21.9220.321.30
86Flag of the Dominican Republic.svg  Dominican Republic 21.9016.419.60
87Flag of Moldova.svg  Moldova 21.8621.836.10
88Flag of Hong Kong.svg  Hong Kong 21.8426.420.60
89Flag of Lebanon.svg  Lebanon 21.7832.924.10
90Flag of Russia.svg  Russia 21.692224.70
(2007 est.)
91Flag of Jamaica.svg  Jamaica 21.6720.734.90
92Flag of Mozambique.svg  Mozambique 21.6724.824.00
93Flag of Venezuela.svg  Venezuela 21.62
(2014 est.)
19.920.50
94Flag of Chile.svg  Chile 21.5624.123.70
95Flag of Cameroon.svg  Cameroon 21.5520.917.60
96Flag of Hungary.svg  Hungary 21.5217.215.20
(Jan-Sept 2008)
97Bandera de Bolivia (Estado).svg  Bolivia 21.2718.316.70
98Flag of Slovakia.svg  Slovakia 21.2021.525.90
99Flag of Cyprus.svg  Cyprus 21.1212.821.40
100Flag of Cote d'Ivoire.svg  Côte d'Ivoire 20.92159.50
101Flag of Chad.svg  Chad 20.6331.98.50
102Flag of Peru.svg  Peru 20.6026.624.40
103Flag of the Democratic Republic of the Congo.svg  Democratic Republic of the Congo 20.5814.210.80
104Flag of Spain.svg  Spain 20.5519.130.10
105Flag of Iran.svg  Iran 20.5531.827.70
106Flag of Denmark.svg  Denmark 20.3817.822.40
107Flag of Germany.svg  Germany 20.3217.618.90
108Flag of the Netherlands.svg  Netherlands 20.3016.820.30
109Flag of Israel.svg  Israel 20.26
(2016 est.)
19.118.00
110Flag of Liberia.svg  Liberia 20.09
(2016 est.)
N/AN/A
Flag of Europe.svg  European Union 20.0317.821.00
111Flag of Jordan.svg  Jordan 19.9625.934.10
112Flag of Latvia.svg  Latvia 19.932330.20
113Flag of Croatia.svg  Croatia 19.8718.431.50
114Flag of the United States.svg  United States 19.50
(2016 est.)
18.921.00
115Flag of Mali.svg  Mali 19.27N/AN/A
116Flag of Bulgaria.svg  Bulgaria 19.2121.438.30
117Flag of The Gambia.svg  Gambia 19.1727.824.70
118Flag of Paraguay.svg  Paraguay 19.0914.620.20
119Flag of Kenya.svg  Kenya 18.862221.60
120Flag of Lithuania.svg  Lithuania 18.8316.727.80
121Flag of South Africa.svg  South Africa 18.7319.220.10
122Flag of Belize.svg  Belize 18.5830.424.50
123Flag of Macau.svg  Macao 18.50N/AN/A
124Flag of Slovenia.svg  Slovenia 18.4717.427.80
125Flag of Serbia.svg  Serbia 18.4617.320.10
(2007 est.)
126Flag of Sudan.svg  Sudan 18.3327.218.10
127Flag of Poland.svg  Poland 18.0219.322.70
128Flag of the Central African Republic.svg  Central African Republic 17.67N/AN/A
129Flag of Barbados.svg  Barbados 17.71N/AN/A
130Flag of the Taliban.svg  Afghanistan 17.71
(2016 est.)
N/AN/A
131Flag of Italy.svg  Italy 17.5118.220.50
132Flag of Iraq.svg  Iraq 17.4010.1
(2011 est.)
N/A
133Flag of Armenia.svg  Armenia 17.3130.634.10
134Flag of Mauritius.svg  Mauritius 17.2723.127.10
135Flag of Costa Rica.svg  Costa Rica 17.2420.223.00
136Flag of Luxembourg.svg  Luxembourg 17.0519.919.30
137Flag of Burundi.svg  Burundi 16.87
(2016 est.)
21.828.40
138Flag of the United Kingdom.svg  United Kingdom 16.8614.216.70
139Flag of Zimbabwe.svg  Zimbabwe 16.8021.917.50
140Flag of Bosnia and Herzegovina.svg  Bosnia and Herzegovina 16.75N/AN/A
141Flag of Uruguay.svg  Uruguay 16.6721.415.10
142Flag of Tunisia.svg  Tunisia 19.65
(2016 est.)
22.324.40
143Flag of Fiji.svg  Fiji 16.39
(2016 est.)
N/AN/A
144Flag of Portugal.svg  Portugal 16.1715.821.90
145Flag of Namibia.svg  Namibia 16.0522.627.40
146Flag of Ukraine.svg  Ukraine 16.0018.923.40
147Flag of Brazil.svg  Brazil 15.6418.118.60
148Flag of El Salvador.svg  El Salvador 15.5014.216.00
149Flag of Ghana.svg  Ghana 15.272931.90
150Flag of Madagascar.svg  Madagascar 15.1518.727.20
151Flag of Egypt.svg  Egypt 14.821617.00
152Flag of Argentina.svg  Argentina 14.8121.824.00
153Flag of Pakistan.svg  Pakistan 14.4910.920.00
154Flag of Malawi.svg  Malawi 13.4313.38.60
155Flag of Nigeria.svg  Nigeria 12.70
(2016 est.)
18.421.40
156Flag of Greece.svg  Greece 12.6512.624.90
157Flag of Eswatini.svg  Swaziland 12.44
(2016 est.)
10.319.70
158Flag of Guatemala.svg  Guatemala 12.3114.620.30
159Flag of Equatorial Guinea.svg  Equatorial Guinea 11.9832.430.00
160Flag of Guinea-Bissau.svg  Guinea-Bissau 10.44N/AN/A
161Flag of Somalia.svg  Somalia 9.5320
(year N/A)
N/A
162Flag of Puerto Rico.svg  Puerto Rico 7.87
(2016 est.)
N/AN/A
163Flag of Angola.svg  Angola 7.8211.49.00
Flag of Papua New Guinea.svg  Papua New Guinea N/A20.719.90
Flag of Libya.svg  Libya N/A4.78.10
Flag of Turkmenistan.svg  Turkmenistan N/A10.611.60
Flag of Sao Tome and Principe.svg  Sao Tome and Principe N/A48.736.70
Flag of Trinidad and Tobago.svg  Trinidad and Tobago N/A15.617.10
Flag of Qatar.svg  Qatar N/A30.641.40
Flag of the Republic of China.svg  Taiwan N/A19.520.90
Flag of Cuba.svg  Cuba N/A9.611.60
Flag of Kuwait.svg  Kuwait N/A1418.40
Flag of Yemen.svg  Yemen N/A1826.30
Flag of Syria.svg  Syria N/A20.522.60
Flag of Eritrea.svg  Eritrea N/A15.221.20

Related Research Articles

Economy of Burkina Faso National economy

The economy of Burkina Faso is based primarily on subsistence farming and livestock raising. Burkina Faso has an average income purchasing-power-parity per capita of $1,900 and nominal per capita of $790 in 2014. More than 80% of the population relies on subsistence agriculture, with only a small fraction directly involved in industry and services. Highly variable rainfall, poor soils, lack of adequate communications and other infrastructure, a low literacy rate, and a stagnant economy are all longstanding problems of this landlocked country. The export economy also remained subject to fluctuations in world prices.

Economy of Eritrea

The economy of Eritrea has experienced considerable growth in recent years, indicated by an improvement in gross domestic product in 2012 of 7.5% over 2011, and has a total of $8.090 billion as of 2020. However, worker remittances from abroad are estimated to account for 32 percent of gross domestic product. Eritrea has an extensive amount of resources such as copper, gold, granite, marble, and potash. The Eritrean economy has undergone extreme changes due to the War of Independence.

Economy of Sierra Leone National economy

The economy of Sierra Leone is $4.082 billion by gross domestic product as of 2018. Since the end of the Sierra Leone Civil War in 2002, the economy is gradually recovering with a gross domestic product growth rate between 4 and 7%. In 2008 it in PPP ranked between 147th by World Bank, and 153rd by CIA, largest in the world.

The gross world product (GWP) is the combined gross national income of all the countries in the world. Because imports and exports balance exactly when considering the whole world, this also equals the total global gross domestic product (GDP). According to the World Bank, the 2013 nominal GWP was approximately 75.59 trillion United States dollars. In 2017, according to the CIA's World Factbook, the GWP was around $80.27 trillion in nominal terms and totaled approximately 127.8 trillion international dollars in terms of purchasing power parity (PPP). The per capita PPP GWP in 2017 was approximately 17,500 international dollars according to the World Factbook. According to the World Bank, the 2020 GWP in current dollars was approximately $84.705 trillion.

Economy of São Tomé and Príncipe

The economy of São Tomé and Príncipe, while traditionally dependent on cocoa, is experiencing considerable changes due to investment in the development of its oil industry in the oil-rich waters of the Gulf of Guinea.

Economy of Bahrain Economy of the country

The economy of Bahrain is heavily dependent upon oil and gas. The Bahraini Dinar is the second-highest-valued currency unit in the world. Since the late 20th century, Bahrain has heavily invested in the banking and tourism sectors. The country's capital, Manama is home to many large financial structures. Bahrain's finance industry is very successful. In 2008, Bahrain was named the world's fastest growing financial center by the City of London's Global Financial Centres Index. Bahrain's banking and financial services sector, particularly Islamic banking, have benefited from the regional boom driven by demand for oil. Petroleum is Bahrain's most exported product, accounting for 60% of export receipts, 70% of government revenues, and 11% of GDP. Aluminium is the second most exported product, followed by finance and construction materials.

Current account (balance of payments) Concept in international economics

In economics, a country's current account records the value of exports and imports of both goods and services and international transfers of capital. It is one of the two components of its balance of payments, the other being the capital account. Current account measures the nation's earnings and spendings abroad and it consists of the balance of trade, net primary income or factor income and net unilateral transfers, that have taken place over a given period of time. The current account balance is one of two major measures of a country's foreign trade. A current account surplus indicates that the value of a country's net foreign assets grew over the period in question, and a current account deficit indicates that it shrank. Both government and private payments are included in the calculation. It is called the current account because goods and services are generally consumed in the current period.

Economy of the European Union Overview of the economy of the European Union

The economy of the European Union is the joint economy of the member states of the European Union (EU). It is the third largest economy in the world in nominal terms, after the United States and China, and the third one in purchasing power parity (PPP) terms, after China and the United States. The European Union's GDP was estimated to be around $17.9 trillion (nominal) in 2020, representing around one sixth of the global economy.

Gross fixed capital formation

Gross fixed capital formation (GFCF) is a macroeconomic concept used in official national accounts such as the United Nations System of National Accounts (UNSNA), National Income and Product Accounts (NIPA) and the European System of Accounts (ESA). The concept dates back to the National Bureau of Economic Research (NBER) studies of Simon Kuznets of capital formation in the 1930s, and standard measures for it were adopted in the 1950s. Statistically it measures the value of acquisitions of new or existing fixed assets by the business sector, governments and "pure" households less disposals of fixed assets. GFCF is a component of the expenditure on gross domestic product (GDP), and thus shows something about how much of the new value added in the economy is invested rather than consumed.

Economy of Central America Overview of the economy of Central America

The economy of Central America is the eleventh-largest economy in Latin America, behind Brazil, Mexico, Argentina and Colombia. According to the World Bank, the nominal GDP of Central America reached 204 billion US dollar in 2010, as recovery from the crisis of 2009, where gross domestic product (GDP) suffered a decline to 3.8%. The major economic income are the agriculture and tourism, although the industrial sector is in strong growth, mainly in Panama.

References

  1. "CIA - the World Factbook". Archived from the original on 2012-01-29. Retrieved 2012-03-23.
  2. "Gross fixed capital formation (% of GDP) | Data". data.worldbank.org. Retrieved 2018-07-08.