
In computing, a database is an organized collection of data or a type of data store based on the use of a database management system (DBMS), the software that interacts with end users, applications, and the database itself to capture and analyze the data. The DBMS additionally encompasses the core facilities provided to administer the database. The sum total of the database, the DBMS and the associated applications can be referred to as a database system. Often the term "database" is also used loosely to refer to any of the DBMS, the database system or an application associated with the database.
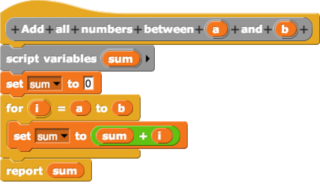
In computing, a visual programming language, also known as diagrammatic programming, graphical programming or block coding, is a programming language that lets users create programs by manipulating program elements graphically rather than by specifying them textually. A VPL allows programming with visual expressions, spatial arrangements of text and graphic symbols, used either as elements of syntax or secondary notation. For example, many VPLs are based on the idea of "boxes and arrows", where boxes or other screen objects are treated as entities, connected by arrows, lines or arcs which represent relations. VPLs are generally the basis of low-code development platforms.
Web development is the work involved in developing a website for the Internet or an intranet. Web development can range from developing a simple single static page of plain text to complex web applications, electronic businesses, and social network services. A more comprehensive list of tasks to which Web development commonly refers, may include Web engineering, Web design, Web content development, client liaison, client-side/server-side scripting, Web server and network security configuration, and e-commerce development.

Visualization, also known as Graphics Visualization, is any technique for creating images, diagrams, or animations to communicate a message. Visualization through visual imagery has been an effective way to communicate both abstract and concrete ideas since the dawn of humanity. from history include cave paintings, Egyptian hieroglyphs, Greek geometry, and Leonardo da Vinci's revolutionary methods of technical drawing for engineering purposes that actively involve scientific requirements.

TerraLib is an open-source geographic information system (GIS) software library. It extends object-relational database management systems (DBMS) to handle spatiotemporal data types.

Ben Shneiderman is an American computer scientist, a Distinguished University Professor in the University of Maryland Department of Computer Science, which is part of the University of Maryland College of Computer, Mathematical, and Natural Sciences at the University of Maryland, College Park, and the founding director (1983-2000) of the University of Maryland Human-Computer Interaction Lab. He conducted fundamental research in the field of human–computer interaction, developing new ideas, methods, and tools such as the direct manipulation interface, and his eight rules of design.
A GIS software program is a computer program to support the use of a geographic information system, providing the ability to create, store, manage, query, analyze, and visualize geographic data, that is, data representing phenomena for which location is important. The GIS software industry encompasses a broad range of commercial and open-source products that provide some or all of these capabilities within various information technology architectures.
Stuart K. Card is an American researcher and retired senior research fellow at Xerox PARC. He is considered to be one of the pioneers of applying human factors in human–computer interaction. With Jock D. Mackinlay, George G. Robertson and others he invented a number of information visualization techniques. He holds numerous patents in user interfaces and visual analysis.

Data and information visualization is the practice of designing and creating easy-to-communicate and easy-to-understand graphic or visual representations of a large amount of complex quantitative and qualitative data and information with the help of static, dynamic or interactive visual items. Typically based on data and information collected from a certain domain of expertise, these visualizations are intended for a broader audience to help them visually explore and discover, quickly understand, interpret and gain important insights into otherwise difficult-to-identify structures, relationships, correlations, local and global patterns, trends, variations, constancy, clusters, outliers and unusual groupings within data. When intended for the general public to convey a concise version of known, specific information in a clear and engaging manner, it is typically called information graphics.
Oracle Spatial and Graph, formerly Oracle Spatial, is a free option component of the Oracle Database. The spatial features in Oracle Spatial and Graph aid users in managing geographic and location-data in a native type within an Oracle database, potentially supporting a wide range of applications — from automated mapping, facilities management, and geographic information systems (AM/FM/GIS), to wireless location services and location-enabled e-business. The graph features in Oracle Spatial and Graph include Oracle Network Data Model (NDM) graphs used in traditional network applications in major transportation, telcos, utilities and energy organizations and RDF semantic graphs used in social networks and social interactions and in linking disparate data sets to address requirements from the research, health sciences, finance, media and intelligence communities.

The Human–Computer Interaction Lab (HCIL) at the University of Maryland, College Park is an academic research center specializing in the field of human-computer interaction (HCI). Founded in 1983 by Ben Shneiderman, it is one of the oldest HCI labs of its kind. The HCIL conducts research on the design, implementation, and evaluation of computer interface technologies. Additional research focuses on the development of user interfaces and design methods. Primary activities of the HCIL include collaborative research, publication and the sponsorship of open houses, workshops and annual symposiums.

Visual analytics is a multidisciplinary science and technology field that emerged from information visualization and scientific visualization. It focuses on how analytical reasoning can be facilitated by interactive visual interfaces.
George G. Robertson is an American information visualization expert and senior researcher, Visualization and Interaction (VIBE) Research Group, Microsoft Research. With Stuart K. Card, Jock D. Mackinlay and others he invented a number of Information Visualization techniques.
Jock D. Mackinlay is an American information visualization expert and Vice President of Research and Design at Tableau Software. With Stuart Card, George G. Robertson and others he invented a number of information visualization techniques.
Web-based simulation (WBS) is the invocation of computer simulation services over the World Wide Web, specifically through a web browser. Increasingly, the web is being looked upon as an environment for providing modeling and simulation applications, and as such, is an emerging area of investigation within the simulation community.
The Information visualization reference model is an example of a reference model for information visualization, developed by Ed Chi in 1999, under the name of the data state model. Chi showed that the framework successfully modeled a wide array of visualization applications and later showed that the model was functionally equivalent to the data flow model used in existing graphics toolkits such as VTK.

Apache Drill is an open-source software framework that supports data-intensive distributed applications for interactive analysis of large-scale datasets. Built chiefly by contributions from developers from MapR, Drill is inspired by Google's Dremel system. Drill is an Apache top-level project. Tom Shiran is the founder of the Apache Drill Project. It was designated an Apache Software Foundation top-level project in December 2016.

Jean-Daniel Fekete is a French computer scientist.
