Rule of twelfths

Last updated
Graph showing relationships between the rule of twelfths (coloured bars), a sine wave (dashed blue curve) and a clockface, if high tide occurs at 12:00 Rule of twelfths.svg
Graph showing relationships between the rule of twelfths (coloured bars), a sine wave (dashed blue curve) and a clockface, if high tide occurs at 12:00

The rule of twelfths is an approximation to a sine curve. It can be used as a rule of thumb for estimating a changing quantity where both the quantity and the steps are easily divisible by 12. Typical uses are predicting the height of the tide or the change in day length over the seasons.

Contents

The rule

The rule states that over the first period the quantity increases by 1/12. Then in the second period by 2/12, in the third by 3/12, in the fourth by 3/12, fifth by 2/12 and at the end of the sixth period reaches its maximum with an increase of 1/12. The steps are 1:2:3:3:2:1 giving a total change of 12/12. Over the next six intervals the quantity reduces in a similar manner by 1, 2, 3, 3, 2, 1 twelfths.

PeriodRule or
actual
values
IncrementCumulative
Exact valueDecimalRelative sizeExact valueDecimalRelative size
1Rule1 / 120.083330.08333
 
1 / 120.083330.08333
 
Actual(cos 0° - cos 30°) / 20.066990.06699
 
(1 - cos 30°) / 20.066990.06699
 
2Rule2 / 120.166670.16667
 
3 / 120.250.25
 
Actual(cos 30° - cos 60°) / 20.183010.18301
 
(1 - cos 60°) / 20.250.25
 
3Rule3 / 120.250.25
 
6 / 120.50.5
 
Actual(cos 60° - cos 90°) / 20.250.25
 
(1 - cos 90°) / 20.50.5
 
4Rule3 / 120.250.25
 
9 / 120.750.75
 
Actual(cos 90° - cos 120°) / 20.250.25
 
(1 - cos 120°) / 20.750.75
 
5Rule2 / 120.166670.16667
 
11 / 120.916670.91667
 
Actual(cos 120° - cos 150°) / 20.183010.18301
 
(1 - cos 150°) / 20.933010.93301
 
6Rule1 / 120.083330.08333
 
12 / 1211
 
Actual(cos 150° - cos 180°) / 20.066990.06699
 
(1 - cos 180°) / 211
 

Applications

A regular dodecahedron (grey) approximated with a lattice polygon using the rule of twelfths (red) Rule of twelfths circle approximation.svg
A regular dodecahedron (grey) approximated with a lattice polygon using the rule of twelfths (red)

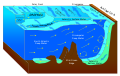
In many parts of the world the tides approximate to a semi-diurnal sine curve, that is there are two high- and two low- tides per day. As an estimate then each period equates to 1 hour, with the tide rising by 1, 2, 3, 3, 2, finally 1 twelfths of its total range in each hour, from low tide to high tide in about 6 hours, then the tide is decreasing by the same pattern in the next 6 hours, back to low tide. In places where there is only one high and one low water per day, the rule can be used by assuming the steps are 2 hours. If the tidal curve does not approximate to a sine wave then the rule cannot be used. [1] [2] This is important when navigating a boat or a ship in shallow water, and when launching and retrieving boats on slipways on a tidal shore. [3]

The rule is also useful for estimating the monthly change in sunrise and sunset and thus day length. [4]

Example calculations

Tides

If a tide table gives the information that tomorrow's low water would be at noon and that the water level at this time would be two metres above chart datum, and that at the following high tide the water level would be 14 metres, then the height of water at 3:00 p.m. can be calculated as follows:

This represents only the increase - the total depth of the water (relative to chart datum) will include the 2 m depth at low tide: 6 m + 2 m = 8 metres.

The calculation can be simplified by adding twelfths together and reducing the fraction beforehand:

Rise of tide in three hours

Daylength

If midwinter sunrise and set are at 09:00 and 15:00, and midsummer at 03:00 and 21:00, the daylight duration will shift by 0:30, 1:00, 1:30, 1:30, 1:00 and 0:30 over the six months from one solstice to the other. Likewise the day length changes by 0:30, 1:00, 1:30, 1:30, 1:00 and 0:30 each month. More equatorial latitudes change by less, but still in the same proportions; more polar by more.

Caveats

The rule is a rough approximation only and should be applied with great caution when used for navigational purposes. Officially produced tide tables should be used in preference whenever possible.

The rule assumes that all tides behave in a regular manner, this is not true of some geographical locations, such as Poole Harbour [5] or the Solent [6] where there are "double" high waters or Weymouth Bay [5] where there is a double low water.

The rule assumes that the period between high and low tides is six hours but this is an underestimate and can vary anyway.

Refinement

The rule relies on the approximation of tan 60° or √3 (~1.732) with 5/3 (~1.667) yielding 3.77% error. The next best rational approximation, 7/4 (1.75) yields 1.04% error. The steps are 1:3:4:4:3:1 giving a total change of 16/16: [7]

PeriodRule or
actual
values
IncrementCumulative
Exact valueDecimalRelative sizeExact valueDecimalRelative size
1Rule1 / 160.06250.0625
 
1 / 160.06250.0625
 
Actual(cos 0° - cos 30°) / 20.066990.06699
 
(1 - cos 30°) / 20.066990.06699
 
2Rule3 / 160.18750.1875
 
4 / 160.250.25
 
Actual(cos 30° - cos 60°) / 20.183010.18301
 
(1 - cos 60°) / 20.250.25
 
3Rule4 / 160.250.25
 
8 / 160.50.5
 
Actual(cos 60° - cos 90°) / 20.250.25
 
(1 - cos 90°) / 20.50.5
 
4Rule4 / 160.250.25
 
12 / 160.750.75
 
Actual(cos 90° - cos 120°) / 20.250.25
 
(1 - cos 120°) / 20.750.75
 
5Rule3 / 160.18750.1875
 
15 / 160.93750.9375
 
Actual(cos 120° - cos 150°) / 20.183010.18301
 
(1 - cos 150°) / 20.933010.93301
 
6Rule1 / 160.06250.0625
 
16 / 1611
 
Actual(cos 150° - cos 180°) / 20.066990.06699
 
(1 - cos 180°) / 211
 

The following best approximations are 19/11 (0.276% error) with steps 3:8:11:11:8:3, and 26/15 (0.074% error) with steps 4:11:15:15:11:4. [7]

Related Research Articles

<span class="mw-page-title-main">Tide</span> Rise and fall of the sea level under astronomical gravitational influences

Tides are the rise and fall of sea levels caused by the combined effects of the gravitational forces exerted by the Moon and are also caused by the Earth and Moon orbiting one another.

<span class="mw-page-title-main">Tsunami</span> Series of water waves caused by the displacement of a large volume of a body of water

A tsunami is a series of waves in a water body caused by the displacement of a large volume of water, generally in an ocean or a large lake. Earthquakes, volcanic eruptions and other underwater explosions above or below water all have the potential to generate a tsunami. Unlike normal ocean waves, which are generated by wind, or tides, which are in turn generated by the gravitational pull of the Moon and the Sun, a tsunami is generated by the displacement of water from a large event.

<span class="mw-page-title-main">Analog-to-digital converter</span> System that converts an analog signal into a digital signal

In electronics, an analog-to-digital converter is a system that converts an analog signal, such as a sound picked up by a microphone or light entering a digital camera, into a digital signal. An ADC may also provide an isolated measurement such as an electronic device that converts an analog input voltage or current to a digital number representing the magnitude of the voltage or current. Typically the digital output is a two's complement binary number that is proportional to the input, but there are other possibilities.

Signal-to-noise ratio is a measure used in science and engineering that compares the level of a desired signal to the level of background noise. SNR is defined as the ratio of signal power to noise power, often expressed in decibels. A ratio higher than 1:1 indicates more signal than noise.

The total harmonic distortion is a measurement of the harmonic distortion present in a signal and is defined as the ratio of the sum of the powers of all harmonic components to the power of the fundamental frequency. Distortion factor, a closely related term, is sometimes used as a synonym.

<span class="mw-page-title-main">Horizon</span> Apparent curve that separates earth from sky

The horizon is the apparent curve that separates the surface of a celestial body from its sky when viewed from the perspective of an observer on or near the surface of the relevant body. This curve divides all viewing directions based on whether it intersects the relevant body's surface or not.

<span class="mw-page-title-main">Dew point</span> Temperature at which air becomes saturated with water vapour during a cooling process

The dew point of a given body of air is the temperature to which it must be cooled to become saturated with water vapor. This temperature depends on the pressure and water content of the air. When the air is cooled below the dew point, its moisture capacity is reduced and airborne water vapor will condense to form liquid water known as dew. When this occurs through the air's contact with a colder surface, dew will form on that surface.

<span class="mw-page-title-main">Cook Strait</span> Strait between the North and South Islands of New Zealand

Cook Strait separates the North and South Islands of New Zealand. The strait connects the Tasman Sea on the northwest with the South Pacific Ocean on the southeast. It is 22 kilometres (14 mi) wide at its narrowest point, and is considered one of the most dangerous and unpredictable waters in the world. Regular ferry services run across the strait between Picton in the Marlborough Sounds and Wellington.

<span class="mw-page-title-main">Quantization (signal processing)</span> Process of mapping a continuous set to a countable set

Quantization, in mathematics and digital signal processing, is the process of mapping input values from a large set to output values in a (countable) smaller set, often with a finite number of elements. Rounding and truncation are typical examples of quantization processes. Quantization is involved to some degree in nearly all digital signal processing, as the process of representing a signal in digital form ordinarily involves rounding. Quantization also forms the core of essentially all lossy compression algorithms.

<span class="mw-page-title-main">Amphidromic point</span> Location at which there is little or no tide

An amphidromic point, also called a tidal node, is a geographical location which has zero tidal amplitude for one harmonic constituent of the tide. The tidal range for that harmonic constituent increases with distance from this point, though not uniformly. As such, the concept of amphidromic points is crucial to understanding tidal behaviour. The term derives from the Greek words amphi ("around") and dromos ("running"), referring to the rotary tides which circulate around amphidromic points. It was first discovered by William Whewell, who extrapolated the cotidal lines from the coast of the North Sea and found that the lines must meet at some point.

<span class="mw-page-title-main">Equation of time</span> Apparent solar time minus mean solar time

The equation of time describes the discrepancy between two kinds of solar time. The word equation is used in the medieval sense of "reconciliation of a difference". The two times that differ are the apparent solar time, which directly tracks the diurnal motion of the Sun, and mean solar time, which tracks a theoretical mean Sun with uniform motion along the celestial equator. Apparent solar time can be obtained by measurement of the current position of the Sun, as indicated by a sundial. Mean solar time, for the same place, would be the time indicated by a steady clock set so that over the year its differences from apparent solar time would have a mean of zero.

In radiometry, irradiance is the radiant flux received by a surface per unit area. The SI unit of irradiance is the watt per square metre (W⋅m−2). The CGS unit erg per square centimetre per second (erg⋅cm−2⋅s−1) is often used in astronomy. Irradiance is often called intensity, but this term is avoided in radiometry where such usage leads to confusion with radiant intensity. In astrophysics, irradiance is called radiant flux.

Slack tide or slack water is the short period in a body of tidal water when the water is completely unstressed, and there is no movement either way in the tidal stream. It occurs before the direction of the tidal stream reverses. Slack water can be estimated using a tidal atlas or the tidal diamond information on a nautical chart. The time of slack water, particularly in constricted waters, does not occur at high and low water, and in certain areas, such as Primera Angostura, the ebb may run for up to three hours after the water level has started to rise. Similarly, the flood may run for up to three hours after the water has started to fall. In 1884, Thornton Lecky illustrated the phenomenon with an inland basin of infinite size, connected to the sea by a narrow mouth. Since the level of the basin is always at mean sea level, the flood in the mouth starts at half tide, and its velocity is at its greatest at the time of high water, with the strongest ebb occurring conversely at low water.

<span class="mw-page-title-main">Chart datum</span> Level of water from which depths displayed on a nautical chart are measured

A chart datum is the water level surface serving as origin of depths displayed on a nautical chart and for reporting and predicting tide heights. A chart datum is generally derived from some tidal phase, in which case it is also known as a tidal datum. Common chart datums are lowest astronomical tide (LAT) and mean lower low water (MLLW). In non-tidal areas, e.g. the Baltic Sea, mean sea level (MSL) is used. A chart datum is a type of vertical datum and must not be confused with the horizontal datum for the chart.

<span class="mw-page-title-main">Tide table</span> Tabulated data used for tidal prediction

Tide tables, sometimes called tide charts, are used for tidal prediction and show the daily times and levels of high and low tides, usually for a particular location. Tide heights at intermediate times can be approximated by using the rule of twelfths or more accurately calculated by using a published tidal curve for the location. Tide levels are typically given relative to a low-water vertical datum, e.g. the mean lower low water (MLLW) datum in the US.

Signal-to-quantization-noise ratio is widely used quality measure in analysing digitizing schemes such as pulse-code modulation (PCM). The SQNR reflects the relationship between the maximum nominal signal strength and the quantization error introduced in the analog-to-digital conversion.

<span class="mw-page-title-main">Tidal range</span> Vertical difference between the high tide and the succeeding low tide

Tidal range is the difference in height between high tide and low tide. Tides are the rise and fall of sea levels caused by gravitational forces exerted by the Moon and Sun, by Earth's rotation and by centrifugal force caused by Earth's progression around the Earth-Moon barycenter. Tidal range depends on time and location.

<span class="mw-page-title-main">Gravity of Earth</span>

The gravity of Earth, denoted by g, is the net acceleration that is imparted to objects due to the combined effect of gravitation and the centrifugal force . It is a vector quantity, whose direction coincides with a plumb bob and strength or magnitude is given by the norm .

In fluid dynamics, Airy wave theory gives a linearised description of the propagation of gravity waves on the surface of a homogeneous fluid layer. The theory assumes that the fluid layer has a uniform mean depth, and that the fluid flow is inviscid, incompressible and irrotational. This theory was first published, in correct form, by George Biddell Airy in the 19th century.

<span class="mw-page-title-main">Ocean power in New Zealand</span> Renewable energy sources

New Zealand has large ocean energy resources but does not yet generate any power from them. TVNZ reported in 2007 that over 20 wave and tidal power projects are currently under development. However, not a lot of public information is available about these projects. The Aotearoa Wave and Tidal Energy Association was established in 2006 to "promote the uptake of marine energy in New Zealand". According to their 10 February 2008 newsletter, they have 59 members. However, the association doesn't list its members.

References

  1. "Rule of Twelfths for quick tidal estimates". DIY Wood Boat. Retrieved 19 December 2017.
  2. Getchell, David R. (1994). The Outboard Boater's Handbook: Advanced Seamanship and Practical Skills . International Marine. p.  195. ISBN   978-0-07-023053-8.
  3. Sweet, Robert J. (16 September 2004). The Weekend Navigator: Simple Boat Navigation with GPS and Electronics . McGraw Hill Professional. p.  162. ISBN   978-0-07-143035-7.
  4. McAdam, Marcus. "The Rule of Twelfths". Mc2Photography.com. Retrieved 2021-03-11. The same Rule of Twelfths can be applied to the duration of the days.
  5. 1 2 Heritage, Trevor. "Poole Harbour and its tides" (PDF). Shrimperowners. Retrieved 19 December 2017.
  6. Ridge, M J, FRICS MCIT. "English Channel double tides". Bristol Nomads windsurfing club. Archived from the original on 22 August 2009. Retrieved 19 December 2017.{{cite web}}: CS1 maint: multiple names: authors list (link)
  7. 1 2 Bizony, Marcus Bizony (1 June 2014). "Finding rational approximations to square roots". Learning and Teaching Mathematics. 2014 (16). Retrieved 25 March 2024.