West Virginia statistical areas

Last updated
An enlargeable map of the 17 core-based statistical areas in West Virginia West Virginia CBSAs 2020.png
An enlargeable map of the 17 core-based statistical areas in West Virginia

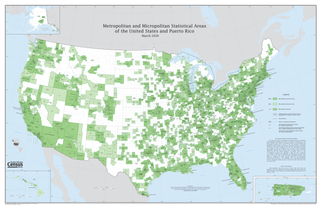
The U.S. State of West Virginia currently has 22 statistical areas that have been delineated by the Office of Management and Budget (OMB). On March 6, 2020, the OMB delineated five combined statistical areas, 11 metropolitan statistical areas, and six micropolitan statistical areas in West Virginia. [1]

Contents

Statistical areas

The Office of Management and Budget (OMB) has designated more than 1,000 statistical areas for the United States and Puerto Rico. [2] These statistical areas are important geographic delineations of population clusters used by the OMB, the United States Census Bureau, planning organizations, and federal, state, and local government entities.

The OMB defines a core-based statistical area (commonly referred to as a CBSA) as "a statistical geographic entity consisting of the county or counties (or county-equivalents) associated with at least one core [lower-alpha 1] of at least 10,000 population, plus adjacent counties having a high degree of social and economic integration with the core as measured through commuting ties with the counties containing the core." [2] The OMB further divides core-based statistical areas into metropolitan statistical areas (MSAs) that have "a population of at least 50,000" and micropolitan statistical areas (μSAs) that have "a population of at least 10,000, but less than 50,000." [2]

The OMB defines a combined statistical area (CSA) as "a geographic entity consisting of two or more adjacent core-based statistical areas with employment interchange measures [lower-alpha 2] of at least 15%." [2] The primary statistical areas (PSAs) include all combined statistical areas and any core-based statistical area that is not a constituent of a combined statistical area.

Table

The table below describes the 22 United States statistical areas and 55 counties of the State of West Virginia with the following information: [3]

  1. The combined statistical area (CSA) as designated by the OMB. [1]
  2. The CSA population according to 2019 US Census Bureau population estimates. [4]
  3. The core-based statistical area (CBSA) [2] as designated by the OMB. [1]
  4. The CBSA population according to 2019 US Census Bureau population estimates [4]
  5. The county name
  6. The county population according to 2019 US Census Bureau population estimates [4]
  7. The Metropolitan Division name, if applicable [1]
  8. The Metropolitan Division population according to 2019 US Census Bureau population estimates [4]
The 22 United States statistical areas and 55 counties of the State of West Virginia

Combined statistical area2019 populationCore-based statistical area2019 populationCounty2019 populationMetropolitan Division2019 population
Charleston-Huntington-Ashland, WV-OH-KY CSA 776,694
503,406
Huntington-Ashland, WV-KY-OH MSA 355,873
187,797
Cabell County, West Virginia 91,945none
Lawrence County, Ohio 59,463
Putnam County, West Virginia 56,450
Boyd County, Kentucky 46,718
Wayne County, West Virginia 39,402
Greenup County, Kentucky 35,098
Carter County, Kentucky 26,797
Charleston, WV MSA 257,074 Kanawha County, West Virginia 178,124
Jackson County, West Virginia 28,576
Boone County, West Virginia 21,457
Lincoln County, West Virginia 20,409
Clay County, West Virginia 8,508
Portsmouth, OH μSA 75,314 Scioto County, Ohio 75,314
Point Pleasant, WV-OH μSA 56,414
26,516
Gallia County, Ohio 29,898
Mason County, West Virginia 26,516
Mount Gay-Shamrock, WV μSA 32,019 Logan County, West Virginia 32,019
Washington-Baltimore-Arlington, DC-MD-VA-WV-PA CSA 9,814,928
217,376
Washington-Arlington-Alexandria, DC-VA-MD-WV MSA 6,280,487
57,146
Fairfax County, Virginia 1,147,532Washington-Arlington-Alexandria, DC-VA-MD-WV MD4,970,252
57,146
Prince George's County, Maryland 909,327
District of Columbia 705,749
Prince William County, Virginia 470,335
Loudoun County, Virginia 413,538
Arlington County, Virginia 236,842
Charles County, Maryland 163,257
City of Alexandria, Virginia 159,428
Stafford County, Virginia 152,882
Spotsylvania County, Virginia 136,215
Calvert County, Maryland 92,525
Fauquier County, Virginia 71,222
Jefferson County, West Virginia 57,146
Culpeper County, Virginia 52,605
City of Manassas, Virginia 41,085
Warren County, Virginia 40,164
City of Fredericksburg, Virginia 29,036
City of Fairfax, Virginia 24,019
City of Manassas Park, Virginia 17,478
Clarke County, Virginia 14,619
City of Falls Church, Virginia 14,617
Madison County, Virginia 13,261
Rappahannock County, Virginia 7,370
Montgomery County, Maryland 1,050,688Frederick-Gaithersburg-Rockville, MD MD1,310,235
Frederick County, Maryland 259,547
Baltimore-Columbia-Towson, MD MSA 2,800,053 Baltimore County, Maryland 827,370none
Baltimore City, Maryland 593,490
Anne Arundel County, Maryland 579,234
Howard County, Maryland 325,690
Harford County, Maryland 255,441
Carroll County, Maryland 168,447
Queen Anne's County, Maryland 50,381
Hagerstown-Martinsburg, MD-WV MSA 288,104
137,055
Washington County, Maryland 151,049
Berkeley County, West Virginia 119,171
Morgan County, West Virginia 17,884
Chambersburg-Waynesboro, PA MSA 155,027 Franklin County, Pennsylvania 155,027
Winchester, VA-WV MSA 140,566
23,175
Frederick County, Virginia 89,313
City of Winchester, Virginia 28,078
Hampshire County, West Virginia 23,175
California–Lexington Park, MD μSA 113,510 St. Mary's County, Maryland 113,510
Easton, MD μSA 37,181 Talbot County, Maryland 36,968
Morgantown-Fairmont, WV CSA 195,116 Morgantown, WV MSA 139,044 Monongalia County, West Virginia 105,612
Preston County, West Virginia 33,432
Fairmont, WV μSA 56,072 Marion County, West Virginia 56,072
none Beckley, WV MSA 115,767 Raleigh County, West Virginia 73,361
Fayette County, West Virginia 42,406
Clarksburg, WV μSA 92,399 Harrison County, West Virginia 67,256
Taylor County, West Virginia 16,695
Doddridge County, West Virginia 8,448
Parkersburg-Marietta-Vienna, WV-OH CSA 149,250
89,339
Parkersburg-Vienna, WV MSA 89,339 Wood County, West Virginia 83,518
Wirt County, West Virginia 5,821
Marietta, OH μSA 59,911 Washington County, Ohio 59,911
none Wheeling, WV-OH MSA 138,948
71,942
Belmont County, Ohio 67,006
Ohio County, West Virginia 41,411
Marshall County, West Virginia 30,531
Bluefield, WV-VA μSA 105,633
58,758
Mercer County, West Virginia 58,758
Tazewell County, Virginia 40,595
Bland County, Virginia 6,280
Pittsburgh-New Castle-Weirton, PA-OH-WV CSA 2,603,259
50,749
Pittsburgh, PA MSA 2,317,600 Allegheny County, Pennsylvania 1,216,045
Westmoreland County, Pennsylvania 348,899
Washington County, Pennsylvania 206,865
Butler County, Pennsylvania 187,853
Beaver County, Pennsylvania 163,929
Fayette County, Pennsylvania 129,274
Armstrong County, Pennsylvania 64,735
Weirton-Steubenville, WV-OH MSA 116,074
50,749
Jefferson County, Ohio 65,325
Hancock County, West Virginia 28,810
Brooke County, West Virginia 21,939
New Castle, PA μSA 85,512 Lawrence County, Pennsylvania 85,512
Indiana, PA μSA 84,073 Indiana County, Pennsylvania 84,073
none Elkins, WV μSA 28,695 Randolph County, West Virginia 28,695
Cumberland, MD-WV MSA 97,284
26,868
Allegany County, Maryland 70,416
Mineral County, West Virginia 26,868
none Greenbrier County, West Virginia 34,662
Nicholas County, West Virginia 24,496
Upshur County, West Virginia 24,176
Mingo County, West Virginia 23,424
Wyoming County, West Virginia 20,394
McDowell County, West Virginia 17,624
Barbour County, West Virginia 16,441
Lewis County, West Virginia 15,907
Wetzel County, West Virginia 15,065
Braxton County, West Virginia 13,957
Hardy County, West Virginia 13,776
Roane County, West Virginia 13,688
Monroe County, West Virginia 13,275
Summers County, West Virginia 12,573
Grant County, West Virginia 11,568
Ritchie County, West Virginia 9,554
Tyler County, West Virginia 8,591
Pocahontas County, West Virginia 8,247
Webster County, West Virginia 8,114
Gilmer County, West Virginia 7,823
Pleasants County, West Virginia 7,460
Calhoun County, West Virginia 7,109
Pendleton County, West Virginia 6,969
Tucker County, West Virginia 6,839
State of West Virginia 1,792,147

See also

Notes

  1. The OMB defines a core as "a densely settled concentration of population, comprising an Urban Area (of 10,000 or more population) delineated by the Census Bureau, around which a core-based statistical area is delineated." [2]
  2. The OMB defines the employment interchange measure as "the sum of the percentage of workers living in the smaller entity who work in the larger entity plus the percentage of employment in the smaller entity that is accounted for by workers who reside in the larger entity." [2]

Related Research Articles

<span class="mw-page-title-main">Metropolitan statistical area</span> Type of geographical region in the United States

In the United States, a metropolitan statistical area (MSA) is a geographical region with a relatively high population density at its core and close economic ties throughout the region. Such regions are not legally incorporated as a city or town would be and are not legal administrative divisions like counties or separate entities such as states. That makes the precise definition of any given metropolitan area vary with the source. The statistical criteria for a standard metropolitan area were defined in 1949 and redefined as a metropolitan statistical area in 1983.

<span class="mw-page-title-main">Indiana statistical areas</span> Indiana statistical areas

The U.S. state of Indiana currently has 51 statistical areas that have been delineated by the Office of Management and Budget (OMB). On March 6, 2020, the OMB delineated ten combined statistical areas, 15 metropolitan statistical areas, and 26 micropolitan statistical areas in Indiana.
<span class="mw-page-title-main">Illinois statistical areas</span> Illinois statistical areas

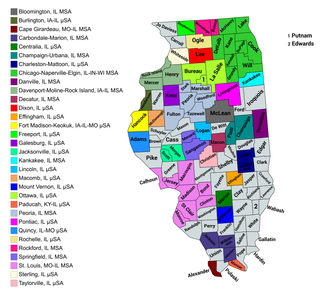
The U.S. State of Illinois currently has 43 statistical areas that have been delineated by the Office of Management and Budget (OMB). On March 6, 2020, the OMB delineated 11 combined statistical areas, 13 metropolitan statistical areas, and 19 micropolitan statistical areas in Illinois.
<span class="mw-page-title-main">Pennsylvania statistical areas</span> Pennsylvania statistical areas

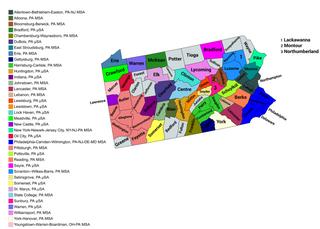
The United States Commonwealth of Pennsylvania currently has 49 statistical areas that have been delineated by the Office of Management and Budget (OMB). On March 6, 2020, the OMB delineated 12 combined statistical areas, 20 metropolitan statistical areas, and 17 micropolitan statistical areas in Pennsylvania.
<span class="mw-page-title-main">New York statistical areas</span> New York statistical areas

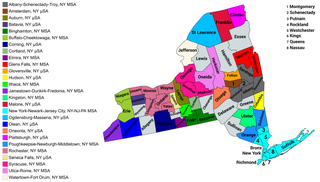
The U.S. state of New York currently has 34 statistical areas that have been delineated by the Office of Management and Budget (OMB). On March 6, 2020, the OMB delineated seven combined statistical areas, 14 metropolitan statistical areas, and 13 micropolitan statistical areas in New York.
<span class="mw-page-title-main">Michigan statistical areas</span> Michigan statistical areas

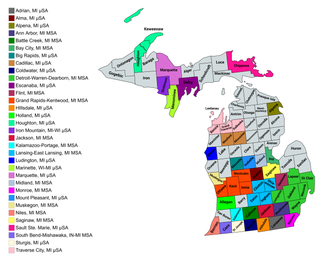
The U.S. State of Michigan currently has 40 statistical areas that have been delineated by the Office of Management and Budget (OMB). On March 6, 2020, the OMB delineated seven combined statistical areas, 15 metropolitan statistical areas, and 18 micropolitan statistical areas in Michigan.
<span class="mw-page-title-main">Connecticut statistical areas</span> Connecticut statistical areas

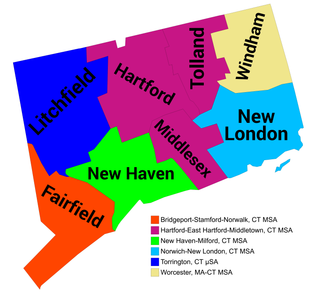
The U.S. State of Connecticut currently has nine statistical areas that have been delineated by the Office of Management and Budget (OMB). On March 6, 2020, the OMB delineated three combined statistical areas, five metropolitan statistical areas, and one micropolitan statistical area in Connecticut.
<span class="mw-page-title-main">Wisconsin statistical areas</span> Wisconsin statistical areas

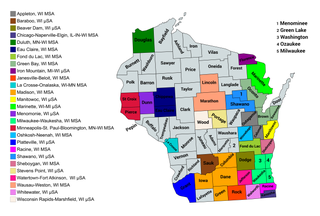
The U.S. State of Wisconsin currently has 36 statistical areas that have been delineated by the Office of Management and Budget (OMB). On March 6, 2020, the OMB delineated nine combined statistical areas, 15 metropolitan statistical areas, and 12 micropolitan statistical areas in Wisconsin.

<span class="mw-page-title-main">Montana statistical areas</span> Montana statistical areas

The U.S. State of Montana currently has seven statistical areas that have been delineated by the Office of Management and Budget (OMB). On March 6, 2020, the OMB delineated three metropolitan statistical areas and four micropolitan statistical areas in Montana.

<span class="mw-page-title-main">Florida statistical areas</span> Florida statistical areas

The U.S. State of Florida currently has 36 statistical areas that have been delineated by the Office of Management and Budget (OMB). On March 6, 2020, the OMB delineated seven combined statistical areas, 22 metropolitan statistical areas, and seven micropolitan statistical areas in Florida.

<span class="mw-page-title-main">Virginia statistical areas</span> Areas used for statistical purposes in Virginia, United States

The United States Commonwealth of Virginia currently has 19 statistical areas that have been delineated by the Office of Management and Budget (OMB). On March 6, 2020, the OMB delineated four combined statistical areas, 11 metropolitan statistical areas, and four micropolitan statistical areas in Virginia.

The U.S. State of Maryland currently has 12 statistical areas that have been delineated by the Office of Management and Budget (OMB). On March 6, 2020, the OMB delineated three combined statistical areas, seven metropolitan statistical areas, and two micropolitan statistical areas in Maryland.

<span class="mw-page-title-main">Massachusetts statistical areas</span> Massachusetts statistical areas

The United States Commonwealth of Massachusetts currently has eight statistical areas that have been delineated by the Office of Management and Budget (OMB). On March 6, 2020, the OMB delineated one combined statistical area, six metropolitan statistical areas, and one micropolitan statistical area in Massachusetts.

<span class="mw-page-title-main">Louisiana statistical areas</span> Louisiana statistical areas

The U.S. State of Louisiana currently has 25 statistical areas that have been delineated by the Office of Management and Budget (OMB). On March 6, 2020, the OMB delineated six combined statistical areas, nine metropolitan statistical areas, and ten micropolitan statistical areas in Louisiana.

<span class="mw-page-title-main">New Mexico statistical areas</span> New Mexico statistical areas

The U.S. State of New Mexico currently has 22 statistical areas that have been delineated by the Office of Management and Budget (OMB). On March 6, 2020, the OMB delineated three combined statistical areas, four metropolitan statistical areas, and 15 micropolitan statistical areas in New Mexico.
<span class="mw-page-title-main">Oklahoma statistical areas</span>

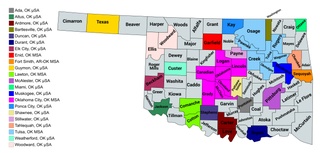
The U.S. State of Oklahoma currently has 26 statistical areas that have been delineated by the Office of Management and Budget (OMB). On March 6, 2020, the OMB delineated four combined statistical areas, five metropolitan statistical areas, and 17 micropolitan statistical areas in Oklahoma.

<span class="mw-page-title-main">Oregon statistical areas</span> Oregon statistical areas

The U.S. State of Oregon currently has 24 statistical areas that have been delineated by the Office of Management and Budget (OMB). On March 6, 2020, the OMB delineated four combined statistical areas, eight metropolitan statistical areas, and 12 micropolitan statistical areas in Oregon.
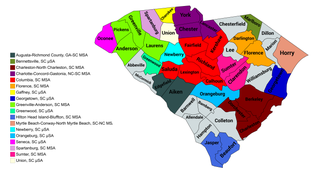
<span class="mw-page-title-main">South Carolina statistical areas</span> South Carolina statistical areas

The U.S. State of South Carolina currently has 22 statistical areas that have been delineated by the Office of Management and Budget (OMB). On March 6, 2020, the OMB delineated four combined statistical areas, ten metropolitan statistical areas, and eight micropolitan statistical areas in South Carolina.
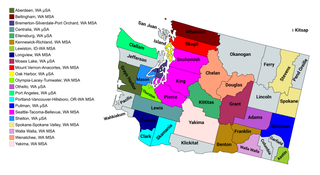
<span class="mw-page-title-main">Washington (state) statistical areas</span> Washington (state) statistical areas

The U.S. State of Washington currently has 28 statistical areas that have been delineated by the Office of Management and Budget (OMB). On March 6, 2020, the OMB delineated six combined statistical areas, 13 metropolitan statistical areas, and nine micropolitan statistical areas in Washington.

The Commonwealth of Puerto Rico currently has 15 statistical areas that have been delineated by the United States Office of Management and Budget (OMB). On March 6, 2020, the OMB delineated three combined statistical areas, eight metropolitan statistical areas, and four micropolitan statistical areas in Puerto Rico.

References

  1. 1 2 3 4 5 Revised Delineations of Metropolitan Statistical Areas, Micropolitan Statistical Areas, and Combined Statistical Areas, and Guidance on Uses of the Delineations of These Areas (March 6, 2020). "0MB BULLETIN NO. 20-01" (PDF). Office of Management and Budget . Retrieved December 15, 2021.{{cite web}}: CS1 maint: multiple names: authors list (link)
  2. 1 2 3 4 5 6 7 "2020 Standards for Delineating Core Based Statistical Areas". Office of Management and Budget. July 16, 2021. Retrieved December 15, 2021.
  3. An out-of-state area and its population are displayed in green.An area that extends into more than one state is displayed in teal. A teal population number over a black population number show the total population versus the in-state population.
  4. 1 2 3 4 "Annual Estimates of the Resident Population for Counties in the United States: April 1, 2010 to July 1, 2019". United States Census Bureau, Population Division. April 2020. Retrieved April 9, 2020.

38°38′27″N80°37′22″W / 38.6409°N 80.6227°W / 38.6409; -80.6227 (State of West Virginia)