Oklahoma statistical areas

Last updated

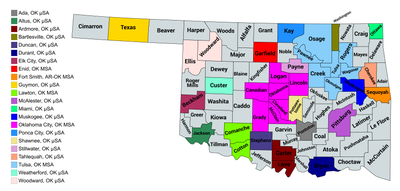
An enlargeable map of the 22 core-based statistical areas in Oklahoma. Oklahoma CBSAs 2020.png
An enlargeable map of the 22 core-based statistical areas in Oklahoma.

The U.S. State of Oklahoma currently has 26 statistical areas that have been delineated by the Office of Management and Budget (OMB). On March 6, 2020, the OMB delineated four combined statistical areas, five metropolitan statistical areas, and 17 micropolitan statistical areas in Oklahoma. [1]

Contents

Background

The Office of Management and Budget (OMB) has designated more than 1,000 statistical areas for the United States and Puerto Rico. [2] These statistical areas are important geographic delineations of population clusters used by the OMB, the United States Census Bureau, planning organizations, and federal, state, and local government entities.

The OMB defines a core-based statistical area (commonly referred to as a CBSA) as the county or counties (or county-equivalents) surrounding at least one densely-settled core of at least 10,000 population, [2] "plus adjacent counties having a high degree of social and economic integration with the core as measured through commuting ties with the counties containing the core". [2] The OMB further divides core-based statistical areas based on population into metropolitan statistical areas (MSAs) for those with at least 50,000 and micropolitan statistical areas (μSAs) for those with 10,000 to 49,999 people. [2]

The OMB defines a combined statistical area (CSA) as two or more adjacent core-based statistical areas where the employment interchange rate (% commuting from A to B plus % commuting from B to A) is at least 15%. [2] The primary statistical areas (PSAs) include all combined statistical areas and any core-based statistical area that is not a constituent of a combined statistical area.

Table

The 26 United States statistical areas and 77 counties of the State of Oklahoma

Combined Statistical Area [1] 2019 CSA Population (est.) [3] Core Based Statistical Area [1] CBSA 2019 Population (est.) [3] County2019 County Population (est.) [3]
Oklahoma City-Shawnee, OK CSA 1,481,542 Oklahoma City, OK MSA 1,408,950 Oklahoma County, Oklahoma 797,434
Cleveland County, Oklahoma 284,014
Canadian County, Oklahoma 148,306
Grady County, Oklahoma 55,834
Logan County, Oklahoma 48,011
McClain County, Oklahoma 40,474
Lincoln County, Oklahoma 34,877
Shawnee, OK μSA 72,592 Pottawatomie County, Oklahoma 72,592
Tulsa-Bartlesville, OK CSA 1,118,150 Tulsa, OK MSA 998,626 Tulsa County, Oklahoma 651,552
Rogers County, Oklahoma 92,459
Wagoner County, Oklahoma 81,289
Creek County, Oklahoma 71,522
Osage County, Oklahoma 46,963
Okmulgee County, Oklahoma 38,465
Pawnee County, Oklahoma 16,376
Muskogee, OK μSA 67,997 Muskogee County, Oklahoma 67,997
Bartlesville, OK μSA 51,527 Washington County, Oklahoma 51,527
Lawton-Duncan, OK CSA 169,558 Lawton, OK MSA 126,415 Comanche County, Oklahoma 120,749
Cotton County, Oklahoma 5,666
Duncan, OK μSA 43,143 Stephens County, Oklahoma 43,143
none Stillwater, OK μSA 81,784 Payne County, Oklahoma 81,784
Enid, OK MSA 61,056 Garfield County, Oklahoma 61,056
Ardmore, OK μSA 48,111 Carter County, Oklahoma 48,111
Tahlequah, OK μSA 48,657 Cherokee County, Oklahoma 48,657
Dallas-Fort Worth, TX-OK CSA 8,057,796 (whole CSA)
47,995 (Oklahoma part)
Dallas-Fort Worth-Arlington, TX MSA 7,573,136 Dallas County 2,635,516
Collin County 1,034,730
Denton County, Texas 887,207
Ellis County, Texas 184,826
Kaufman County, Texas 136,154
Rockwall County, Texas 104,915
Hunt County, Texas 98,594
Tarrant County, Texas 2,102,515
Johnson County, Texas 175,817
Parker County, Texas 142,878
Wise County, Texas 69,984
Sherman-Denison, TX MSA 136,212 Grayson County, Texas 136,212
Athens, TX μSA 82,737 Henderson County, Texas 82,737
Granbury, TX μSA 61,643 Hood County, Texas 61,643
Corsicana, TX μSA 50,113 Navarro County, Texas 50,113
Durant, OK μSA 47,995 Bryan County, Oklahoma 47,995
Gainesville, TX μSA 41,257 Cooke County, Texas 41,257
Bonham, TX μSA 35,514 Fannin County, Texas 35,514
Mineral Wells, TX μSA 29,189 Palo Pinto County, Texas 29,189
none McAlester, OK μSA 43,654 Pittsburg County, Oklahoma 43,654
Ponca City, OK μSA 43,538 Kay County, Oklahoma 43,538
Fort Smith, AR-OK MSA 250,368 (whole MSA)
41,569 (Oklahoma part)
Sebastian County, Arkansas 127,827
Crawford County, Arkansas 63,257
Sequoyah County, Oklahoma 41,569
Franklin County, Arkansas 17,715
Ada, OK μSA 38,284 Pontotoc County, Oklahoma 38,284
Joplin-Miami, MO-OK-KS CSA 244,590 (whole CSA)

39,803 (Oklahoma part)

Joplin, MO-KS MSA 204,787 (whole MSA)
19,054 (Kansas part)
Jasper County, Missouri 125,056
Newton County, Missouri 60,677
Cherokee County, Kansas 19,054
Miami, OK μSA 39,803 Ottawa County, Oklahoma 39,803
none Weatherford, OK μSA 29,003 Custer County, Oklahoma 29,003
Altus, OK μSA 24,530 Jackson County, Oklahoma 24,530
Woodward, OK μSA 27,929 Woodward County, Oklahoma 24,070
Ellis County, Oklahoma 3,859
Elk City, OK μSA 21,859 Beckham County, Oklahoma 21,859
Guymon, OK μSA 19,983 Texas County, Oklahoma 19,983
none Le Flore County, Oklahoma 49,853
Delaware County, Oklahoma 43,009
Mayes County, Oklahoma 41,100
McCurtain County, Oklahoma 32,832
Caddo County, Oklahoma 28,762
Garvin County, Oklahoma 27,711
Seminole County, Oklahoma 24,258
Adair County, Oklahoma 22,194
McIntosh County, Oklahoma 19,596
Marshall County, Oklahoma 16,931
Kingfisher County, Oklahoma 15,765
Choctaw County, Oklahoma 14,672
Craig County, Oklahoma 14,142
Murray County, Oklahoma 14,073
Atoka County, Oklahoma 13,758
Hughes County, Oklahoma 13,279
Haskell County, Oklahoma 12,627
Okfuskee County, Oklahoma 11,993
Noble County, Oklahoma 11,131
Pushmataha County, Oklahoma 11,096
Johnston County, Oklahoma 11,085
Washita County, Oklahoma 10,916
Nowata County, Oklahoma 10,076
Latimer County, Oklahoma 10,073
Blaine County, Oklahoma 9,429
Woods County, Oklahoma 8,793
Kiowa County, Oklahoma 8,708
Major County, Oklahoma 7,629
Tillman County, Oklahoma 7,250
Jefferson County, Oklahoma 6,002
Greer County, Oklahoma 5,712
Alfalfa County, Oklahoma 5,702
Coal County, Oklahoma 5,495
Beaver County, Oklahoma 5,311
Dewey County, Oklahoma 4,891
Grant County, Oklahoma 4,333
Harper County, Oklahoma 3,688
Roger Mills County, Oklahoma 3,583
Harmon County, Oklahoma 2,653
Cimarron County, Oklahoma 2,137
State of Oklahoma 3,956,971

See also

Notes

    Related Research Articles

    In the United States, a metropolitan statistical area (MSA) is a geographical region with a relatively high population density at its core and close economic ties throughout the region. Such regions are not legally incorporated as a city or town would be and are not legal administrative divisions like counties or separate entities such as states. As a result, sometimes the precise definition of a given metropolitan area will vary between sources. The statistical criteria for a standard metropolitan area were defined in 1949 and redefined as a metropolitan statistical area in 1983.
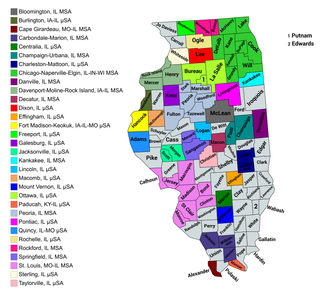
    <span class="mw-page-title-main">Illinois statistical areas</span> Illinois statistical areas

    The U.S. State of Illinois currently has 43 statistical areas that have been delineated by the Office of Management and Budget (OMB). On March 6, 2020, the OMB delineated 11 combined statistical areas, 13 metropolitan statistical areas, and 19 micropolitan statistical areas in Illinois.
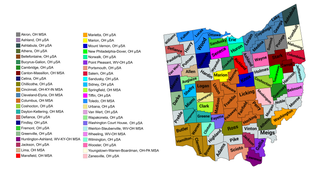
    <span class="mw-page-title-main">Ohio statistical areas</span> Ohio statistical areas

    The U.S. State of Ohio currently has 55 statistical areas that have been delineated by the Office of Management and Budget (OMB). On July 21, 2023, the OMB delineated 11 combined statistical areas, 15 metropolitan statistical areas, and 29 micropolitan statistical areas in Ohio.
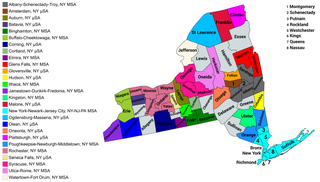
    <span class="mw-page-title-main">New York statistical areas</span>

    The U.S. state of New York currently has 34 statistical areas that have been delineated by the Office of Management and Budget (OMB). On March 6, 2020, the OMB delineated seven combined statistical areas, 14 metropolitan statistical areas, and 13 micropolitan statistical areas in New York.
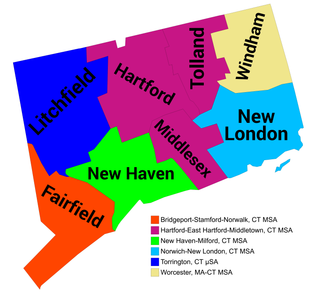
    <span class="mw-page-title-main">Connecticut statistical areas</span> Connecticut statistical areas

    The U.S. State of Connecticut currently has nine statistical areas that have been delineated by the Office of Management and Budget (OMB). On March 6, 2020, the OMB delineated three combined statistical areas, five metropolitan statistical areas, and one micropolitan statistical area in Connecticut.
    <span class="mw-page-title-main">Wisconsin statistical areas</span> Wisconsin statistical areas

    The U.S. State of Wisconsin currently has 36 statistical areas that have been delineated by the Office of Management and Budget (OMB). On March 6, 2020, the OMB delineated nine combined statistical areas, 15 metropolitan statistical areas, and 12 micropolitan statistical areas in Wisconsin.

    <span class="mw-page-title-main">Mississippi statistical areas</span> Mississippi statistical areas

    The U.S. State of Mississippi currently has 30 statistical areas that have been delineated by the Office of Management and Budget (OMB). On March 6, 2020, the OMB delineated seven combined statistical areas, four metropolitan statistical areas, and 19 micropolitan statistical areas in Mississippi.

    <span class="mw-page-title-main">Arizona statistical areas</span> Arizona statistical areas

    The U.S. State of Arizona currently has 13 statistical areas that have been delineated by the Office of Management and Budget (OMB). On March 6, 2020, the OMB delineated two combined statistical areas, seven metropolitan statistical areas, and four micropolitan statistical areas in Arizona. The most populous of these statistical areas is the Phoenix-Mesa, AZ Combined Statistical Area with a 2020 Census population of 4,899,104.
    <span class="mw-page-title-main">Hawaii statistical areas</span> Hawaii statistical areas

    The U.S. State of Hawaiʻi currently has four statistical areas that have been delineated by the Office of Management and Budget (OMB). On July 21, 2023, the OMB delineated two metropolitan statistical areas and two micropolitan statistical areas in Hawaiʻi. The most populous of these statistical areas is the Honolulu, HI Metropoitan Statistical Area with a 2020 Census population of 1,016,508.

    <span class="mw-page-title-main">Iowa statistical areas</span> Iowa statistical areas

    The U.S. State of Iowa currently has 30 statistical areas that have been delineated by the Office of Management and Budget (OMB). On March 6, 2020, the OMB delineated six combined statistical areas, nine metropolitan statistical areas, and 15 micropolitan statistical areas in Iowa.

    <span class="mw-page-title-main">Kansas statistical areas</span> Kansas statistical areas

    The U.S. State of Kansas currently has 23 statistical areas that have been delineated by the Office of Management and Budget (OMB). On March 6, 2020, the OMB delineated three combined statistical areas, seven metropolitan statistical areas, and 13 micropolitan statistical areas in Kansas.

    The U.S. State of Maryland currently has 12 statistical areas that have been delineated by the Office of Management and Budget (OMB). On March 6, 2020, the OMB delineated three combined statistical areas, seven metropolitan statistical areas, and two micropolitan statistical areas in Maryland.

    <span class="mw-page-title-main">West Virginia statistical areas</span> West Virginia statistical areas

    The U.S. State of West Virginia currently has 20 statistical areas that have been delineated by the Office of Management and Budget (OMB). On July 21, 2023, the OMB delineated five combined statistical areas, 10 metropolitan statistical areas, and five micropolitan statistical areas in West Virginia.

    <span class="mw-page-title-main">Louisiana statistical areas</span> Louisiana statistical areas

    The U.S. State of Louisiana currently has 25 statistical areas that have been delineated by the Office of Management and Budget (OMB). On July 21, 2023, the OMB delineated six combined statistical areas, ten metropolitan statistical areas, and nine micropolitan statistical areas in Louisiana.

    <span class="mw-page-title-main">Maine statistical areas</span> Maine statistical areas

    The U.S. State of Maine currently has five statistical areas that have been delineated by the Office of Management and Budget (OMB). On July 21, 2023, the OMB delineated one combined statistical area, three metropolitan statistical areas, and one micropolitan statistical area in Maine.

    <span class="mw-page-title-main">New Hampshire statistical areas</span> New Hampshire statistical areas

    The U.S. State of New Hampshire currently has eight statistical areas that have been delineated by the Office of Management and Budget (OMB). On July 21, 2023, the OMB delineated two combined statistical areas, two metropolitan statistical areas, and four micropolitan statistical areas in New Hampshire.

    <span class="mw-page-title-main">Oregon statistical areas</span> Oregon statistical areas

    The U.S. State of Oregon currently has 24 statistical areas that have been delineated by the Office of Management and Budget (OMB). On March 6, 2020, the OMB delineated four combined statistical areas, eight metropolitan statistical areas, and 12 micropolitan statistical areas in Oregon.
    <span class="mw-page-title-main">South Carolina statistical areas</span> South Carolina statistical areas

    The U.S. State of South Carolina currently has 20 statistical areas that have been delineated by the Office of Management and Budget (OMB). On July 21, 2023, the OMB delineated four combined statistical areas, ten metropolitan statistical areas, and six micropolitan statistical areas in South Carolina.

    The Commonwealth of Puerto Rico currently has 15 statistical areas that have been delineated by the United States Office of Management and Budget (OMB). On March 6, 2020, the OMB delineated three combined statistical areas, eight metropolitan statistical areas, and four micropolitan statistical areas in Puerto Rico.
    References

    1. 1 2 3 4 Revised Delineations of Metropolitan Statistical Areas, Micropolitan Statistical Areas, and Combined Statistical Areas, and Guidance on Uses of the Delineations of These Areas (March 6, 2020). "0MB BULLETIN NO. 20-01" (PDF). Office of Management and Budget . Retrieved December 15, 2021.{{cite web}}: CS1 maint: multiple names: authors list (link)
    2. 1 2 3 4 5 "2020 Standards for Delineating Core Based Statistical Areas". Office of Management and Budget. July 16, 2021. Retrieved December 13, 2021.
    3. 1 2 3 "Annual Estimates of the Resident Population for Counties in the United States: April 1, 2010 to July 1, 2019". United States Census Bureau, Population Division. April 2020. Retrieved April 9, 2020.

    35°35′20″N97°29′39″W / 35.5889°N 97.4943°W / 35.5889; -97.4943 (State of Oklahoma)