Home ownership in Australia

Last updated

Percentage of dwellings owned outright in Australia divided geographically by statistical local area, as of the 2011 census Australian Census 2011 demographic map - Australia by SLA - BCP field 5088 Owned outright Total.svg
Percentage of dwellings owned outright in Australia divided geographically by statistical local area, as of the 2011 census
Percentage of dwellings owned with a mortgage in Australia divided geographically by statistical local area, as of the 2011 census Australian Census 2011 demographic map - Australia by SLA - BCP field 5094 Owned with a mortgage Total.svg
Percentage of dwellings owned with a mortgage in Australia divided geographically by statistical local area, as of the 2011 census
An Old English-style family home in suburban Sydney (1)Old English style house Killara-1.jpg
An Old English-style family home in suburban Sydney

Home ownership in Australia is considered a key cultural icon, [1] and part of the Australian tradition known as the Great Australian Dream of "owning a detached house on a fenced block of land." [1] [2] Home ownership has been seen as creating a responsible citizenry; according to a former Premier of Victoria: "The home owner feels that he has a stake in the country, and that he has something worth working for, living for, fighting for." [3]

Contents

In 2016 there were about 9.9 million private dwellings in Australia, [4] each with, on average, 2.6 occupants. [5] In 1966 about 70% of dwellings were owner-occupied [6] – one of the largest proportions of any country. The remainder were rented dwellings. About half of the owner-occupied dwellings were under mortgage. [6]

Owner-occupied housing in Australia is not treated as an investment asset. Mortgage interest is not tax deductible as, for example, in the United States. An owner-occupied residential home is not subject to the capital gains tax on sale and is not counted in the assets test for Centrelink pension purposes. It is also not taxed for land tax, although such taxes are traditionally determined at a state level.

In the past, home ownership has been described as equalising; in postwar Australia, immigrant Australians could often buy homes as quickly as native-born Australians. [2] Additionally, Australian suburbs have been more socio-economically mixed than those in America and to a lesser extent Britain. In Melbourne, for instance, one early observer noted that "a poor house stands side by side with a good house." [2]

There are significant regional differences in rates of homeownership around Australia, reflecting average age differences (e.g., older age people tend to own houses more than younger people), as well as socio-economic differences. [7]

Statistics

In the 2015–16 Survey of Income and Housing, it was found that an estimated 30% of households owned their homes outright (i.e. without a mortgage) and 37% were owners with a mortgage. A further 25% were renting from a private landlord and 4% were renting from a state or territory housing authority. [8]

Between June 1995 and June 2015, the proportion of households without a mortgage declined from 42% to 31%, while the proportion with a mortgage rose from 30% to 36%. [7] Since 1999-2000 the proportion of households renting from state/territory housing authorities has declined from 6% to 3% while the proportion renting privately increased from 20% to 26% in 2019-20. [9] While a greater proportion of all renting households are renting from private landlords, there is an increased number of private renters receiving Commonwealth rent assistance. [6] [10]

Home ownership in Australia decreased to 67% in 2011, the lowest level in over 50 years. Tasmania has the highest home-ownership rate at 70%, and the Northern Territory the lowest at 46%. [5]

As of the 2016 Census, home ownership in Australia had decreased to 65%. [11]

Property as an investment

The 25% of dwellings which are rented by private landlords may be considered income-producing or investment properties, and the private landlords as investors, though some owner-occupiers may also view their dwellings as investments. Private landlords generally collect rent from a tenant as taxable income, whilst an owner-occupier derives imputed rent from living in the dwelling, and is also not subject to capital gains tax. Similarly, the investor can claim expenses relating to the property, including property taxes, interest and depreciation, whilst the owner-occupier cannot. The rent paid by a tenant for private or domestic purposes is not generally an allowable deduction of the tenant, nor are any expenses relating to the property. [ citation needed ]

Affordability

A modern single family Australian home in East Killara, New South Wales 119 Springdale Road, East Killara, New South Wales (2010-12-04).jpg
A modern single family Australian home in East Killara, New South Wales

Home ownership in Australia is becoming more exclusive. The ratio of the price of the average home to Australians' average income was at an all-time high in the late 1990s. [12] Young people are buying homes at the lowest rates ever, and changes in work patterns are reducing many households' ability to retain their homes. [13]

Characteristics

New homes have increased in size [14] and hold fewer people on average than in the past. [15] The proportion of houses with four or more bedrooms increased from 15% in 1971 to greater than 30% in 2001. [16]

Immigration to Australia

A number of economists, such as Macquarie Bank analyst Rory Robertson, assert that high immigration and the propensity of new arrivals to cluster in the capital cities is exacerbating the nation's housing affordability problem. [17] According to Robertson, Federal Government policies that fuel demand for housing, such as the currently high levels of immigration, as well as capital gains tax discounts and subsidies to boost fertility, have had a greater impact on housing affordability than land release on urban fringes. [18]

The Productivity Commission Inquiry Report No. 28 First Home Ownership (2004) also stated, in relation to housing, "that Growth in immigration since the mid-1990s has been an important contributor to underlying demand, particularly in Sydney and Melbourne." [19] This has been exacerbated by Australian lenders relaxing credit guidelines for temporary residents, allowing them to buy a home with a 10 percent deposit.

The RBA in its submission to the same PC Report also stated "rapid growth in overseas visitors such as students may have boosted demand for rental housing". [19] However, in question in the report was the statistical coverage of resident population. The "ABS population growth figures omit certain household formation groups – namely, overseas students and business migrants who do not continuously stay for 12 months in Australia." [19] This statistical omission lead to the admission: "The Commission recognises that the ABS resident population estimates have limitations when used for assessing housing demand. Given the significant influx of foreigners coming to work or study in Australia in recent years, it seems highly likely that short-stay visitor movements may have added to the demand for housing. However, the Commissions are unaware of any research that quantifies the effects." [19]

Some individuals and interest groups have also argued that immigration causes overburdened infrastructure. [20] [21]

Foreign investment in residential property

In December 2008, the federal government introduced legislation relaxing rules for foreign buyers of Australian property. According to FIRB (Foreign Investment Review Board) data released in August 2009, foreign investment in Australian real estate had increased by more than 30% year to date. One agent said that "overseas investors buy them to land bank, not to rent them out. The houses just sit vacant because they are after capital growth." [22]

Inner-city apartment boom

To cope with the high demand of housing, the desirability in renting, and most significantly an influx of immigration, major Australian cities have seen a boom in high-rise apartment construction. According to ABC News and UBS, the number of cranes on Australian high-rise sites levelled out at a peak of 548, having surged 323% since late-2013. [23]

See also

Related Research Articles

Owner-occupancy or home-ownership is a form of housing tenure in which a person, called the owner-occupier, owner-occupant, or home owner, owns the home in which they live. The home can be a house, such as a single-family house, an apartment, condominium, or a housing cooperative. In addition to providing housing, owner-occupancy also functions as a real estate investment.

Imputed rent is the rental price an individual would pay for an asset they own. The concept applies to any capital good, but it is most commonly used in housing markets to measure the rent homeowners would pay for a housing unit equivalent to the one they own. Imputing housing rent is necessary to measure economic activity in national accounts. Because asset owners do not pay rent, owners' imputed rent must be measured indirectly.

<span class="mw-page-title-main">Landlord</span> Owner of a rented building, land or real estate

A landlord is the owner of a house, apartment, condominium, land, or real estate which is rented or leased to an individual or business, who is called a tenant. When a juristic person is in this position, the term landlord is used. Other terms include lessor, housing provider, and owner. The term landlady may be used for the female owners. The manager of a pub in the United Kingdom, strictly speaking a licensed victualler, is referred to as the landlord/landlady. In political economy it refers to the owner of natural resources alone from which an economic rent, a form of passive income, is the income received.

<span class="mw-page-title-main">Real estate economics</span> Application of economic techniques to real estate markets

Real estate economics is the application of economic techniques to real estate markets. It tries to describe, explain, and predict patterns of prices, supply, and demand. The closely related field of housing economics is narrower in scope, concentrating on residential real estate markets, while the research on real estate trends focuses on the business and structural changes affecting the industry. Both draw on partial equilibrium analysis, urban economics, spatial economics, basic and extensive research, surveys, and finance.

<span class="mw-page-title-main">Affordability of housing in the United Kingdom</span> Housing affordability in the UK

The affordability of housing in the UK reflects the ability to rent or buy property. There are various ways to determine or estimate housing affordability. One commonly used metric is the median housing affordability ratio; this compares the median price paid for residential property to the median gross annual earnings for full-time workers. According to official government statistics, housing affordability worsened between 2020 and 2021, and since 1997 housing affordability has worsened overall, especially in London. The most affordable local authorities in 2021 were in the North West, Wales, Yorkshire and The Humber, West Midlands and North East.

A real-estate bubble or property bubble is a type of economic bubble that occurs periodically in local or global real estate markets, and it typically follows a land boom. A land boom is a rapid increase in the market price of real property such as housing until they reach unsustainable levels and then declines. This period, during the run-up to the crash, is also known as froth. The questions of whether real estate bubbles can be identified and prevented, and whether they have broader macroeconomic significance, are answered differently by schools of economic thought, as detailed below.

The private rented sector (PRS) is a classification of United Kingdom housing tenure as described by the Ministry of Housing, Communities and Local Government, a UK government department that monitors the national housing supply.

<span class="mw-page-title-main">Affordable housing</span> Housing affordable to those with a median household income

Affordable housing is housing which is deemed affordable to those with a household income at or below the median as rated by the national government or a local government by a recognized housing affordability index. Most of the literature on affordable housing refers to mortgages and a number of forms that exist along a continuum – from emergency homeless shelters, to transitional housing, to non-market rental, to formal and informal rental, indigenous housing, and ending with affordable home ownership.

<span class="mw-page-title-main">Homeownership in the United States</span> Percentage of homes owned by their occupants

The homeownership rate in the United States is the percentage of homes that are owned by their occupants. In 2009, it remained similar to that in some other post-industrial nations with 67.4% of all occupied housing units being occupied by the unit's owner. Homeownership rates vary depending on demographic characteristics of households such as ethnicity, race, type of household as well as location and type of settlement. In 2018, homeownership dropped to a lower rate than it was in 1994, with a rate of 64.2%.

<span class="mw-page-title-main">Australian property market</span> Overview of Australian property market

The Australian property market comprises the trade of land and its permanent fixtures located within Australia. The average Australian property price grew 0.5% per year from 1890 to 1990 after inflation, however rose from 1990 to 2017 at a faster rate. House prices in Australia receive considerable attention from the media and the Reserve Bank and some commentators have argued that there is an Australian property bubble.

<span class="mw-page-title-main">Australian property bubble</span>

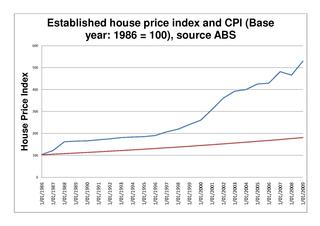
The Australian property bubble is the economic theory that the Australian property market has become or is becoming significantly overpriced and due for a significant downturn. Since the early 2010s, various commentators, including one Treasury official, have claimed the Australian property market is in a significant bubble.

<span class="mw-page-title-main">Housing in Victoria, Australia</span> Detailing housing in Victoria, Australia

Housing in the state of Victoria, Australia is characterised by high rates of private housing ownership, minimal and lack of public housing and high demand for, and largely unaffordable, rental housing. Outside of Melbourne, home to 70% of the state's population, housing and rent is more affordable. In Melbourne, access to public housing is generally better, but housing and rent are less affordable.

<span class="mw-page-title-main">Affordable housing in Canada</span>

Affordable housing in Canada is living spaces that are deemed financially accessible to those with a median household income in Canada. The property ladder continuum of affordable housing in Canada includes market, non-market, and government-subsidized housing.

<span class="mw-page-title-main">Housing in the United Kingdom</span> Overview of housing in the United Kingdom

Housing in the United Kingdom represents the largest non-financial asset class in the UK; its overall net value passed the £5 trillion mark in 2014. Housing includes modern and traditional styles. About 30% of homes are owned outright by their occupants, and a further 40% are owner-occupied on a mortgage. About 18% are social housing of some kind, and the remaining 12% are privately rented.

The property bubble in New Zealand is a major national economic and social issue. Since the early 1990s, house prices in New Zealand have risen considerably faster than incomes, putting increasing pressure on public housing providers as fewer households have access to housing on the private market. The property bubble has produced significant impacts on inequality in New Zealand, which now has one of the highest homelessness rate in the OECD and a record-high waiting list for public housing. Government policies have attempted to address the crisis since 2013, but have produced limited impacts to reduce prices or increase the supply of affordable housing. However, prices started falling in 2022 in response to tightening of mortgage availability and supply increasing. Some areas saw drops as high as around 9% - albeit from very high prices.

<span class="mw-page-title-main">Affordable housing by country</span>

Affordable housing is housing that is deemed affordable to those with a median household income as rated by the national government or a local government by a recognized housing affordability index. A general rule is no more than 30% of gross monthly income should be spent on housing, to be considered affordable as the challenges of promoting affordable housing varies by location.

The Canadian property bubble refers to a significant rise in Canadian real estate prices from 2002 to present which some observers have called a real estate bubble. The Dallas Federal reserve rated Canadian real estate as "exuberant" beginning in 2003. From 2003 to 2018, Canada saw an increase in home and property prices of up to 337% in some cities. In 2016, the OECD warned that Canada's financial stability was at risk due to elevated housing prices, investment and household debt. By 2018, home-owning costs were above 1990 levels when Canada saw its last housing bubble burst. Bloomberg Economics ranked Canada as the second largest housing bubble across the OECD in 2019 and 2021. Toronto scored the highest in the world in Swiss bank UBS' real estate bubble index in 2022, with Vancouver also scoring among the 10 riskiest cities in the world. By 2023 Canada’s nonfinancial debt exceeded 300% of GDP and household debt surpassed 100% of GDP, both higher than the levels seen in the United States before the 2008 global financial crisis.

Negative gearing in Australia deals with the laws in the Australian income tax system relating to net loss suffered by a taxpayer on their investment property, commonly called negative gearing. Negative gearing can arise in a number of contexts; for example, with real estate investments, it arises when the net rental income is less than the mortgage loan interest payable, and with shares, when net dividend income is less than the interest payable on a margin loan.

Judith Nancy Yates was an Australian housing economist. She was a lecturer and associate professor at the University of Sydney from 1971 to 2009. As a social liberal economist, she published over 120 papers in academic journals and government and industry reports on most aspects of Australia's housing sector, most notably on distributional aspects of the tax and finance system, on affordability and the supply of low-rent housing.Throughout her career she was appointed to a number of government advisory committees, and she contributed to many government inquiries.

The Australian residential property market is the section of the Australian property market that provides rental properties by landlords to tenants. In Australia 31% of households rent their residences. The vast majority rent from private landlords, and a small minority rent from public housing authorities. Over the last three decades the proportion of Australians in public housing has halved, whilst the amount renting privately has grown. The average weekly price for a rental in Australia is $570 AUD. Sydney has the most expensive capital city rents. Rental rates have increased faster than inflation in recent years.

References

  1. 1 2 Winter, Ian and Wendy Stone. Social Polarisation and Housing Careers: Exploring the Interrelationship of Labour and Housing Markets in Australia. Australian Institute of Family Studies. March 1998.
  2. 1 2 3 Davison, Graeme. "The Past & Future of the Australian Suburb." Australian Planner (Dec. 1994): 63–69.
  3. Kemeny, Jim. "The Ideology of Home Ownership." Urban Planning in Australia: Critical Readings, ed. J. Brian McLoughlin and Margo Huxley. Melbourne: Longman Cheshire Pty Limited, 1986. p256-7.
  4. 2016 Census QuickStats: Australia
  5. 1 2 "Fact file: 9 million homes (2011 Census) with 2.6 occupants - this is the Australian housing market - Fact Check - ABC News (Australian Broadcasting Corporation)". ABC News. Abc.net.au. 6 May 2015. Retrieved 30 May 2018.
  6. 1 2 3 Australian Bureau of Statistics HOME OWNERS AND RENTERS
  7. 1 2 Hall, Alicia. "Trends in home ownership in Australia: a quick guide". www.aph.gov.au. Parliament of Australia. Retrieved 21 April 2019.
  8. "6523.0 – Household Income and Wealth, Australia, 2015–16". Australian Bureau of Statistics. 13 September 2017. Retrieved 21 April 2019.
  9. "Housing Occupancy and Costs". Australian Bureau of Statistics. 25 May 2022. Retrieved 19 September 2022.
  10. "Housing Assistance". Australian Bureau of Statistics. 24 May 2012. Retrieved 30 May 2018.
  11. "Home ownership remains strong in Australia but it masks other problems: Census data". Theconversation.com. Retrieved 30 May 2018.
  12. Badcock, Blair and Andrew Beer. Home Truths: Property Ownership and Housing Wealth in Australia. Melbourne: Melbourne University Press, 2000, p128.
  13. Badcock, Blair and Andrew Beer. Home Truths: Property Ownership and Housing Wealth in Australia. Melbourne: Melbourne University Press, 2000, p150-152.
  14. "8731.0 - Building Approvals, Australia, Feb 2008". Abs.gov.au. 2 June 2008. Retrieved 30 May 2018.
  15. Australian Bureau of Statistics. Australia Social Trends 1994: Housing – Housing Stock: Housing the Population. 18 November 2002.
  16. Australian Bureau of Statistics. Australia Social Trends: Housing – . 22 April 2004.
  17. Klan, A. (17 March 2007) Locked out Archived 22 October 2008 at the Wayback Machine
  18. Wade, M. (9 September 2006) PM told he's wrong on house prices
  19. 1 2 3 4 "Microsoft Word - prelims.doc" (PDF). Archived from the original (PDF) on 3 June 2011. Retrieved 14 July 2011.
  20. Claus, E (2005) Submission to the Productivity Commission on Population and Migration Archived 27 September 2007 at the Wayback Machine (submission 12 to the Productivity Commission's position paper on Economic Impacts of Migration and Population Growth).
  21. Nilsson (2005) Negative Economic Impacts of Immigration and Population Growth Archived 27 September 2007 at the Wayback Machine (submission 9 to the Productivity Commission's position paper on Economic Impacts of Migration and Population Growth).
  22. "Foreign buyers blow out the housing bubble". Crikey.com.au. 21 September 2009. Retrieved 20 January 2016.
  23. "Housing market 'top' called by investment bank UBS". ABC . 24 April 2017. Retrieved 24 April 2017.