List of countries by suicide rate

Last updated

Map of the suicide rate (age-standardized, per 100,000 population) in the world as of 2019.
.mw-parser-output figure[typeof="mw:File/Thumb"] .image-key>ol{margin-left:1.3em;margin-top:0}.mw-parser-output figure[typeof="mw:File/Thumb"] .image-key>ul{margin-top:0}.mw-parser-output figure[typeof="mw:File/Thumb"] .image-key li{page-break-inside:avoid;break-inside:avoid-column}@media(min-width:300px){.mw-parser-output figure[typeof="mw:File/Thumb"] .image-key,.mw-parser-output figure[typeof="mw:File/Thumb"] .image-key-wide{column-count:2}.mw-parser-output figure[typeof="mw:File/Thumb"] .image-key-narrow{column-count:1}}@media(min-width:450px){.mw-parser-output figure[typeof="mw:File/Thumb"] .image-key-wide{column-count:3}}
.mw-parser-output .plainlist ol,.mw-parser-output .plainlist ul{line-height:inherit;list-style:none;margin:0;padding:0}.mw-parser-output .plainlist ol li,.mw-parser-output .plainlist ul li{margin-bottom:0}
.mw-parser-output .legend{page-break-inside:avoid;break-inside:avoid-column}.mw-parser-output .legend-color{display:inline-block;min-width:1.25em;height:1.25em;line-height:1.25;margin:1px 0;text-align:center;border:1px solid black;background-color:transparent;color:black}.mw-parser-output .legend-text{}
> 30
20-30
15-20
10-15
5-10
0-5
Data unavailable Map of countries by suicide rate, WHO (2019).svg
Map of the suicide rate (age-standardized, per 100,000 population) in the world as of 2019.
  •   > 30
  •   20–30
  •   15–20
  •   10–15
  •   5–10
  •   0–5
  •   Data unavailable

The following are lists of countries by estimated suicide rates as published by the World Health Organization (WHO) and other sources. [note 1]

Contents

In many countries, suicide rates are underreported due to social stigma, cultural or legal concerns. [3] Thus, these figures cannot be used to compare real suicide rates, which are unknown in most countries.

As of 2016, there was an estimated global suicide rate of 10.5 per 100,000 population [4] down from 11.6 in 2008. [5] In high-income modernized countries male and female rates of suicidal behaviors differ much compared to those in the rest of the world: while women are reportedly more prone to suicidal thoughts, rates of suicide are higher among men, which has been described as a "silent epidemic". [6] [7] [8] [9] [10]

A study in 2019 found that between 1990 and 2016 global age-standardized suicide rates fell by a third; the rates in 2016 were about 16 deaths per 100,000 men and 7 deaths per 100,000 women. Women experienced a greater decrease compared with men over the study period. [11] [12]

In much of the world, suicide is stigmatized and condemned for religious or cultural reasons. In some countries, suicidal behavior is a criminal offence punishable by law. Suicide is therefore often a secretive act surrounded by taboo, and may be unrecognized, misclassified or deliberately hidden in official records of death. [6]

World Health Organization (2002)

As such, suicide rates may be higher than measured, with men more at risk of dying by suicide than women across nearly all cultures and backgrounds. [13] Suicide prevention and intervention is an important topic for all peoples, according to the WHO. [14]

Countries and territories by suicide rate

Suicide rates by gender and country (age-standardized, per 100,000 population, World Health Organization, 2019) [15]
Country20192000%
change
AllFemaleMaleM/F
 World9.05.412.62.314.0-0.36
Flag of Lesotho.svg Lesotho 87.534.6146.94.342.61.05
Flag of Guyana.svg Guyana 40.917.065.03.835.80.14
Flag of Eswatini.svg Eswatini 40.56.478.712.340.60.00
Flag of Kiribati.svg Kiribati 30.69.553.65.735.6-0.14
Flag of the Federated States of Micronesia.svg Micronesia 29.013.244.33.428.00.04
Flag of Suriname.svg Suriname 25.911.841.33.525.00.04
Flag of Zimbabwe.svg Zimbabwe 23.613.537.82.820.00.18
Flag of South Africa.svg South Africa 23.59.837.93.926.6-0.12
Flag of Mozambique.svg Mozambique 23.28.942.64.820.90.11
Flag of the Central African Republic.svg Central African Republic 23.09.339.64.332.5-0.29
Flag of Russia.svg Russia 21.67.238.25.348.9-0.56
Flag of South Korea.svg South Korea 21.213.429.92.213.90.52
Flag of Vanuatu.svg Vanuatu 21.09.033.13.723.2-0.10
Flag of Botswana.svg Botswana 20.27.835.54.646.3-0.56
Flag of Lithuania.svg Lithuania 20.26.236.15.845.8-0.56
Flag of Uruguay.svg Uruguay 18.87.731.14.114.50.30
Flag of Kazakhstan.svg Kazakhstan 18.16.930.94.539.4-0.54
Flag of Mongolia.svg Mongolia 18.05.631.15.523.6-0.24
Flag of Ukraine.svg Ukraine 17.74.732.77.033.5-0.47
Flag of the Solomon Islands.svg Solomon Islands 17.42.432.213.417.40.00
Flag of Eritrea.svg Eritrea 17.38.327.23.323.4-0.26
Flag of Belarus.svg Belarus 16.55.330.15.737.3-0.56
Flag of Montenegro.svg Montenegro 16.27.925.43.218.9-0.14
Flag of Latvia.svg Latvia 16.14.629.06.429.6-0.46
Flag of Cameroon.svg Cameroon 15.97.625.23.319.1-0.17
Flag of Cote d'Ivoire.svg Ivory Coast 15.75.025.75.124.0-0.35
Flag of Cape Verde.svg Cape Verde 15.25.127.45.418.2-0.16
Flag of Togo.svg Togo 14.86.524.03.717.3-0.14
Flag of Somalia.svg Somalia 14.77.122.83.216.8-0.13
Flag of Samoa.svg Samoa 14.67.820.92.716.3-0.10
Flag of the United States.svg United States 14.56.822.43.310.00.45
Flag of Zambia.svg Zambia 14.45.325.74.924.0-0.40
Flag of Burkina Faso.svg Burkina Faso 14.46.524.53.816.9-0.15
Flag of Slovenia.svg Slovenia 14.05.522.74.125.6-0.46
Flag of Belgium (civil).svg Belgium 13.98.419.62.318.3-0.24
Flag of Namibia.svg Namibia 13.54.424.95.727.5-0.51
Flag of Equatorial Guinea.svg Equatorial Guinea 13.58.818.52.119.4-0.30
Flag of Finland.svg Finland 13.46.820.13.021.7-0.38
Flag of Chad.svg Chad 13.26.920.22.915.7-0.16
Flag of Gabon.svg Gabon 13.13.823.36.119.4-0.32
Flag of India.svg India 12.911.114.71.319.1-0.32
Flag of Sri Lanka.svg Sri Lanka 12.96.120.93.427.4-0.53
Flag of Benin.svg Benin 12.76.120.33.314.7-0.14
Flag of Angola.svg Angola 12.64.721.74.617.6-0.28
Flag of the Democratic Republic of the Congo.svg DR Congo 12.45.020.74.114.5-0.14
Flag of Guinea-Bissau.svg Guinea-Bissau 12.46.719.83.017.5-0.29
Flag of Sweden.svg Sweden 12.47.716.92.212.20.01
Flag of Guinea.svg Guinea 12.38.018.42.39.70.27
Flag of Japan.svg Japan 12.26.917.52.518.1-0.32
Flag of Moldova.svg Moldova 12.23.322.16.716.3-0.25
Flag of Burundi.svg Burundi 12.16.418.93.023.4-0.48
Flag of Estonia.svg Estonia 12.04.520.24.525.0-0.52
Flag of Djibouti.svg Djibouti 11.97.616.32.212.1-0.01
Flag of Hungary.svg Hungary 11.85.519.13.526.6-0.56
Flag of the Republic of the Congo.svg Congo 11.66.118.33.024.7-0.53
Flag of Sierra Leone.svg Sierra Leone 11.38.214.81.810.10.11
Flag of Australia (converted).svg Australia 11.35.617.03.011.8-0.05
Flag of Haiti.svg Haiti 11.28.014.91.912.7-0.12
Flag of Iceland.svg Iceland 11.23.518.75.412.7-0.12
Flag of Kenya.svg Kenya 11.05.318.13.415.8-0.30
Flag of Croatia.svg Croatia 11.05.117.73.516.3-0.32
Flag of Senegal.svg Senegal 11.05.218.53.614.4-0.24
Flag of Malawi.svg Malawi 10.63.320.06.119.2-0.45
Flag of Ghana.svg Ghana 10.51.820.011.29.80.08
Flag of Uganda.svg Uganda 10.43.719.45.221.7-0.52
Flag of Austria.svg Austria 10.44.616.63.615.8-0.34
Flag of Canada (Pantone).svg Canada 10.35.415.32.910.7-0.03
Flag of New Zealand.svg New Zealand 10.35.415.42.912.4-0.17
Flag of Cuba.svg Cuba 10.24.116.74.115.6-0.35
Flag of Niger.svg Niger 10.16.414.12.29.50.07
Flag of Norway.svg Norway 9.96.313.42.113.0-0.24
Flag of Switzerland (Pantone).svg Switzerland 9.85.714.22.515.9-0.38
Flag of Nepal.svg Nepal 9.82.918.66.310.9-0.10
Flag of Pakistan.svg Pakistan 9.84.814.63.111.1-0.12
Flag of France.svg France 9.74.515.23.315.8-0.39
Flag of Singapore.svg Singapore 9.76.412.72.011.4-0.16
Flag of The Gambia.svg Gambia 9.66.213.32.111.1-0.13
Flag of Fiji.svg Fiji 9.56.013.12.211.7-0.19
Flag of the Czech Republic.svg Czech Republic 9.53.815.44.113.4-0.29
Flag of Ethiopia.svg Ethiopia 9.55.214.22.718.4-0.49
Flag of Rwanda.svg Rwanda 9.55.014.82.925.6-0.63
Flag of Slovakia.svg Slovakia 9.32.616.76.512.6-0.26
Flag of Poland.svg Poland 9.32.416.56.815.3-0.39
Flag of the Netherlands.svg Netherlands 9.36.112.52.18.10.15
Flag of Madagascar.svg Madagascar 9.25.413.32.510.8-0.15
Flag of Ireland.svg Ireland 8.93.614.34.012.1-0.26
Flag of Brazil.svg Brazil 6.42.810.33.64.50.42
Flag of Mauritius.svg Mauritius 8.82.515.05.911.5-0.24
Flag of Luxembourg.svg Luxembourg 8.65.411.82.213.4-0.36
Flag of the Comoros.svg Comoros 8.55.811.32.010.9-0.22
Flag of Kyrgyzstan (2023).svg Kyrgyzstan 8.33.513.53.817.6-0.53
Flag of Trinidad and Tobago.svg Trinidad and Tobago 8.33.713.13.616.2-0.49
Flag of Uzbekistan.svg Uzbekistan 8.34.911.82.412.0-0.31
Flag of Germany.svg Germany 8.33.912.83.311.2-0.26
Flag of Bosnia and Herzegovina.svg Bosnia and Herzegovina 8.33.413.54.08.10.01
Flag of North Korea.svg North Korea 8.26.310.61.710.3-0.20
Flag of Tanzania.svg Tanzania 8.23.713.53.615.6-0.48
Flag of Argentina.svg Argentina 8.13.313.54.19.2-0.12
Flag of Chile.svg Chile 8.03.013.44.510.5-0.24
Flag of Mali.svg Mali 8.05.710.51.88.8-0.09
Flag of Thailand.svg Thailand 8.02.313.96.011.6-0.31
Flag of Serbia.svg Serbia 7.93.912.23.118.9-0.58
Flag of Seychelles.svg Seychelles 7.71.314.010.59.8-0.21
Flag of Ecuador.svg Ecuador 7.73.611.93.36.80.12
Flag of Belize.svg Belize 7.71.813.67.510.0-0.24
Flag of Georgia.svg Georgia 7.72.214.06.46.60.16
Flag of Denmark.svg Denmark 7.64.211.12.612.5-0.39
Flag of Costa Rica.svg Costa Rica 7.61.913.36.96.90.11
Flag of Liberia.svg Liberia 7.45.59.41.78.8-0.16
Flag of Romania.svg Romania 7.32.412.65.311.3-0.35
Flag of Morocco.svg Morocco 7.34.710.12.110.8-0.33
Flag of Portugal.svg Portugal 7.23.511.63.45.50.32
Flag of Vietnam.svg Vietnam 7.24.210.62.57.20.01
Flag of Bahrain.svg Bahrain 7.22.39.94.37.00.02
Flag of North Macedonia.svg North Macedonia 7.23.511.03.18.7-0.17
Flag of Yemen.svg Yemen 7.15.39.01.78.5-0.17
Flag of the United Kingdom.svg United Kingdom 6.93.410.43.17.7-0.11
Flag of Nigeria.svg Nigeria 6.93.810.12.79.2-0.25
Flag of Saint Lucia.svg Saint Lucia 6.91.512.58.58.1-0.15
Bandera de Bolivia (Estado).svg Bolivia 6.84.29.62.38.4-0.19
Flag of South Sudan.svg South Sudan 6.73.410.43.17.9-0.15
Flag of the People's Republic of China.svg China 6.74.88.61.814.9-0.55
Flag of Bulgaria.svg Bulgaria 6.52.910.63.714.0-0.54
Flag of Guatemala.svg Guatemala 6.22.510.34.113.5-0.54
Flag of Paraguay.svg Paraguay 6.23.39.02.83.60.69
Flag of El Salvador.svg El Salvador 6.12.111.15.46.7-0.09
Flag of Turkmenistan.svg Turkmenistan 6.12.99.43.213.8-0.56
Flag of Laos.svg Laos 6.03.58.62.58.7-0.31
Flag of the Taliban.svg Afghanistan 6.05.76.21.17.7-0.23
Flag of Malaysia.svg Malaysia 5.82.49.03.86.1-0.05
Flag of Cambodia.svg Cambodia 5.53.18.42.86.8-0.20
Flag of Mauritania.svg Mauritania 5.53.97.41.96.4-0.14
Flag of Saudi Arabia.svg Saudi Arabia 5.41.97.84.13.80.41
Flag of Malta.svg Malta 5.32.38.43.76.0-0.11
Flag of Tajikistan.svg Tajikistan 5.33.47.42.25.10.05
Flag of Mexico.svg Mexico 5.42.28.74.03.90.37
Flag of Spain.svg Spain 5.32.87.92.86.6-0.20
Flag of the United Arab Emirates.svg United Arab Emirates 5.22.66.32.48.0-0.35
Flag of Israel.svg Israel 5.22.18.33.96.8-0.24
Flag of Iran.svg Iran 5.12.87.52.78.0-0.36
Flag of the Dominican Republic.svg Dominican Republic 5.11.98.54.64.90.04
Flag of Bhutan.svg Bhutan 5.13.16.82.26.9-0.27
Flag of Sudan.svg Sudan 4.83.36.31.95.6-0.14
Flag of Iraq.svg Iraq 4.72.47.33.05.3-0.10
Flag of Nicaragua.svg Nicaragua 4.71.97.84.16.3-0.26
Flag of Qatar.svg Qatar 4.71.75.73.47.6-0.39
Flag of East Timor.svg East Timor 4.52.46.72.84.9-0.07
Flag of Libya.svg Libya 4.52.96.12.15.3-0.15
Flag of Oman.svg Oman 4.51.16.45.76.7-0.33
Flag of Tonga.svg Tonga 4.42.95.92.05.1-0.15
Flag of Italy.svg Italy 4.32.16.73.25.5-0.22
Flag of Azerbaijan.svg Azerbaijan 4.01.56.64.53.40.16
Flag of Bangladesh.svg Bangladesh 3.91.76.03.66.9-0.44
Flag of Colombia.svg Colombia 3.71.76.03.55.3-0.29
Flag of Albania.svg Albania 3.72.25.32.45.2-0.29
Flag of Greece.svg Greece 3.61.55.94.12.90.27
Flag of Papua New Guinea.svg Papua New Guinea 3.61.95.22.72.80.26
Flag of Egypt.svg Egypt 3.42.24.72.13.6-0.06
Flag of the Bahamas.svg Bahamas 3.41.25.84.72.50.33
Flag of Cyprus.svg Cyprus 3.21.15.35.01.90.66
Flag of Tunisia.svg Tunisia 3.21.84.62.53.9-0.18
Flag of Myanmar.svg Myanmar 3.01.15.14.75.1-0.42
Flag of Panama.svg Panama 2.91.04.84.95.9-0.52
Flag of Lebanon.svg Lebanon 2.81.73.92.33.0-0.08
Flag of Maldives.svg Maldives 2.80.94.14.85.3-0.48
Flag of Peru.svg Peru 2.71.44.13.03.4-0.20
Flag of Armenia.svg Armenia 2.71.04.94.83.3-0.19
Flag of Kuwait.svg Kuwait 2.70.73.85.23.1-0.14
Flag of Algeria.svg Algeria 2.61.93.31.74.7-0.44
Flag of Honduras.svg Honduras 2.61.04.44.53.0-0.14
Flag of Indonesia.svg Indonesia 2.61.24.03.53.8-0.33
Flag of Brunei.svg Brunei 2.50.84.25.41.70.48
Flag of the Philippines.svg Philippines 2.51.33.92.92.30.12
Flag of Turkey.svg Turkey 2.31.23.63.04.2-0.44
Flag of Jamaica.svg Jamaica 2.31.03.63.62.10.11
Flag of Sao Tome and Principe.svg São Tomé and Príncipe 2.21.23.32.92.2-0.02
Flag of Syria.svg Syria 2.10.83.54.72.00.05
Flag of Venezuela.svg Venezuela 2.10.73.75.36.4-0.67
Flag of Jordan.svg Jordan 2.00.93.03.33.5-0.43
Flag of Saint Vincent and the Grenadines.svg Saint Vincent and the Grenadines 1.00.71.32.06.5-0.84
Flag of Grenada.svg Grenada 0.60.70.50.72.1-0.70
Flag of Antigua and Barbuda.svg Antigua and Barbuda 0.30.60.00.02.0-0.84
Flag of Barbados.svg Barbados 0.30.20.53.12.6-0.88

Analysis

Self-harm world map-Deaths per million persons-WHO2012.svg
Income groups 2014-2016 by GNI per capita.png
Deaths per million persons from self-inflicted injuries in 2012. Countries by income group.
Suicide rates by income group in 2012 (per 100,000 people) [16]
Income group (% of global pop)Suicides, 2012
(in thousands)
Global %Rate
(2012)
Male:Female
(2012)
High-income countries (18.3%)19724.5%12.73.5 : 1
Upper-middle-income countries (34.3%)19223.8%7.51.3 : 1
Lower-middle-income countries (35.4%)33341.4%14.11.7 : 1
Low-income countries (12.0%)8210.2%13.41.7 : 1
Global  (100.0%)804100.0%11.41.9 : 1

Male and female suicide rates are out of total male population and total female population, respectively (i.e. total number of male suicides divided by total male population). Age-standardized rates account for the influence that different population age distributions might have on the analysis of crude death rates, statistically addressing the prevailing trends by age-groups and populations' structures, to enhance long term cross-national comparability: based on age-groups' deviation from standardized population structures, rates are rounded up or down (age-adjustment). Basically, the presence of younger individuals in any given age structure carries more weight: if the rate is rounded up that means the median age is lower than average for that region (or country), and vice versa when rounded down.

Most countries listed above report a higher male suicide rate, as worldwide there are about 3 male suicides out of 4, or a factor of 3:1 (for example, [17] in the United States was 3.36 in 2015, and 3.53 in 2016). [lower-alpha 1]

Though age-standardization is common statistical process to categorize mortality data for comparing purposes this approach by WHO is based on estimates which take into account issues such as under-reporting, resulting in rates differing from the official national statistics prepared and endorsed by individual countries (and revisions are also performed periodically). Also, age-adjusted rates are mortality rates that would have existed if all populations under study had the same age distribution as a "standard" population. Plain, crude estimated rates are available at here and here. Countries with a population less than 100 000 are excluded.

Countries with large internal discrepancies are complicated to assess. Canada, a country with a comparatively low suicide rate overall at 10.3 incidents per 100,000 people, exhibits one such discrepancy. When comparing the suicide rate of Indigenous peoples in Canada, the rate of suicide increases to 24.3 incidents per 100,000 people: [19] a rate among the ten highest in the world. There are numerous differences in living standards and income that contribute to this phenomenon, classed as an epidemic in Canada. [20]

List by other sources and years (1985–2019)

Suicide rate per 100,000 people by country (1978-2009) Suicide rate.png
Suicide rate per 100,000 people by country (1978–2009)

In this list various sources from various years are included, mixing plain crude rates with age-adjusted rates and estimated rates, so cross-national comparability is somewhat skewed.

* indicates "Suicide in COUNTRY or TERRITORY" or "Mental Health in COUNTRY or TERRITORY" links.

  1. The male-female ratio shown below is based on the age-standardized rates: as compared to WHO world standard population, women's median age and life expectancy might be greater than that of men's for that country when rounded up, and vice versa when rounded down. [18]
  2. Nevertheless, jumping from a high building as well as drowning were common methods of suicide in Taiwan, [note 2] [33] [34] indicating the potential risks of type I and type II errors and misuse of statistics within the government's report. Hence, if halves of the death rates of the drowning and fall that were shown in government's report were extracted and added into the self-inflicted deaths (intentional injury death of self), it yields 0.0201% which is thought better reflecting the real case.
  3. Furthermore, jumping from a high building as well as drowning were common methods of suicide in Taiwan. [note 5] [33] [34]

See also

Explanatory notes

  1. The first global estimates on suicide mortality began in the early 1980s, as a single World Bank-commissioned study on general mortality data compiled by the WHO as the first work of its kind on the global burden of disease (GBD). [1] In the following years, the Institute for Health Metrics and Evaluation acted as the coordinating center for the study then resulted in the collaboration between several researchers and institutions from many countries. [2]
  2. In government's annual release, there were 3637 people per one hundred thousands of people in 2018 died of contacting poison, accidental fall, exposure to fire or smoke, accidental drowning including sinking beneath water to death in addition to the suicidal death that was equal to 3865 people per 100,000 people.
  3. Recently released figures by official Belgian authorities suggest a considerably higher rate of 17.0 persons (total) per 100,000 people per annum in 2009 (5,712 cases in a population of 10,749,000 (=10,666,866 as of 1 January 2008 increasing by 0,77% per annum.) as of 1 January 2009). "Toenemend aantal zelfdodingen in Belgie" (in Dutch). 2011. Archived from the original on 5 December 2012.
  4. The number of death in Belgium in 2008 due to suicide "zichzelf schade toebrengen" was reported at 2000 out of a total of 103.760 death. These death comprise 1453 men and 547 women. This puts the suicide rate at about 19 per 100.000. See statbel: http://statbel.fgov.be/nl/binaries/NL%20-%20Tableau%201%2E3_T_2008_tcm325-168456.pdf Archived 28 September 2013 at the Wayback Machine
  5. In government's annual release, there were 3637 people per one hundred thousands people in 2018 died of contacting poison, accidental fall, exposure to fire or smoke, accidental drowning, or sinking beneath water that were excluded from the statistical suicidal death figure equal to 3865 people per 100,000 people.

Related Research Articles

<span class="mw-page-title-main">Mortality rate</span> Deaths per 1000 individuals per year

Mortality rate, or death rate, is a measure of the number of deaths in a particular population, scaled to the size of that population, per unit of time. Mortality rate is typically expressed in units of deaths per 1,000 individuals per year; thus, a mortality rate of 9.5 in a population of 1,000 would mean 9.5 deaths per year in that entire population, or 0.95% out of the total. It is distinct from "morbidity", which is either the prevalence or incidence of a disease, and also from the incidence rate.

<span class="mw-page-title-main">Maternal death</span> Aspect of human reproduction and medicine

Maternal death or maternal mortality is defined in slightly different ways by several different health organizations. The World Health Organization (WHO) defines maternal death as the death of a pregnant mother due to complications related to pregnancy, underlying conditions worsened by the pregnancy or management of these conditions. This can occur either while she is pregnant or within six weeks of resolution of the pregnancy. The CDC definition of pregnancy-related deaths extends the period of consideration to include one year from the resolution of the pregnancy. Pregnancy associated death, as defined by the American College of Obstetricians and Gynecologists (ACOG), are all deaths occurring within one year of a pregnancy resolution. Identification of pregnancy associated deaths is important for deciding whether or not the pregnancy was a direct or indirect contributing cause of the death.

Health in Cuba refers to the overall health of the population of Cuba. Like the rest of the Cuban economy, Cuban medical care suffered following the end of Soviet subsidies in 1991; the stepping up of the US embargo against Cuba at this time also had an effect.

Australia is a high income country, and this is reflected in the good status of health of the population overall. In 2011, Australia ranked 2nd on the United Nations Development Programme's Human Development Index, indicating the level of development of a country. Despite the overall good status of health, the disparities occurring in the Australian healthcare system are a problem. The poor and those living in remote areas as well as indigenous people are, in general, less healthy than others in the population, and programs have been implemented to decrease this gap. These include increased outreach to the indigenous communities and government subsidies to provide services for people in remote or rural areas.

<span class="mw-page-title-main">Health in South Korea</span> Overview of health in South Korea

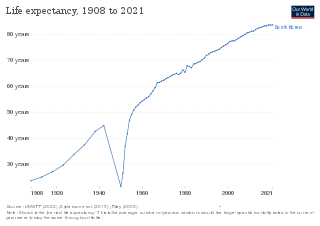
Life expectancy has been rising rapidly and South Korea ranked 3rd in the world for life expectancy. South Korea has among the lowest HIV/AIDS adult prevalence rate in the world, with just 0.1% of the population being infected, significantly lower than the U.S. at 0.6%, France's 0.4%, and the UK's 0.3% prevalence rate. South Korea has a good influenza vaccination rate, with a total of 43.5% of the population being vaccinated in 2019. A new measure of expected human capital calculated for 195 countries from 1920 to 2016 and defined for each birth cohort as the expected years lived from age 20 to 64 years and adjusted for educational attainment, learning or education quality, and functional health status was published by the Lancet in September 2018. South Korea had the sixth highest level of expected human capital with 26 health, education, and learning-adjusted expected years lived between age 20 and 64 years.

<span class="mw-page-title-main">Health in Tajikistan</span> Overview of health in Tajikistan

The Tajikistan health system is influenced by the former Soviet legacy. It is ranked as the poorest country within the WHO European region, including the lowest total health expenditure per capita. Tajikistan is ranked 129th as Human Development Index of 188 countries, with an Index of 0.627 in 2016. In 2016, the SDG Index value was 56. In Tajikistan health indicators such as infant and maternal mortality rates are among the highest of the former Soviet republics. In the post-Soviet era, life expectancy has decreased because of poor nutrition, polluted water supplies, and increased incidence of cholera, malaria, tuberculosis, and typhoid. Because the health care system has deteriorated badly and receives insufficient funding and because sanitation and water supply systems are in declining condition, Tajikistan has a high risk of epidemic disease.

<span class="mw-page-title-main">Health in Finland</span> Overview of health in Finland

The major causes of deaths in Finland are cardiovascular diseases, malignant tumors, dementia and Alzheimer's disease, respiratory diseases, alcohol related diseases and accidental poisoning by alcohol. In 2010, the leading causes of death among men aged 15 to 64 were alcohol related deaths, ischaemic heart disease, accident, suicides, lung cancer and cerebrovascular diseases. Among women the leading causes were breast cancer, alcohol related deaths, accidents, suicides, ischaemic heart disease and lung cancer.

The current population of Myanmar is 54.05 million. It was 27.27 million in 1970. The general state of healthcare in Myanmar is poor. The military government of 1962-2011 spent anywhere from 0.5% to 3% of the country's GDP on healthcare. Healthcare in Myanmar is consistently ranked among the lowest in the world. In 2015, in congruence with a new democratic government, a series of healthcare reforms were enacted. In 2017, the reformed government spent 5.2% of GDP on healthcare expenditures. Health indicators have begun to improve as spending continues to increase. Patients continue to pay the majority of healthcare costs out of pocket. Although, out of pocket costs were reduced from 85% to 62% from 2014 to 2015. They continue to drop annually. The global average of healthcare costs paid out of pocket is 32%. Both public and private hospitals are understaffed due to a national shortage of doctors and nurses. Public hospitals lack many of the basic facilities and equipment. WHO consistently ranks Myanmar among the worst nations in healthcare.

<span class="mw-page-title-main">Health in Ukraine</span>

In Ukraine, the Human Rights Measurement Initiative finds that country is fulfilling 79.4% of what they should be fulfilling for the right to health, based on their level on income.

According to the World Bank income level classification, Portugal is considered to be a high income country. Its population was of 10,283,822 people, by 1 July 2019. WHO estimates that 21.7% of the population is 65 or more years of age (2018), a proportion that is higher than the estimates for the WHO European Region.

<span class="mw-page-title-main">Gender differences in suicide</span>

Gender differences in suicide rates have been shown to be significant. There are different rates of suicides and suicidal behavior between males and females. While females more often have suicidal thoughts, males die by suicide more frequently. This discrepancy is also known as the gender paradox in suicide.

World Suicide Prevention Day (WSPD) is an awareness day always observed on 10 September every year, in order to provide worldwide commitment and action to prevent suicides, with various activities around the world since 2003. The International Association for Suicide Prevention (IASP) collaborates with the World Health Organization (WHO) and the World Federation for Mental Health (WFMH) to host World Suicide Prevention Day. In 2011 an estimated 40 countries held awareness events to mark the occasion. According to WHO's Mental Health Atlas released in 2014, no low-income country reported having a national suicide prevention strategy, while less than 10% of lower-middle income countries, and almost a third of upper-middle and high-income countries had.

In 2006, life expectancy for males in Cyprus was 79 and for females 82 years. Infant mortality in 2002 was 5 per 1,000 live births, comparing favourably to most developed nations.

<span class="mw-page-title-main">Suicide in the United States</span> Statistics and causes of suicide in the U.S.

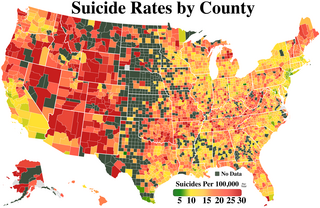
Suicide is a major national public health issue in the United States. The country has one of the highest suicide rates among wealthy nations. In 2020, there were 45,799 recorded suicides, up from 42,773 in 2014, according to the CDC's National Center for Health Statistics (NCHS). On average, adjusted for age, the annual U.S. suicide rate increased 30% between 2000 and 2020, from 10.4 to 13.5 suicides per 100,000 people. In 2018, 14.2 people per 100,000 died by suicide, the highest rate recorded in more than 30 years. Due to the stigma surrounding suicide, it is suspected that suicide is generally underreported. In April 2016, the CDC released data showing that the suicide rate in the United States had hit a 30-year high, and later in June 2018, released further data showing that the rate has continued to increase and has increased in every U.S. state except Nevada since 1999. From 2000 to 2020, more than 800,000 people died by suicide in the United States, with males representing 78.7% of all suicides that happened between 2000 and 2020. In 2022, a record high 49,500 people died by suicide, while the suicide rate in 2022 reached its highest level since 1941 at 14.3 per 100,000 persons. Surging death rates from suicide, drug overdoses and alcoholism, what researchers refer to as "deaths of despair", are largely responsible for a consecutive three year decline of life expectancy in the U.S. This constitutes the first three-year drop in life expectancy in the U.S. since the years 1915–1918.

<span class="mw-page-title-main">Suicide in Canada</span>

According to the latest available data, Statistics Canada estimates 4,157 suicides took place in Canada in 2017, making it the 9th leading cause of death, between Alzheimer's disease (8th) and cirrhosis and other liver diseases (10th). In 2009, there were an estimated 3,890 suicide deaths.

<span class="mw-page-title-main">Health in Lesotho</span>

Lesotho's Human development index value for 2018 was 0.518—which put the country in the low human development category—positioning it at 164 out of 189 countries and territories. Health care services in Lesotho are delivered primarily by the government and the Christian Health Association of Lesotho. Access to health services is difficult for many people, especially in rural areas. The country's health system is challenged by the relentless increase of the burden of disease brought about by AIDS, and a lack of expertise and human resources. Serious emergencies are often referred to neighbouring South Africa. The largest contribution to mortality in Lesotho are communicable diseases, maternal, perinatal and nutritional conditions.

<span class="mw-page-title-main">Health in Lithuania</span> Overview of health in Lithuania

As of 2019 Lithuanian life expectancy at birth was 76.0 and the infant mortality rate was 2.99 per 1,000 births. This is below the EU and OECD average.

Suicide in Lithuania has become a significant social issue in the country due to its high rate. Since its peak in 1995, the suicide rate in Lithuania has been constantly decreasing, but as of 2021 it still remains the highest in the EU and the second highest in the OECD.
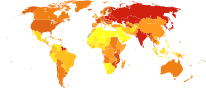
References

  1. "About the Global Burden of Disease (GBD) project". World Health Organization. Archived from the original on 10 November 2013.
  2. "GBD History". Institute for Health Metrics and Evaluation. 18 April 2013.
  3. "Suicides". Our World in Data.
  4. "With one suicide every 40 seconds, WHO urges action". 10 September 2019. Archived from the original on 30 June 2020.
  5. Värnik, P (March 2012). "Suicide in the world". International Journal of Environmental Research and Public Health . 9 (3): 760–71. doi: 10.3390/ijerph9030760 . PMC   3367275 . PMID   22690161.
  6. 1 2 WHO (2002). "Self-directed violence" (PDF). www.who.int. Archived from the original (PDF) on 21 January 2022.
  7. Colby Itkowitz (31 August 2016). "Men die by suicide at alarming rates. This hashtag tells men 'it's okay to talk' about their emotions". Washington Post .
  8. Cutcliffe, John R.; José Santos; Paul S. Links; Juveria Zaheer, eds. (2016). Routledge International Handbook of Clinical Suicide Research. Routledge. ISBN   9781134459292.
  9. O'Brien, Jodi, ed. (2009). Encyclopedia of Gender and Society. SAGE Publications. p. 817. ISBN   9781452266022.
  10. Dan Bilsker; Jennifer White (2011). "The silent epidemic of male suicide". www.bcmj.org. BCMJ.
  11. Global rates of suicide death have fallen by a third since 1990, study finds
  12. Global, regional, and national burden of suicide mortality 1990 to 2016: systematic analysis for the Global Burden of Disease Study 2016
  13. Schumacher, Helene. "Why more men than women die by suicide". www.bbc.com. Retrieved 21 December 2021.
  14. "Suicide". www.who.int. Retrieved 21 December 2021.
  15. "Suicide rate estimates, age-standardized Estimates by WHO region". WHO. Retrieved 12 May 2021.
  16. World Health Organization (2014). "Preventing suicide - A global imperative" (PDF). www.who.int.
  17. "Suicide Statistics — AFSP". American Foundation for Suicide Prevention. Archived from the original on 2 September 2016. Retrieved 7 May 2018.
  18. "Suicide rates, crude - Data by country". World Health Organization. 2016. Retrieved 20 October 2018.
  19. Government of Canada, Statistics Canada (28 June 2019). "Suicide among First Nations people, Métis and Inuit (2011-2016): Findings from the 2011 Canadian Census Health and Environment Cohort (CanCHEC)". www150.statcan.gc.ca. Retrieved 7 December 2023.
  20. Canada, Government of Canada; Indigenous Services (11 December 2019). "Suicide prevention in Indigenous communities". www.sac-isc.gc.ca. Retrieved 7 December 2023.{{cite web}}: CS1 maint: multiple names: authors list (link)
  21. Värnik, P. (2012). "Suicide in the World". International Journal of Environmental Research and Public Health. 9 (12): 760–71. doi: 10.3390/ijerph9030760 . PMC   3367275 . PMID   22690161.
  22. Unless otherwise stated all statistics are from WHO: "Suicide rates per 100,000 by country, year and sex (Table)". World Health Organization. 2011. Archived from the original on 22 January 2012. Retrieved 26 January 2012.
  23. Ritchie, Hannah; Roser, Max; Ortiz-Ospina, Esteban (15 June 2015). "Suicide". Our World in Data.
  24. 1 2 3 4 5 6 7 8 9 10 11 12 13 14 15 16 17 18 "Tables, Graphs and Maps Interface (TGM) table". Eurostat. Retrieved 19 July 2019.
  25. "Savižudybių statistika;". 15min. Retrieved 18 August 2020.
  26. "Mirties priežastys;" (PDF). Hygiene Institute. Retrieved 20 March 2024.
  27. "Causes of Death Statistics in 2021" (in Korean). Statistics Korea. 2022. Retrieved 27 September 2022.
  28. "Trying To Stop Suicide: Guyana Aims To Bring Down Its High Rate". NPR.org. 29 June 2018. Retrieved 19 July 2019.
  29. 1 2 "GBD Results Tool".
  30. "Suicide Rate By Country 2019". 2019 World Population by Country. 22 June 2019. Retrieved 19 July 2019.
  31. Wijesiri, Lionel (8 September 2018). "Rising suicide rate: too many questions, not enough answers". Daily News. Retrieved 19 July 2019.
  32. "National Statistical Committee of the Republic of Belarus (for 2017);" (PDF) (in Russian). Belstat. Archived from the original (PDF) on 14 May 2018. Retrieved 14 May 2018.
  33. 1 2 3 4 "自殺死亡及自殺通報統計". 衛生福利部 (in Chinese). 5 December 2023. Retrieved 1 May 2017.
  34. 1 2 Lung, F.-W.; Liao, S.-C.; Wu, C.-Y.; Lee, M.-B. (2017). "The effectiveness of suicide prevention programmes: urban and gender disparity in age-specific suicide rates in a Taiwanese population". Public Health. 147. Elsevier BV: 136–143. doi:10.1016/j.puhe.2017.01.030. ISSN   0033-3506. PMID   28404489.
  35. Хаустова О. О. World_Bank
  36. "Tasa de suicidios en Uruguay alcanza nuevo récord en 2022, un caso atípico en América" (in Spanish).
  37. "En Uruguay los suicidios son la principal causa de muerte entre los 15 y 44 años" (in Spanish).
  38. WB
  39. "Eurostat - Tables, Graphs and Maps Interface (TGM) table" . Retrieved 25 May 2016.
  40. 1 2 3 4 5 6 7 8 "Death Due To Suicide". Eurostat. European Commission. 2009. Retrieved 10 January 2010.
  41. 厚生労働省>白書・統計>各種統計調査>厚生労働統計一覧>1.人口・世帯>人口動態統計特殊報告>自殺死亡統計>12. 統計表>第1表 総死亡数・死亡率(人口10万対)・自殺死亡数・死亡率(人口10万対)の年次推移
  42. "厚生労働省>分野別の政策一覧>福祉・介護>生活保護・福祉一般>自殺対策>自殺統計>各年の状況>平成30年中における自殺の状況>第3章 平成30年中における自殺の内訳>33p 補表1-1 年次別自殺者数、34p 補表2-1 年齢階級別自殺者数の推移、35p 補表2-2 年齢階級別自殺死亡率" (PDF). mhlw.go.jp. Retrieved 11 October 2019.
  43. "Odsjek za mentalne poremećaje s registrom za psihoze i registrom izvršenih samoubojstava" (in Croatian). HZJZ. Archived from the original on 28 March 2016.
  44. "World Suicide Death Rate Rankings (WHO)". 16 December 2018.
  45. Burrows, Stephanie; Laflamme, Lucie (February 2006). "Suicide Mortality in South Africa". Social Psychiatry and Psychiatric Epidemiology. 41 (2): 108–114. doi:10.1007/s00127-005-0004-4. PMID   16362168. S2CID   123246.. This data is for urban areas only. The data available for the whole of South Africa in 2007 are: men 1.4, women 0.4, total 0.9 (source: WHO)
  46. 1 2 "EU statistics: Death due to suicide, by gender". Statistics Estonia. 2012. Archived from the original on 14 November 2012. Retrieved 26 April 2013.
  47. "Number of suicides 1921-2014, Statistics Finland". 30 December 2015.
  48. Värnik, P (2 March 2012). "Suicide in the World- Table 2 - Suicide by gender and age groups in WHO regions, estimates for 2008". Int J Environ Res Public Health. 9 (3): 760–71. doi: 10.3390/ijerph9030760 . PMC   3367275 . PMID   22690161.
  49. "Suicide and Self-Inflicted Injury-FastStats". Centers for Disease Control and Prevention. 27 June 2019. Retrieved 16 July 2019.
  50. Howard, Jacqueline (20 June 2019). "The US suicide rate is up 33% since 1999". CNN. Retrieved 16 July 2019.
  51. "Suicide Statistics". AFSP. 16 February 2016. Archived from the original on 2 September 2016. Retrieved 16 July 2019.
  52. Lasota, Dorota; Pawłowski, Witold; Krajewski, Paweł; Staniszewska, Anna; Goniewicz, Krzysztof; Goniewicz, Mariusz (2019). "Seasonality of Suicides among Victims Who Are under the Influence of Alcohol". International Journal of Environmental Research and Public Health. 16 (15). MDPI: 2806. doi: 10.3390/ijerph16152806 . PMC   6696555 . PMID   31390817.
  53. "INFORMATION ABOUT THE MORTALITY OF THE POPULATION FOR THE CAUSES OF DEATH FOR THE RUSSIAN FEDERATION - January - December 2017" (in Russian). Rosstat. Retrieved 29 January 2018.
  54. SRNA (16 April 2012). "BiH: Prošle godine ubilo se 507 lica, od čega 16 maloletnika". SRNA. Archived from the original on 27 September 2013. Retrieved 4 December 2012.
  55. "Health - Causes of Death in Germany" (PDF) (in German). 2013.
  56. "NZ suicide rates rise for first time in four years". New Zealand Herald. 6 October 2015. ISSN   1170-0777 . Retrieved 6 October 2015.
  57. "Chief Coroner releases provisional annual suicide figures for the 2014/15 year". Coronial Services of New Zealand. 6 October 2015. Archived from the original on 15 February 2016. Retrieved 12 February 2016.
  58. "Centre for Suicide Research and Prevention". Hong Kong. 2013.
  59. "Dödsorsaker 2012" [Causes of Death 2012](PDF). www.socialstyrelsen.se - 6 August 2013.pdf (in Swedish and English). Statistics Sweden. 2013. Archived from the original (PDF) on 19 October 2014. Retrieved 13 September 2014.
  60. Sociedade Portuguesa de Suicidologia. "Estatística - Sociedade Portuguesa de Suicidologia". Archived from the original on 5 December 2014. Retrieved 25 May 2016.
  61. "Suicides in the UK - Office for National Statistics".
  62. "Suicides and suicide rate, by sex and by age group, Canada". 26 November 2020.
  63. "36 died from own hand". Hagstofa Íslands/Statistical Bureau of Iceland. Morgunblaðið. 2010. Retrieved 21 September 2010.
  64. statistique, Office fédéral de la. "Développement durable". www.bfs.admin.ch. Archived from the original on 4 March 2016. Retrieved 15 October 2014.
  65. Central Statistics Office. "Vital Statistics - Fourth Quarter and Yearly Summary - 2013" (PDF).
  66. Samaritians of Singapore. "Suicide Statistics in Singapore" (PDF). Archived from the original (PDF) on 29 October 2013.
  67. Australian Bureau of Statistics Causes of Death, Australia, 2021
  68. "Back from the edge - The first of two articles on China's suicide rate looks at the effect of urbanisation". The Economist. 28 June 2014.
  69. "Hecho en socialismo: En 2019 tasa de suicidios rompió récord en Venezuela". 2 January 2020.
  70. "Suicides and suicide rate, by sex and by age group, Spain". 27 June 2015.
  71. "Suicide Rates: Thailand". Archived from the original on 6 March 2016.
  72. "Suicide in Israel - 1981-2009 Suicides, Suicide Attempts 2004-2010" (PDF) (in Hebrew). Retrieved 9 September 2013.
  73. "TÜİK - Statistics Data Portal". www.tuik.gov.tr.
  74. "WHO | Suicide rates per 100,000 by country, year and sex (Table)". Who.int. 7 December 2009. Archived from the original on 27 September 2010. Retrieved 30 September 2010.
  75. "Mortalidad y otros (Mortality and others)" (PDF). IUDPAS. 1 March 2011. Archived from the original (PDF) on 28 September 2013. Retrieved 22 January 2013.
  76. "Iranian Legal Medicine Organization". 2013. Archived from the original on 12 January 2014. Retrieved 12 January 2014.www.lmo.ir
  77. "Tehran has the highest rate of suicide in Iran" (in Persian). Bahar Newspaper. 2013. Archived from the original on 20 September 2013. via Google Translate
  78. Chief, Barbara Mae Dacanay, Bureau (17 July 2012). "Suicide rate has steadily risen in Philippines for 21 years — report".{{cite web}}: CS1 maint: multiple names: authors list (link)
  79. Based on a population of 180.4 million in 2012 (Population Reference Bureau), a sex ratio of 1.06 males/female (CIA World Factbook, 2013) and figures from 'State of Human Rights in 2012 Archived 19 March 2015 at the Wayback Machine ' by the Human Rights Commission of Pakistan: 1,976 persons committed suicide in 2012 across the country of which 626 were women.
  80. "Suicide rates (per 100,000), by gender, Jordan, 1965-2008" (PDF). World Health Organization.
  81. "Kaohsiung City Government". Archived from the original on 25 July 2019. Retrieved 25 July 2019.
  82. "Kaohsiung city government II". Archived from the original on 25 July 2019. Retrieved 25 July 2019.