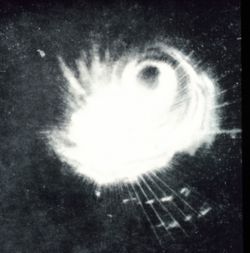
1944 Pacific typhoon season

Last updated
1944 Pacific typhoon season
1944 Pacific typhoon season summary.png
Season summary map
Seasonal boundaries
First system formedJanuary 7, 1944
Last system dissipatedDecember 19, 1944
Strongest storm
Name Cobra
  Maximum winds260 km/h (160 mph)
(1-minute sustained)
  Lowest pressure924 hPa (mbar)
Seasonal statistics
Total storms23
Total fatalities>790
Total damageUnknown
Related articles
Pacific typhoon seasons
1942, 1943, 1944, 1945, 1946

The 1944 Pacific typhoon season has no official bounds; it ran year-round in 1944, but most tropical cyclones tend to form in the northwestern Pacific Ocean between June and December. These dates conventionally delimit the period of each year when most tropical cyclones form in the northwestern Pacific Ocean. The scope of this article is limited to the Pacific Ocean, north of the equator and west of the international date line. Storms that form east of the date line and north of the equator are called hurricanes; see 1944 Pacific hurricane season.

Contents

There were 23 tropical cyclones in 1944 in the western Pacific, including Typhoon Cobra. [1]

Systems

Tropical Storm One

1944 SWM WP One.png   1944 Pacific tropical storm 1 track.png
DurationJanuary 7 – January 17
Peak intensityWinds not specified;
≤1005  hPa  (mbar)

A long lived slow-moving and erratic tropical storm. The storm formed southwest of Micronesia, turned to the north and the west of Palau and made landfall in Mindanao. [2]

Tropical Storm Two

1944 SWM WP Two.png   1944 Pacific tropical storm 2 track.png
DurationFebruary 17 – February 19
Peak intensityWinds not specified;
≤1000  hPa  (mbar)

Short-lived storm moving quickly to the northeast. [3] There are many indications that this system was not tropical, such as attached fronts throughout its entire noted life. [4]

Tropical Storm Three

1944 SWM WP Three.png   1944 Pacific tropical storm 3 track.png
DurationMay 12 – May 16
Peak intensityWinds not specified;
≤1010  hPa  (mbar)

The storm formed near Guam. The storm moved in a northern direction in the Pacific Ocean before dissipating on May 16. [5]

Typhoon Four

1944 SWM WP Four.png   1944 Pacific typhoon 4 track.png
DurationJune 11 – June 15
Peak intensityWinds not specified;
≤1000  hPa  (mbar)

This typhoon formed in the northwest of Micronesia, tracked to the northwest direction and recurved to the northeast of Philippines before dissipating. [6]

Typhoon Six

21,July,1944 Typhoon weather map.png   1944 Pacific typhoon 6 track.png
DurationJuly 15 – July 21
Peak intensityWinds not specified;
≤1000  hPa  (mbar)

}

Typhoon Cobra

Typhoon Cobra, 18 December 1944 east of Luzon.jpg   Cobra 1944 track.png
DurationDecember 14 – December 19
Peak intensityWinds not specified;
924  hPa  (mbar)

Typhoon Cobra was first spotted on December 17, in the Philippine Sea. It sank three US destroyers, killing at least 790 sailors, before dissipating the next day.

See also

Related Research Articles

<span class="mw-page-title-main">1959 Pacific typhoon season</span> Typhoon season in the Pacific Ocean

The 1959 Pacific typhoon season was regarded as one of the most devastating years for Pacific typhoons on record, with China, Japan and South Korea sustaining catastrophic losses. It was an event in the annual cycle of tropical cyclone formation. The season had no official bounds, but tropical cyclones in the Western Pacific Ocean normally develop between May and October.

<span class="mw-page-title-main">1945 Pacific typhoon season</span>

The 1945 Pacific typhoon season was the first official season to be included in the West Pacific typhoon database. It was also the first season to name storms. It has no official bounds; it ran year-round in 1945, but most tropical cyclones tend to form in the northwestern Pacific Ocean between June and December. These dates conventionally delimit the period of each year when most tropical cyclones form in the northwestern Pacific Ocean.

<span class="mw-page-title-main">1991–92 South-West Indian Ocean cyclone season</span> Cyclone season in the Southwest Indian Ocean

The 1991–92 South-West Indian Ocean cyclone season was an average cyclone season in which most storms remained over open waters. At the time, the season's official bounds lasted from November 15, 1991, to April 30, 1992, although this season began early when three tropical depressions formed before the official start. The second, designated Tropical Depression A2 by the Météo-France office (MFR) on Réunion, passed north of Madagascar on October 16 before weakening.

<span class="mw-page-title-main">1992–93 South-West Indian Ocean cyclone season</span> Cyclone season in the Southwest Indian Ocean

The 1992–93 South-West Indian Ocean cyclone season lasted longer than normal, with the first storm Aviona forming on September 27 and the final storm Konita not dissipating until May 7. It was an above-average season, with four tropical cyclones – the equivalent of a minimal hurricane – along with six tropical storms, one subtropical depression, and several depressions including one that was named. The basin is defined as the area west of 90°E and south of the Equator in the Indian Ocean, which includes the waters around Madagascar westward to the east coast of Africa. Tropical cyclones in this basin are monitored by the Regional Specialised Meteorological Centre in Réunion (MFR), as well as by the Joint Typhoon Warning Center (JTWC).

<span class="mw-page-title-main">1961–62 South-West Indian Ocean cyclone season</span> Cyclone season in the Southwest Indian Ocean

The 1961–62 South-West Indian Ocean cyclone season was a busy cyclone season, lasting from December to April.

<span class="mw-page-title-main">1962–63 South-West Indian Ocean cyclone season</span> Cyclone season in the Southwest Indian Ocean

The 1962–63 South-West Indian Ocean cyclone season was an average cyclone season, although it began early with the first October storm since 1911. Two storms formed in December, both of them passing near the Mascarene Islands.

The 1940 Pacific typhoon season marked an interruption in meteorological records in both the Philippines and Hong Kong due to the start of World War II. There were 43 reported tropical cyclones, including 27 that attained typhoon status. The first storm was observed in February, and the first typhoon formed two months later, killing three people along Mindanao. Several storms formed in June and July, including reports of a typhoon in the newspapers that killed 52 in South Korea, and another typhoon reported in newspapers that killed one person on Samar after dropping heavy rainfall. The strongest typhoon of the season originated in July and attained a minimum pressure of 927 mbar (27.4 inHg), as reported by a ship northeast of the Philippines.

<span class="mw-page-title-main">1900 Pacific typhoon season</span> Typhoon season in the Pacific Ocean

In 1900, 23 tropical cyclones were observed in the western Pacific Ocean, north of the equator and west of the International Date Line. In that region of the world, cyclones that attain maximum sustained winds of at least 118 km/h (73 mph) are known as typhoons. Of the 23 storms, 13 were tracked by the Hong Kong Observatory. Activity occurred from January to December, although the majority of the storms formed from June to November.

In 1927, there were 27 tropical cyclones observed in the western Pacific Ocean, north of the equator and west of the 180th meridian. Many of these storms affected the Philippines, China, and Japan, collectively leaving 15,952 fatalities. The strongest storm of the year also had the lowest barometric pressure recorded in a tropical cyclone worldwide at the time. On August 18, the Dutch steamship Sapoeroea recorded a barometric pressure of 886.7 millibar about 740 kilometres (460 miles) east of Luzon. This typhoon later struck near Hong Kong, where it halted transportation, wrecked buildings, and killed 15 people.

The 1941 Pacific typhoon season has no official bounds; it ran year-round in 1941, but most tropical cyclones tend to form in the northwestern Pacific Ocean between June and December. These dates conventionally delimit the period of each year when most tropical cyclones form in the northwestern Pacific Ocean. The scope of this article is limited to the Pacific Ocean, north of the equator and west of the international date line. Storms that form east of the date line and north of the equator are called hurricanes; see 1941 Pacific hurricane season. There were 28 tropical cyclones in the western Pacific in 1941.

The 1942 Pacific typhoon season has no official bounds; it ran year-round in 1942, but most tropical cyclones tend to form in the northwestern Pacific Ocean between June and December. These dates conventionally delimit the period of each year when most tropical cyclones form in the northwestern Pacific Ocean. The scope of this article is limited to the Pacific Ocean, north of the equator and west of the international date line. Storms that form east of the date line and north of the equator are called hurricanes; see 1942 Pacific hurricane season.

The 1943 Pacific typhoon season has no official bounds; it ran year-round in 1943, but most tropical cyclones tend to form in the northwestern Pacific Ocean between June and December. These dates conventionally delimit the period of each year when most tropical cyclones form in the northwestern Pacific Ocean. The scope of this article is limited to the Pacific Ocean, north of the equator and west of the international date line. Storms that form east of the date line and north of the equator are called hurricanes; see 1943 Pacific hurricane season.

There were 30 tropical cyclones in the western Pacific Ocean in 1931, including 19 typhoons, as well as one that developed in December of the previous year. The most significant typhoon was one that struck eastern China near Shanghai in the midst of the country's worst floods on record; heavy rainfall caused levees to collapse along the Grand Canal, killing an estimated 300,000 people, including about 2,000 people overnight in the city of Gaoyou.

The following is a list of Pacific typhoon seasons from 1920 to 1937. Data from these years was extremely unreliable, so there were many more typhoons that did not hit land and were not detected by ships. The average from these times was 23 tropical storms, which now would be considered a well-below-average season.

The 1938 Pacific typhoon season featured 31 storms. Data from this period was extremely sparse, so intensity is not available for these systems. The only agency that tracked these typhoons is the International Best Track Archive for Climate Stewardship (IBRrACS), which has compiled a database of all known tropical cyclones since 1851.

The following is a list of North Indian Ocean tropical cyclones from 1930 to 1939. Records from before the 1970s were extremely unreliable, and storms that stayed at sea were often only reported by ship reports.

The following is a list of North Indian Ocean tropical cyclones from 1920 to 1929. Records from before the 1970s were extremely unreliable, and storms that stayed at sea were often only reported by ship reports.

This article encompasses the 1890s Pacific typhoon seasons.

<span class="mw-page-title-main">Weather of 2002</span>

The following is a list of weather events that occurred on Earth in the year 2002. There were several natural disasters around the world from various types of weather, including blizzards, cold waves, droughts, heat waves, tornadoes, and tropical cyclones. The deadliest disaster was a heat wave in India in May, which killed more than 1,030 people. The costliest event of the year was a flood in Europe in August, which killed 232 people and caused €27.7 billion (US$27.115 billion) in damage. In September, Typhoon Rusa struck South Korea, killing at least 213 people and causing at least ₩5.148 trillion (US$4.2 billion) in damage.

References

  1. "IBTrACS - International Best Track Archive for Climate Stewardship". www.atms.unca.edu.
  2. "IBTrACS - International Best Track Archive for Climate Stewardship". ibtracs.unca.edu.
  3. "IBTrACS - International Best Track Archive for Climate Stewardship". ibtracs.unca.edu.
  4. "NOAA Daily Northern Hemisphere Sypnotic Weather Maps" (PDF).
  5. "IBTrACS - International Best Track Archive for Climate Stewardship". ibtracs.unca.edu.
  6. "IBTrACS - International Best Track Archive for Climate Stewardship". ibtracs.unca.edu.