| |||||||||||||||||||||||||||||||
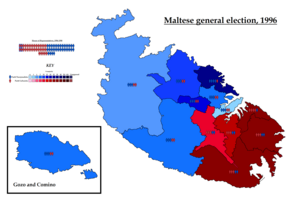
All 69 seats in the House of Representatives 35 seats needed for a majority | |||||||||||||||||||||||||||||||
|---|---|---|---|---|---|---|---|---|---|---|---|---|---|---|---|---|---|---|---|---|---|---|---|---|---|---|---|---|---|---|---|
| |||||||||||||||||||||||||||||||
 | |||||||||||||||||||||||||||||||


 |
|---|
General elections were held in Malta on 26 October 1996. [1] Although the Malta Labour Party received the most votes, the Nationalist Party won the most seats. However, the Labour Party was awarded an additional four seats to ensure they had a majority in Parliament. [2]
