Amelia McNamara

Last updated
Amelia McNamara
Born
Alma mater
Scientific career
Institutions
Thesis Bridging the Gap Between Tools for Learning and for Doing Statistics  (2015)
Website amelia.mn

Amelia Ahlers McNamara is an Assistant Professor of Computer and Information Sciences at the University of St. Thomas. McNamara is a statistician with an active research program in statistical computing, data visualization, statistics education, reproducibility, and spatial statistics. McNamara is known for her contributions to statistical computing surrounding the programming language R. [1] She was a major contributor to UCLA's Mobilize curriculum, which brought data science to thousands of students in the Los Angeles area. The program was piloted in 10 schools and introduced teachers and students to the programming language R and participatory sensing. [2] [3] [4]

University of St. Thomas (Minnesota) private Catholic university located in St. Paul and Minneapolis, Minnesota

The University of St. Thomas is a private, Roman Catholic, liberal arts, and archdiocesan university located in St. Paul and Minneapolis, Minnesota. Founded in 1885 as a Catholic seminary, it is named after Thomas Aquinas, the medieval Catholic theologian and philosopher who is the patron saint of students. St. Thomas currently enrolls nearly 10,000 students, making it Minnesota's largest private, non-profit university. Julie Sullivan became its 15th president in 2013.

A statistician is a person who works with theoretical or applied statistics. The profession exists in both the private and public sectors. It is common to combine statistical knowledge with expertise in other subjects, and statisticians may work as employees or as statistical consultants.

Data visualization is the graphic representation of data. It involves producing images that communicate relationships among the represented data to viewers of the images. This communication is achieved through the use of a systematic mapping between graphic marks and data values in the creation of the visualization. This mapping establishes how data values will be represented visually, determining how and to what extent a property of a graphic mark, such as size or color, will change to reflect change in the value of a datum.

Contents

Early life and education

McNamara grew up in Minneapolis–Saint Paul. During her first year at college she attended design school, before majoring in mathematics and English. She attended Macalester College, and was awarded the Konhauser Award for Mathematical Achievement in 2010. McNamara moved to University of California, Los Angeles for her graduate studies, and worked with Robert Gould and Fredrick Schoenberg on learning for statistics. She compared the tools that had been developed for teaching statistics (including TinkerPlots and Fathom: Dynamic Data Software) and those which are used for doing statistics (including R, SPSS and SAS). [5] As a graduate student, she developed a course on data visualisation, which included the work of Nathan Yau, William S. Cleveland, and Leland Wilkinson. [6]

Minneapolis–Saint Paul is a major metropolitan area built around the Mississippi, Minnesota and St. Croix rivers in east central Minnesota. The area is commonly known as the Twin Cities after its two largest cities, Minneapolis, the most populous city in the state, and Saint Paul, the state capital. It is an example of twin cities in the sense of geographical proximity. Minnesotans living outside of Minneapolis and Saint Paul often refer to the two together as "The Cities."

Macalester College United States national historic site

Macalester College is a private liberal arts college in Saint Paul, Minnesota. Founded in 1874, Macalester is exclusively an undergraduate four-year institution and enrolled 2,174 students in the fall of 2018 from 50 U.S. states, 4 U.S territories, the District of Columbia and 97 countries. It is currently a Forbes Top 100 College, and a Forbes Top 50 School for International Students. In 2019, U.S. News & World Report ranked Macalester as tied for the 27th best liberal arts college in the United States, tied for 13th best for undergraduate teaching at a national liberal arts college, and 24th for best value at a national liberal arts college.

University of California, Los Angeles Public research university in Los Angeles, California

The University of California, Los Angeles (UCLA), is a public research university in Los Angeles. It became the Southern Branch of the University of California in 1919, making it the fourth-oldest of the 10-campus University of California system. It offers 337 undergraduate and graduate degree programs in a wide range of disciplines. UCLA enrolls about 31,000 undergraduate and 13,000 graduate students and had 119,000 applicants for Fall 2016, including transfer applicants, making the school the most applied-to of any American university.

Research and career

McNamara joined the Program in Statistical and Data Sciences at Smith College (one of the first data science programs in the country) as a Visiting Assistant Professor and MassMutual Faculty Fellow in 2015. [7] [8] She served as a member of Y Combinator's Human Advancement Research Community. [9] In 2018, she joined the University of St. Thomas as an Assistant Professor of Computer and Information Sciences. [10] McNamara created an illustrated, interactive essay with her colleague Aran Lunzer to help people understand histograms which won a Kantar Information is Beautiful award. [11] [12] [13] [14]

Smith College private womens liberal arts college in Massachusetts

Smith College is a private women's liberal arts college in Northampton, Massachusetts. Although its undergraduate programs are open to women only, its graduate and certificate programs are also open to men. It is the largest member of the Seven Sisters. Smith is also a member of the Five Colleges Consortium, which allows its students to attend classes at four other Pioneer Valley institutions: Mount Holyoke College, Amherst College, Hampshire College, and the University of Massachusetts Amherst. In its 2018 edition, U.S. News & World Report ranked it tied for 11th best among National Liberal Arts Colleges.

Y Combinator American seed accelerator founded in March 2005

Y Combinator is an American seed accelerator launched in March 2005 and was used to launch over 2,000 companies including Dropbox, Airbnb, Stripe, Reddit, Optimizely, Zenefits, Docker, DoorDash, Mixpanel, Heroku.

Histogram graphical representation of the distribution of numerical data

A histogram is an accurate representation of the distribution of numerical data. It is an estimate of the probability distribution of a continuous variable and was first introduced by Karl Pearson. It differs from a bar graph, in the sense that a bar graph relates two variables, but a histogram relates only one. To construct a histogram, the first step is to "bin" the range of values—that is, divide the entire range of values into a series of intervals—and then count how many values fall into each interval. The bins are usually specified as consecutive, non-overlapping intervals of a variable. The bins (intervals) must be adjacent, and are often of equal size.

McNamara contributed to the creation of skimr; an R package to create compact and flexible data summaries. [15] Her paper, Wrangling Categorical Data with R [16] , provided the inspiration for Hadley Wickham to write the forcats package. [17]

Hadley Wickham data scientist, developer of R software

Hadley Wickham is a statistician from New Zealand who is currently Chief Scientist at RStudio and an adjunct Professor of statistics at the University of Auckland, Stanford University, and Rice University. He is best known for his development of open-source statistical analysis software packages for R that implement logics of data visualisation and data transformation. Wickham's packages and writing are known for advocating a tidy data approach to data import, analysis and modelling methods.

McNamara is involved with science communication and increasing public awareness of statistics. [18] She has worked with Nathan Yau on his data visualisation courses as well as leading her own courses in data communication and journalism. [19] [20] [21]

She was an invited speaker at Dagstuhl, a prestigious computer science seminar series. [22] Her work on dealing with categorical data using R has been covered in the O'Reilly Media book R for Data Science. [23] In 2019 McNamara was profiled by the American Statistical Association as one of the Top 20 Women working in statistics and data science. [24]

Dagstuhl

Dagstuhl is a computer science research center in Germany, located in and named after a district of the town of Wadern, Merzig-Wadern, Saarland.

R (programming language) programming language for statistical computing

R is a programming language and free software environment for statistical computing and graphics supported by the R Foundation for Statistical Computing. The R language is widely used among statisticians and data miners for developing statistical software and data analysis. Polls, data mining surveys, and studies of scholarly literature databases show substantial increases in popularity; as of July 2019, R ranks 20th in the TIOBE index, a measure of popularity of programming languages.

O'Reilly Media is a learning company established by Tim O'Reilly that publishes books, produces tech conferences, and provides an online learning platform. Their distinctive brand features a woodcut of an animal on many of their book covers.

Related Research Articles

DBLP is a computer science bibliography website. Starting in 1993 at the University of Trier, Germany, it grew from a small collection of HTML files and became an organization hosting a database and logic programming bibliography site. DBLP listed more than 3.66 million journal articles, conference papers, and other publications on computer science in July 2016, up from about 14,000 in 1995. All important journals on computer science are tracked. Proceedings papers of many conferences are also tracked. It is mirrored at three sites across the Internet.

In statistics, exploratory data analysis (EDA) is an approach to analyzing data sets to summarize their main characteristics, often with visual methods. A statistical model can be used or not, but primarily EDA is for seeing what the data can tell us beyond the formal modeling or hypothesis testing task. Exploratory data analysis was promoted by John Tukey to encourage statisticians to explore the data, and possibly formulate hypotheses that could lead to new data collection and experiments. EDA is different from initial data analysis (IDA), which focuses more narrowly on checking assumptions required for model fitting and hypothesis testing, and handling missing values and making transformations of variables as needed. EDA encompasses IDA.

Stephen Elliott Fienberg was a Professor Emeritus in the Department of Statistics, the Machine Learning Department, Heinz College, and Cylab at Carnegie Mellon University.

The following tables compare general and technical information for a number of statistical analysis packages.

GGobi is a free statistical software tool for interactive data visualization. GGobi allows extensive exploration of the data with Interactive dynamic graphics. It is also a tool for looking at multivariate data. R can be used in sync with GGobi. GGobi prides itself on its ability to link multiple graphs together.

ggplot2 data visualization package for the statistical programming language R

ggplot2 is a data visualization package for the statistical programming language R. Created by Hadley Wickham in 2005, ggplot2 is an implementation of Leland Wilkinson's Grammar of Graphics—a general scheme for data visualization which breaks up graphs into semantic components such as scales and layers. ggplot2 can serve as a replacement for the base graphics in R and contains a number of defaults for web and print display of common scales. Since 2005, ggplot2 has grown in use to become one of the most popular R packages. It is licensed under GNU GPL v2.

RStudio free and open source IDE for R

RStudio is an integrated development environment (IDE) for R, a programming language for statistical computing and graphics. The RStudio IDE is developed by RStudio, Inc., a commercial enterprise founded by JJ Allaire, creator of the programming language ColdFusion. Hadley Wickham is the Chief Scientist at RStudio. RStudio, Inc. has no formal connection to the R Foundation, a not for profit organization located in Vienna Austria, which is responsible for overseeing development of the R environment for statistical computing.

Heike Hofmann is a statistician. She earned an MSc in Mathematics, with a minor in Computer Science, and a PhD in Statistics, from the University of Augsburg, Augsburg, Germany in 1998 and 2000, respectively. She is currently Professor in the Department of Statistics at Iowa State University, and faculty member of the Bioinformatics and Computational Biology and Human Computer Interaction programs.

Dianne Helen Cook is an Australian statistician, the editor of the Journal of Computational and Graphical Statistics, and an expert on the visualization of high-dimensional data. She is professor emeritus of statistics at Iowa State University, and Professor of Business Analytics in the Department of Econometrics and Business Statistics at Monash University.

Francesca Dominici is an Italian statistician who performs collaborative research on projects that combine big data with health policy and climate change. She is a professor of biostatistics, co-director of the Harvard Data Science Initiative, and a former senior associate dean for research in the Harvard T.H. Chan School of Public Health.

Vicki Stover Hertzberg is an American biostatistician and public health researcher who works as a professor of biostatistics and bioinformatics and director of the Center for Nursing Data Science in the Rollins School of Public Health of Emory University.

Jun Zhu is a statistician and entomologist who works as a professor in the Departments of Statistics and Entomology at the University of Wisconsin–Madison. Her research interests involve the analysis of spatial data and spatio-temporal data, and the applications of this analysis in environmental statistics.

Daniela M. Witten is an American biostatistician and Associate Professor at the University of Washington. Her research investigates the use of machine learning to understand high-dimensional data.

Jennifer (Jenny) Bryan is a data scientist and an associate professor of statistics at the University of British Columbia where she developed the Master of Data Science Program. She is a statistician and software engineer at RStudio from Vancouver, Canada and is known for creating open source tools which connect R to Google Sheets and Google Drive.

J. Lynn Palmer is an American biostatistician known for her research on missing data and on treatment of cancer.

Ann C. Russey Cannon is an American statistics educator, the Watson M. Davis Professor of Mathematics and Statistics at Cornell College in Iowa. As of 2016, she was the only statistician at Cornell College.

Fabrizia Mealli is an Italian statistician at the University of Florence, known for her research on causal inference, missing data, and the statistics of employment. In 2013 she was named a Fellow of the American Statistical Association.

Mary Eleanor Spear Statistician

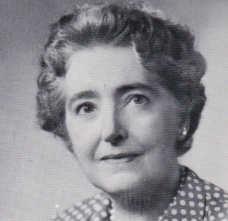
Mary Eleanor Hunt Spear was an American data visualization specialist, graphic analyst and author, who pioneered development of the bar chart and box plot.

References

  1. "Amelia McNamara". resources.rstudio.com. Retrieved 2019-08-18.
  2. "Introduction to Data Science | High school statistics curriculum". www.mobilizingcs.org. Retrieved 2019-08-18.
  3. "Introduction to Data Science Curriculum v_5.0". Introduction to Data Science Curriculum v_5.0. Retrieved 2019-08-23.
  4. June 23, Harmohan Singh-; 2017 (2014-08-20). "Data Science courses in LAUSD High Schools | Mobilize | Data Science Los Angeles". DataScience.LA. Retrieved 2019-08-18.
  5. McNamara, Amelia Ahlers (2015). Bridging the Gap Between Tools for Learning and for Doing Statistics (Thesis). UCLA.
  6. McNamara, Amelia. "Amelia McNamara | Teaching | data visualization". www.amelia.mn. Retrieved 2019-08-18.
  7. Smith, Sophian (2019-03-14). "A look into Statistical and Data Sciences- One of Smith's newest and fastest growing majors". The Sophian. Archived from the original on 2019-03-14. Retrieved 2019-08-23.
  8. Ben-Zvi, D.; Makar, K.; Garfield, J. (2017). International Handbook of Research in Statistics Education. Springer International Handbooks of Education. Springer International Publishing. p. 456. ISBN   978-3-319-66195-7 . Retrieved 2019-08-23.
  9. "Amelia McNamara". HARC. Y Combinator . Retrieved 2019-08-20.
  10. "Faculty & Staff – Computer & Information Sciences – University of St. Thomas – Minnesota". www.stthomas.edu. Retrieved 2019-08-18.
  11. "Amelia McNamara". Amstat News. Retrieved 2019-08-18.
  12. McNamara, Aran Lunzer and Amelia. "Exploring Histograms". tinlizzie.org. Retrieved 2019-08-18.
  13. Yau, Nathan (2017-07-24). "An interactive to explain histograms, for normal people". FlowingData. Retrieved 2019-08-18.
  14. McNamara, Amelia. "Exploring Histograms". Information is Beautiful Awards. Retrieved 2019-08-23.
  15. Waring, Elin; Quinn, Michael; McNamara, Amelia; Rubia, Eduardo Arino de la; Zhu, Hao; Lowndes, Julia; Ellis, Shannon; McLeod, Hope; Wickham, Hadley (2019-06-20), skimr: Compact and Flexible Summaries of Data , retrieved 2019-08-21
  16. McNamara, Amelia; Horton, Nicholas J. (2018), "Wrangling Categorical Data in R", The American Statistician, 72 (1): 97–104, doi:10.1080/00031305.2017.1356375
  17. McNamara, Amelia (2019-01-17), Working with categorical data in R without losing your mind , retrieved 2019-08-21
  18. "Episode 27 - Special Guest Amelia McNamara from Not So Standard Deviations". www.stitcher.com. Retrieved 2019-08-18.
  19. "STAT7350". MicroStats Lab. Retrieved 2019-08-18.
  20. "Data Visualization for Population Research". Centre on Population Dynamics. Retrieved 2019-08-18.
  21. How spatial polygons shape our world - Amelia McNamara , retrieved 2019-08-18
  22. Wadern, Schloss Dagstuhl-Leibniz-Zentrum für Informatik GmbH, 66687. "Schloss Dagstuhl : Seminar Homepage". www.dagstuhl.de. Retrieved 2019-08-21.
  23. Grolemund, Garrett; Wickham, Hadley. 15 Factors | R for Data Science.
  24. "Celebrating Women in Statistics". Amstat News. Retrieved 2019-08-21.