Biological applications of bifurcation theory provide a framework for understanding the behavior of biological networks modeled as dynamical systems. In the context of a biological system, bifurcation theory describes how small changes in an input parameter can cause a bifurcation or qualitative change in the behavior of the system. The ability to make dramatic change in system output is often essential to organism function, and bifurcations are therefore ubiquitous in biological networks such as the switches of the cell cycle.
Biological networks originate from evolution and therefore have less standardized components and potentially more complex interactions than networks designed by humans, such as electrical networks. At the cellular level, components of a network can include a large variety of proteins, many of which differ between organisms. Network interactions occur when one or more proteins affect the function of another through transcription, translation, translocation, phosphorylation, or other mechanisms. These interactions either activate or inhibit the action of the target protein in some way. While humans build networks with a concern for simplicity and order, biological networks acquire redundancy and complexity over the course of evolution. Therefore, it can be impossible to predict the quantitative behavior of a biological network from knowledge of its organization. Similarly, it is impossible to describe its organization purely from its behavior, though behavior can indicate the presence of certain network motifs.
Figure 1. Example of a biological network between genes and proteins that controls entry into S phase.
However, with knowledge of network interactions and a set of parameters for the proteins and protein interactions (usually obtained through empirical research), it is often possible to construct a model of the network as a dynamical system. In general, for proteins, the dynamical system takes the following form[1] where is typically protein concentration:
These systems are often very difficult to solve, so modeling of networks as a linear dynamical systems is easier. Linear systems contain no products between 's and are always solvable. They have the following form for all :
Unfortunately, biological systems are often nonlinear and therefore need nonlinear models.
Input/output motifs
Despite the great potential complexity and diversity of biological networks, all first-order network behavior generalizes to one of four possible input-output motifs: hyperbolic or Michaelis–Menten, ultra-sensitive, bistable, and bistable irreversible (a bistability where negative and therefore biologically impossible input is needed to return from a state of high output). Examples of each in biological contexts can be found on their respective pages.
Ultrasensitive, bistable, and irreversibly bistable networks all show qualitative change in network behavior around certain parameter values– these are their bifurcation points.
Basic bifurcations in the presence of error
Figure 2. Saddle-node bifurcation phase portrait, where the control parameter is varied (labelled ε instead of r, but functionally equivalent). As ε decreases, the fixed points come together and annihilate one another; As ε increases, the fixed points appear. dx/dt is denoted as v.
Nonlinear dynamical systems can be most easily understood with a one-dimensional example system where the change in some quantity x (e.g. protein concentration) abundance depends only on itself:
Instead of solving the system analytically, which can be difficult or impossible for many functions, it is often quickest and most informative to take a geometric approach and draw a phase portrait. A phase portrait is a qualitative sketch of the differential equation's behavior that shows equilibrium solutions or fixed points and the vector field on the real line.
Bifurcations describe changes in the stability or existence of fixed points as a control parameter in the system changes. As a very simple explanation of a bifurcation in a dynamical system, consider an object balanced on top of a vertical beam. The mass of the object can be thought of as the control parameter, r, and the beam's deflection from the vertical axis is the dynamic variable, x. As r increases, x remains relatively stable. But when the mass reaches a certain point– the bifurcation point– the beam will suddenly buckle, in a direction dependent on minor imperfections in the setup. This is an example of a pitchfork bifurcation. Changes in the control parameter eventually changed the qualitative behavior of the system.
Saddle-node bifurcation
For a more rigorous example, consider the dynamical system shown in Figure 2, described by the following equation:
where r is once again the control parameter (labeled ε in Figure 2). The system's fixed points are represented by where the phase portrait curve crosses the x-axis. The stability of a given fixed point can be determined by the direction of flow on the x-axis; for instance, in Figure 2, the green point is unstable (divergent flow), and the red one is stable (convergent flow). At first, when r is greater than 0, the system has one stable fixed point and one unstable fixed point. As r decreases the fixed points move together, briefly collide into a semi-stable fixed point at r = 0, and then cease to exist when r < 0.
In this case, because the behavior of the system changes significantly when the control parameter r is 0, 0 is a bifurcation point. By tracing the position of the fixed points in Figure 2 as r varies, one is able to generate the bifurcation diagram shown in Figure 3.
Other types of bifurcations are also important in dynamical systems, but the saddle-node bifurcation tends to be most important in biology. Real biological systems are subject to small stochastic variations that introduce error terms into the dynamical equations, and this usually leads to more complex bifurcations simplifying into separate saddle nodes and fixed points. Two such examples of "imperfect" bifurcations that can appear in biology are discussed below. Note that the saddle node itself in the presence of error simply translates in the x-r plane, with no change in qualitative behavior; this can be proven using the same analysis as presented below.
Figure 4. Unperturbed (black) and imperfect (red) transcritical bifurcations, overlaid. u and p are referred to as x and r, respectively, in the rest of the article. As before, solid lines are stable, and dotted unstable.
and the bifurcation diagram in Figure 4 (black curves). The phase diagrams are shown in Figure 5. Tracking the x-intercepts in the phase diagram as r changes, there are two fixed point trajectories which intersect at the origin; this is the bifurcation point (intuitively, when the number of x-intercepts in the phase portrait changes). The left fixed point is always unstable, and the right one stable.
Figure 5. Ideal transcritical bifurcation phase portraits. Fixed points are marked on the x-axis, each trajectory in a different color. The direction of the arrows indicates which direction they move as r increases. The red point is unstable, and the blue point is unstable. The black dot at the origin is stable for r < 0, and unstable for r > 0.
Now consider the addition of an error term h, where 0 < h << 1. That is,
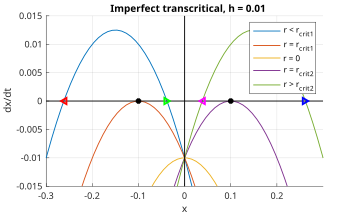
The error term translates all the phase portraits vertically, downward if h is positive. In the left half of Figure 6 (x < 0), the black, red, and green fixed points are semistable, unstable, and stable, respectively. This is mirrored by the magenta, black, and blue points on the right half (x > 0). Each of these halves thus behaves like a saddle-node bifurcation; in other words, the imperfect transcritical bifurcation can be approximated by two saddle-node bifurcations when close to the critical points, as evident in the red curves of Figure 4.
Linear stability analysis
Figure 6. Imperfect transcritical bifurcation phase portraits. Five values of r are shown, given relative to the two critical points. Note that the y-intercept value is the same as h, or the magnitude of the imperfection. The green and blue points are stable, while the green red and magenta are unstable. The black dots indicate semistable fixed points.
Besides observing the flow in the phase diagrams, it is also possible to demonstrate the stability of various fixed points using linear stability analysis. First, find the fixed points in the phase portrait by setting the bifurcation equation to 0:
where in the last step the approximation 4h << r2 has been used, which is reasonable for studying fixed points well past the bifurcation point, such as the light blue and green curves in Figure 6. Simplifying further,
Next, determine whether the phase portrait curve is increasing or decreasing at the fixed points, which can be assessed by plugging x* into the first derivative of the bifurcation equation.
The results are complicated by the fact that r can be both positive and negative; nonetheless, the conclusions are the same as before regarding the stability of each fixed point. This comes as no surprise, since the first derivative contains the same information as the phase diagram flow analysis. The colors in the above solution correspond to the arrows in Figure 6.
Imperfect pitchfork bifurcation
The buckling beam example from earlier is an example of a pitchfork bifurcation (perhaps more appropriately dubbed a "trifurcation"). The "ideal" pitchfork is shown on the left of Figure 7, given by
and r = 0 is where the bifurcation occurs, represented by the black dot at the origin of Figure 8. As r increases past 0, the black dot splits into three trajectories: the blue stable fixed point that moves right, the red stable point that moves left, and a third unstable point that stays at the origin. The blue and red are solid lines in Figure 7 (left), while the black unstable trajectory is the dotted portion along the positive x-axis.
As before, consider an error term h, where 0 < h << 1, i.e.
Figure 8. Ideal pitchfork bifurcation phase portraits. Fixed points are marked on the x-axis, each trajectory in a different color. The direction of the arrows indicates which direction they move as r increases. The red and blue points are stable, and there is a third unstable fixed point at the origin, indicated by the black dot. For r = rcrit = 0, the black dot also indicates a semi-stable point that appears and splits into the other three trajectories as r increases.
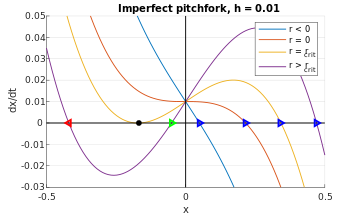
Once again, the phase portraits are translated upward an infinitesimal amount, as shown in Figure 9.Tracking the x-intercepts in the phase diagram as r changes yields the fixed points, which recapitulate the qualitative result from Figure 7 (right). More specifically, the blue fixed point from Figure 9 corresponds to the upper trajectory in Figure 7 (right); the green fixed point is the dotted trajectory; and the red fixed point is the bottommost trajectory. Thus, in the imperfect case (h ≠ 0), the pitchfork bifurcation simplifies into a single stable fixed point coupled with a saddle-node bifurcation.
A linear stability analysis can also be performed here, except using the generalized solution for a cubic equation instead of quadratic. The process is the same: 1) set the differential equation to zero and find the analytical form of the fixed points x*, 2) plug each x* into the first derivative , then 3) evaluate stability based on whether is positive or negative.
Figure 9. Imperfect pitchfork bifurcation phase portraits. Four different values of r relative to rcrit are shown. Note that the y-intercept value is the same as h, or the magnitude of the imperfection. The red and blue points are stable, while the green one (previously hidden at the origin) is unstable. As in Figure 5, the black dot indicates a semi-stable point that appears and splits into the red and green ones as r increases.
Multistability
Combined saddle-node bifurcations in a system can generate multistability. Bistability (a special case of multistability) is an important property in many biological systems, often the result of network architecture containing a mix of positive feedback interactions and ultra-sensitive elements. Bistable systems are hysteretic, i.e. the state of the system depends on the history of inputs, which can be crucial for switch-like control of cellular processes.[2] For instance, this is important in contexts where a cell decides whether to commit to a particular pathway; a non-hysteretic response might switch the system on-and-off rapidly when subject to random thermal fluctuations close to the activation threshold, which can be resource-inefficient.
In population ecology, the dynamics of food web interactions networks can exhibit Hopf bifurcations. For instance, in an aquatic system consisting of a primary producer, a mineral resource, and an herbivore, researchers found that patterns of equilibrium, cycling, and extinction of populations could be qualitatively described with a simple nonlinear model with a Hopf Bifurcation.[4]
Galactose utilization in budding yeast (S. cerevisiae) is measurable through GFP expression induced by the GAL promoter as a function of changing galactose concentrations. The system exhibits bistable switching between induced and non-induced states.[5]
Similarly, lactose utilization in E. coli as a function of thio-methylgalactoside (a lactose analogue) concentration measured by a GFP-expressing lac promoter exhibits bistability and hysteresis (Figure 10, left and right respectively).[6]
↑ David Angeli, James E. Ferrell, Jr., and Eduardo D.Sontag. Detection of multistability, bifurcations, and hysteresis in a large class of biological positive-feedback systems. PNAS February 17, 2004 vol. 101 no. 7 1822-1827
↑ Gregor F. Fussmann, Stephen P. Ellner, Kyle W. Shertzer, and Nelson G. Hairston Jr. Crossing the Hopf Bifurcation in a Live Predator–Prey System. Science. 17 November 2000: 290 (5495), 1358–1360. doi:10.1126/science.290.5495.1358
↑ Song C, Phenix H, Abedi V, Scott M, Ingalls BP, et al. 2010 Estimating the Stochastic Bifurcation Structure of Cellular Networks. PLoS Comput Biol 6(3): e1000699. doi:10.1371/journal.pcbi.1000699
↑ Ertugrul M. Ozbudak, Mukund Thattai, Han N. Lim, Boris I. Shraiman & Alexander van Oudenaarden. Multistability in the lactose utilization network of Escherichia coli. Nature. 2004 Feb 19; 427(6976):737–40
This page is based on this Wikipedia article Text is available under the CC BY-SA 4.0 license; additional terms may apply. Images, videos and audio are available under their respective licenses.