Too often systems fail, sometimes leading to significant loss of life, fortunes and confidence in the provider of a product or service. It was determined that a simple and useful tool was needed to help in the analysis of interactions of groups and systems to determine possible unexpected consequences. The tool didn’t need to provide every possible outcome of the interactions but needed to provide a means for analysts and product/service development stakeholders to evaluate the potential risks associated with implementing new functionality in a system. They needed a brainstorming tool to help ascertain if a concept was viable from a business perspective. The control–feedback–abort loop and the analysis diagram is one such tool that has helped organizations analyze their system workflows and workflow exceptions.
The concept of the Control–Feedback–Abort (CFA) loop is based upon another concept called the ‘Control – Feedback Loop'. The Control – Feedback Loop has been around for many years and was the key concept in the development of many electronic designs such as Phase-Lock Loops.[1] The core of the CFA loop concept was based on a major need that corporate executives and staff can anticipate the operation of systems, processes, products and services they use and create before they are developed.[2]
Control theory in control systems engineering is a subfield of mathematics that deals with the control of continuously operating dynamical systems in engineered processes and machines. The objective is to develop a control model for controlling such systems using a control action in an optimum manner without delay or overshoot and ensuring control stability.
History of CFA loop concept
The concept of the CFA loop was developed by T. James LeDoux, ‘Jim’, a Senior Consultant and software QA / test expert and owner of Alpha Group 3 LLC[permanent dead link], a test management consulting company. In 1986, Mr. LeDoux, with assistance from Mr. Warren Yates, a former engineer from General Dynamics, Inc., found that using a Control and Feedback concept for analyzing group and system dynamics was not providing them with the full picture when systems were going out of control. In 1996, Jim LeDoux and Dr. Larry W. Smith, Ph.D., president of Remote Testing Services, Inc., discussed the issue at length and came to the conclusion that some other form of control must be present when a system goes out of control, even if the control is unintended.
Software testing is an investigation conducted to provide stakeholders with information about the quality of the software product or service under test. Software testing can also provide an objective, independent view of the software to allow the business to appreciate and understand the risks of software implementation. Test techniques include the process of executing a program or application with the intent of finding software bugs, and verifying that the software product is fit for use.
General Dynamics Corporation (GD) is an American aerospace and defense multinational corporation formed by mergers and divestitures. It is the world's fifth-largest defense contractor based on 2012 revenues. The company ranked No. 99 in the 2018 Fortune 500 list of the largest United States corporations by total revenue. It is headquartered in West Falls Church, Fairfax County, Virginia.
In 1997, Mr. LeDoux used the change of behavior a person exhibits when driving a car at the time a police car pulls in behind them to describe how a change of control occurs. He demonstrated this phenomenon at a 2003 Product Development and Management Association (PDMA) meeting in Denver by showing the action of the first control (traffic, signs and speed) being aborted by the driver and a second control (police car, signs and speed) becoming the primary control. In 2004, Mr. LeDoux worked with Dr. Susan Wheeler, Ed. D., a former Instructional Design Consultant with Nims, Inc. and the present Director of Technology Services at Illinois Central College, to identify the range of uses for the CFA Loop. The CFA Loop is now being used to analyze system activities in several Fortune 100 companies. A discussion of its use is also included in the management book “Takeoff!: The Introduction to Project Management Book that Will Make Your Projects Take Off and Fly!” by Dr. Dan Price, D.M.[3]ISBN978-0-9707461-1-5
The Product Development and Management Association (PDMA) is a non-profit professional society that organizes and publishes information about the development of new products.
Instructional design (ID), also known as instructional systems design (ISD), is the practice of systematically designing, developing and delivering instructional products and experiences, both digital and physical, in a consistent and reliable fashion towards an efficient, effective, appealing, engaging and inspiring acquisition of knowledge. The process consists broadly of determining the state and needs of the learner, defining the end goal of instruction, and creating some "intervention" to assist in the transition. The outcome of this instruction may be directly observable and scientifically measured or completely hidden and assumed. There are many instructional design models but many are based on the ADDIE model with the five phases: analysis, design, development, implementation, and evaluation.
The Fortune 500 is an annual list compiled and published by Fortune magazine that ranks 500 of the largest United States corporations by total revenue for their respective fiscal years. The list includes publicly held companies, along with privately held companies for which revenues are publicly available. The concept of the Fortune 500 was created by Edgar P. Smith, a Fortune editor, and the first list was published in 1955. The Fortune 500 is more commonly used than its subset Fortune 100 or superset Fortune 1000.
It was found that strong similarities existed between the concept of ‘Control Charts’ and the CFA Loop. The difference in the two concepts was that control charting is used as a dynamic measurement of present conditions. The CFA Loop is used to analyze how a closed-loop system is supposed to work and what are the expectations when alternate controls take over by either intent or accident. A comparison of the CFA Loop and its relationship to Control Charts are presented in a later section of this discussion.
Control charts, also known as Shewhart charts or process-behavior charts, are a statistical process control tool used to determine if a manufacturing or business process is in a state of control.
The control–feedback concept
The control–feedback concept consisted of a ‘Control’ that gave information on the way the component was to perform and then adjustments to the control's present operation based upon the feedback. It used a concept called ‘Sampling’ to determine how often the ‘Control’ used the ‘Feedback’ information so that the ‘Control’ could modify instructions to the component.
What is the CFA loop
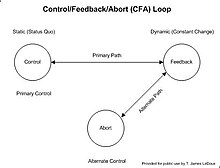
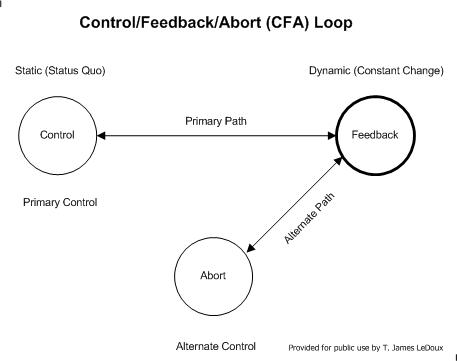
Figure 1 shows a model of the CFA loop. The CFA loop consists of three main elements – The Control element, the Feedback element and the Abort element. Within any system, the lack of any one of these three elements will result in the system failing at some point in time. The term ‘system’ used in this document can represent any environment, task, process, procedure or system in a physical, organizational or natural structure where an entity will respond to influences. It has been found, through experience, that even trees appear to follow the CFA model. The diagram in Figure 1 can be used as an analysis diagram by inserting functions of the controls, feedbacks and aborts in each of the related circles defining the system being analyzed. (Example: Control – Workflow requests, Feedback – Results of requests, Aborts – Requests that failed, workflow exception path)
The CFA model can be used effectively with 3-sigma control charts. CFA loops and Control Charts share the same functionality, which will be discussed later in this document.
Figure 1 – The CFA loop
A description of the control–feedback–abort (CFA) loop
As mentioned, the CFA Loop consists of three elements – Control, Feedback and Abort. First, we will discuss the Control element of the loop.
The control element
The Control element of the CFA loop, as highlighted in Figure 2, controls the activity of the system in question. A basic characteristic of the Control element is that it is always in a static state until it receives new information from the feedback. This static state is, in reality, the Control element holding the system in a status quo condition. Using an automobile as an example, if the previous instruction provided by the Control to the auto was to accelerate, it would continue to accelerate until a feedback reading would indicate to the Control that the Control should issue an instruction to stop accelerating.
Remember, the idea of the static condition is not saying that nothing is happening but rather to say that nothing is changing in the instructions given to the system since the last instruction from the Control. If the last instruction by the Control is to accelerate, the system will continue to accelerate until told otherwise.
The Control element is the ‘primary control’ for the system. While everything is operating within a ‘normal’ operational mode, the Control element remains the primary control.
Figure 2 – CFA Loop – Control Element
The feedback element
The Feedback element feeds back information on the present state of the system. Due to the fact that the Feedback element is always reading the present state of the system, the feedback element has the basic characteristic of always being in a ‘dynamic’ state. This means that the feedback is reading constantly changing conditions. No system is ever in a non-changing condition except if it is off, no longer functioning or dead. Look at a computer in a wait state. It is still performing administrative activities even while it waits for some activity to happen. Change is the constant state of the Feedback element.
For this reason, the Feedback element needs to provide information to the Control element at intervals necessary to provide the Control element time to adequately respond to the changing environment. This interval period is called ‘sampling’, which will be discussed later in this document.
Figure 3 – CFA Loop – Feedback Element
The communication between the Control element and the Feedback element is performed by way of the ‘Primary Path’ (see Figure 4). The Primary Path is a bidirectional path that allows for the Control Element to request a sample of the information and the Feedback element to respond.
Figure 4 – CFA loop – primary path
The abort element
The abort element (see Figure 5) is so named because it responds to conditions that resulted in the primary path being ‘aborted’. The Abort element then takes over the act of control until conditions can be brought back into acceptable parameters.
Figure 5 – CFA loop – abort element
The ‘Alternate Path’ (see Figure 6) is used for communication between the Alternate Control (Abort) and the Feedback. The Feedback at this point may be a different set of feedbacks than was defined for the primary path.
Figure 6 – CFA loop – alternate path
To demonstrate that the Feedback may be another set of feedback elements, we look at the following example.
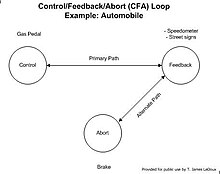
Let’s use the act of driving the auto once more for our example (see Figure 7). When a driver is driving the car, the primary path is the Control element (gas pedal) and the Feedback element (speedometer and street signs). Once a stop sign is detected ahead, the driver will take the foot off the gas pedal (primary control) and press the brake pedal (alternate control). Note that the driver is no longer looking at the speedometer or street signs once the auto gets to the stop sign. The driver is looking for other cars that may cross his path. In other words, the driver is looking for a different set of feedback sources. Once he feels it is safe to go, he will go back to the primary control and feedback and the primary path.
Figure 7 – CFA for automobile speed adjustment
Sampling and the feedback element
In order for the Control element to be able to give proper instructions on what the system needs to do next, the information provided by the Feedback needs to be a true representation of the present conditions. If the feedback information is sampled by the Control element too often, it can put unnecessary demands on the system. If the information is not read often enough, considerable error can occur resulting in system failure. The solution to this dilemma is to sample when needed, at a rate that allows us to have confidence that we can still maintain control over the system.[4]
Going back to our auto. The rate we sample the street signs for information is going to be different from when we look at the speedometer. We may also change our sampling rate when certain outside influences introduce themselves into the feedback mix. If we have a police car behind us, odds are that we will be sampling the speedometer much more often than if a police car was not there.
Creating the control loop diagram using the CFA loop
The Control Loop Diagram is a chart that provides a list of each of the conditions we discover during the analysis of the interaction of the specific item in question. A basic Control Loop Diagram is shown in Table 1.
Control Element Conditions
Feedback Element Conditions
Abort Element Conditions
Control Element Name
Feedback Element Name
Abort Element Name
Numbered list
Numbered list
Numbered list
Table 1 – Control loop diagram template
The Control Loop Diagram provides a vehicle for the CFA Loop to be used effectively. The following is a sequence that allows for us to create the CFA Loop analysis information and convert it into a Control Loop Diagram. The process is:
A. Identify the perspective of the CFA Loop.
It is important to know what the perspective is. We may be looking at the environment from a specific perspective (i.e. from the viewpoint of a Test Manager looking at defects or a Development Manager looking at versions.) The perspective will determine what is to be the Control and what is providing the Feedback for the analysis.
B. Identify what is controlling the environment.
C. Identify the Feedback components.
By identifying the controlling environment and the feedback elements, we can identify the parameters of the primary path.
D. Identify the conditions that would lead to an abort of the primary path.
The abort conditions can give us an insight into the limitations and boundaries the primary path must operate within.
E. Identify the processes the Control will use to manage the environment.
The interaction between the control and feedback elements can now be analyzed and the resulting information can be mapped into the Control Loop Diagram.
F. Identify the processes used when the Abort is given control.
An example of the CFA loop – control loop diagram relationship
The following CFA Loop and Control Loop Diagram exhibit the relationship between a Version Control/Defect Reporting CFA Loop (Figure 8) and its associated Control Loop Diagram (Table 2).
Figure 8 – CFA loop for version control/defect reporting
A Control Loop Diagram for the CFA Loop with a focus on Version Control as the Control element (see Table 2) should look similar to the following table (mapped during an analysis brainstorming session):
Control Element Conditions
Feedback Element Conditions
Abort Element Conditions
Version Control (A)
Defect Reporting (B)
Issues Management (C)
1. Version must match the incremental sub-version number expected to fix the next set of defects
1. Defects reported back by critical levels
1. Defects that cannot be fixed within a predefined time must be escalated
2. Defects that are fixed, tested and passed cause the sub-version count to be incremented
2. Critical defect count
2. Defects violating the critical defect count or the age limits on critical defects will automatically create an Abort
3. Defects not above a predefined count
Table 2 – Control Loop Diagram
Control charts
Control Charts have a very close relationship to the CFA Loop. Control Charts are used to provide a means of tracking the trend and condition of a specific measured item. The Control Chart (see Figure 9) uses the standard deviation of sampled items to determine whether the item is in-bounds (within acceptable conditions) or out of bounds (outside of acceptable conditions). The +3s is also identified as the Upper Defined-Control Limit or UDL. The -3s is also known as the Lower Defined-Control Limit or LDL.
Figure 9 – Control chart limits
Those items that are in bounds are considered to be in control (see Figure 10). They can be the Control element of the CFA Loop.
Figure 10 – Control chart in-bounds area
Those items that are out of bounds are said to be out of control (see Figure 11). The out of bounds areas can also be identified as the Abort element of the CFA Loop.
Figure 11 – Control chart out-of-bounds area
Remember that it was mentioned earlier in this document that the CFA Loop and the Control Chart share the similar functions, the difference is in the use and objectives. We have already seen the Control and Abort similarities.
Let’s look at a Control Chart (see Figure 12) and compare the information in the Control Chart with the CFA Loop elements.
Figure 12 – Control chart showing use
The ‘in bounds’ area is our Control element. As long as our data points, sometimes called items, are within the ‘in bounds’ area, we are said to be in control. The data points are the Feedback element. The ‘out of bounds’ areas are the Abort elements. Notice that data point 4 is in the ‘out of bounds’ area, which should lead to control being passed to the Abort element in order to take action to bring the future data points back into control. During the analysis of the system operation using the CFA Loop, the abort mechanism should have been clearly identified so that when the system goes out of bounds during operation, the alternate control should have been activated and the alternate action should be no surprise to the system designers.
The benefit of using control charts is due to its ability to report dynamic conditions of a system in operation. By data point 2, we should be able to see that if the data follows the trend set by the previous data points, the data will go out of control at some point. This ability to see the trend allows for the chart user to take early action to ensure that the system stays in control or to monitor automated abort processes used to bring the system back into control.
Notes and references
↑ Azais, F.; Bertrand, Y.; Renovell, M.; Ivanov, A.; Tabatabaei, S, “An all-digital DFT scheme for testing catastrophic faults in PLLs”, Design & Test of Computers, IEEE, 20, No. 1, (2003) 60–67
↑ Theron R. Leishman, Dr. David A. Cook, “Requirements Risks Can Drown Software Projects”, CrossTalk – The Journal of Defense Software Engineering, April 2002 Issue, 1–8
↑ Dr. Dan Price, Takeoff, (Colorado: Winning Ways Management, 2005), Pages 184–198
↑ Martin Gardner, Phaselock Techniques, (New Jersey: John Wiley and Sons), pages 285–287
This page is based on this Wikipedia article Text is available under the CC BY-SA 4.0 license; additional terms may apply. Images, videos and audio are available under their respective licenses.
Related Research Articles
Feedback occurs when outputs of a system are routed back as inputs as part of a chain of cause-and-effect that forms a circuit or loop. The system can then be said to feed back into itself. The notion of cause-and-effect has to be handled carefully when applied to feedback systems:
Simple causal reasoning about a feedback system is difficult because the first system influences the second and second system influences the first, leading to a circular argument. This makes reasoning based upon cause and effect tricky, and it is necessary to analyze the system as a whole.
A programmable logic controller (PLC) or programmable controller is an industrial digital computer which has been ruggedized and adapted for the control of manufacturing processes, such as assembly lines, or robotic devices, or any activity that requires high reliability control and ease of programming and process fault diagnosis.
In electronics and control system theory, loop gain is the sum of the gain, expressed as a ratio or in decibels, around a feedback loop. Feedback loops are widely used in electronics in amplifiers and oscillators, and more generally in both electronic and nonelectronic industrial control systems to control industrial plant and equipment. The concept is also used in biology. In a feedback loop, the output of a device, process or plant is sampled and applied to alter the input, to better control the output. The loop gain, along with the related concept of loop phase shift, determines the behavior of the device, and particularly whether the output is stable, or unstable, which can result in oscillation. The importance of loop gain as a parameter for characterizing electronic feedback amplifiers was first recognized by Heinrich Barkhausen in 1921, and was developed further by Hendrik Wade Bode and Harry Nyquist at Bell Labs in the 1930s.
System dynamics (SD) is an approach to understanding the nonlinear behaviour of complex systems over time using stocks, flows, internal feedback loops, table functions and time delays.
A Negative-feedback amplifier is an electronic amplifier that subtracts a fraction of its output from its input, so that negative feedback opposes the original signal. The applied negative feedback can improve its performance and reduces sensitivity to parameter variations due to manufacturing or environment. Because of these advantages, many amplifiers and control systems use negative feedback.
Negative feedback occurs when some function of the output of a system, process, or mechanism is fed back in a manner that tends to reduce the fluctuations in the output, whether caused by changes in the input or by other disturbances.
A flowchart is a type of diagram that represents an algorithm, workflow or process. The flowchart shows the steps as boxes of various kinds, and their order by connecting the boxes with arrows. This diagrammatic representation illustrates a solution model to a given problem. Flowcharts are used in analyzing, designing, documenting or managing a process or program in various fields.
An oxygen sensor (or lambda sensor, where lambda refers to air–fuel equivalence ratio, usually denoted by λ) is an electronic device that measures the proportion of oxygen (O2) in the gas or liquid being analysed.
Dynamic enterprise modeling (DEM) is an enterprise modeling approach developed by the Baan company, and used for the Baan enterprise resource planning system which aims "to align and implement it in the organizational architecture of the end-using company".
In control theory, quantitative feedback theory (QFT), developed by Isaac Horowitz, is a frequency domain technique utilising the Nichols chart (NC) in order to achieve a desired robust design over a specified region of plant uncertainty. Desired time-domain responses are translated into frequency domain tolerances, which lead to bounds on the loop transmission function. The design process is highly transparent, allowing a designer to see what trade-offs are necessary to achieve a desired performance level.
A causal loop diagram (CLD) is a causal diagram that aids in visualizing how different variables in a system are interrelated. The diagram consists of a set of nodes and edges. Nodes represent the variables and edges are the links that represent a connection or a relation between the two variables. A link marked positive indicates a positive relation and a link marked negative indicates a negative relation. A positive causal link means the two nodes change in the same direction, i.e. if the node in which the link starts decreases, the other node also decreases. Similarly, if the node in which the link starts increases, the other node increases as well. A negative causal link means the two nodes change in opposite directions, i.e. if the node in which the link starts increases, the other node decreases and vice versa.
Closed cycles in the diagram are very important features of the CLDs. A closed cycle is either defined as a reinforcing or balancing feedback loop. A reinforcing loop is a cycle in which the effect of a variation in any variable propagates through the loop and returns to the variable reinforcing the initial deviation i.e. if a variable increases in a reinforcing loop the effect through the cycle will return an increase to the same variable and vice versa. A balancing loop is the cycle in which the effect of a variation in any variable propagates through the loop and returns to the variable a deviation opposite to the initial one i.e. if a variable increases in a balancing loop the effect through the cycle will return a decrease to the same variable and vice versa.
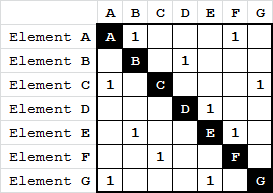
The Design Structure Matrix (DSM; also referred to as dependency structure matrix, dependency structure method, dependency source matrix, problem solving matrix (PSM), incidence matrix, N2 matrix, interaction matrix, dependency map or design precedence matrix) is a simple, compact and visual representation of a system or project in the form of a square matrix.
The terms closed system and open system have long been defined in the widely established subject of thermodynamics, in terms that have nothing to do with the concepts of feedback and feedforward. The terms 'feedforward' and 'feedback' arose first in the 1920s in the theory of amplifier design, more recently than the thermodynamic terms. Negative feedback was eventually patented by H.S Black in 1934. In thermodynamics, an open system is one that can take in and give out ponderable matter. In thermodynamics, a closed system is one that cannot take in or give out ponderable matter, but may be able to take in or give out radiation and heat and work or any form of energy. In thermodynamics, a closed system can be further restricted, by being 'isolated': an isolated system cannot take in nor give out either ponderable matter or any form of energy. It does not make sense to try to use these well established terms to try to distinguish the presence or absence of feedback in a control system.
Control, or controlling, is one of the managerial functions like planning, organizing, staffing and directing. It is an important function because it helps to check the errors and to take the corrective action so that deviation from standards are minimized and stated goals of the organization are achieved in a desired manner.
A functional flow block diagram (FFBD) is a multi-tier, time-sequenced, step-by-step flow diagram of a system’s functional flow. The term "functional" in this context is different from its use in functional programming or in mathematics, where pairing "functional" with "flow" would be ambiguous. Here, "functional flow" pertains to the sequencing of operations, with "flow" arrows expressing dependence on the success of prior operations. FFBDs may also express input and output data dependencies between functional blocks, as shown in figures below, but FFBDs primarily focus on sequencing.
The N 2 chart, also referred to as N 2 diagram, N-squared diagram or N-squared chart, is a diagram in the shape of a matrix, representing functional or physical interfaces between system elements. It is used to systematically identify, define, tabulate, design, and analyze functional and physical interfaces. It applies to system interfaces and hardware and/or software interfaces.
A control-flow diagram (CFD) is a diagram to describe the control flow of a business process, process or review
A Scanning SQUID Microscope is a sensitive near-field imaging system for the measurement of weak magnetic fields by moving a Superconducting Quantum Interference Device (SQUID) across an area. The microscope can map out buried current-carrying wires by measuring the magnetic fields produced by the currents, or can be used to image fields produced by magnetic materials. By mapping out the current in an integrated circuit or a package, short circuits can be localized and chip designs can be verified to see that current is flowing where expected.
Parasitic oscillation is an undesirable electronic oscillation in an electronic or digital device. It is often caused by feedback in an amplifying device. The problem occurs notably in RF, audio, and other electronic amplifiers as well as in digital signal processing. It is one of the fundamental issues addressed by control theory.