
In descriptive statistics, the interquartile range (IQR) is a measure of statistical dispersion, which is the spread of the data. The IQR may also be called the midspread, middle 50%, fourth spread, or H‑spread. It is defined as the difference between the 75th and 25th percentiles of the data. To calculate the IQR, the data set is divided into quartiles, or four rank-ordered even parts via linear interpolation. These quartiles are denoted by Q1 (also called the lower quartile), Q2 (the median), and Q3 (also called the upper quartile). The lower quartile corresponds with the 25th percentile and the upper quartile corresponds with the 75th percentile, so IQR = Q3 − Q1.
In probability theory and statistics, kurtosis refers to the degree of “tailedness” in the probability distribution of a real-valued random variable. Similar to skewness, kurtosis provides insight into specific characteristics of a distribution. Various methods exist for quantifying kurtosis in theoretical distributions, and corresponding techniques allow estimation based on sample data from a population. It’s important to note that different measures of kurtosis can yield varying interpretations.
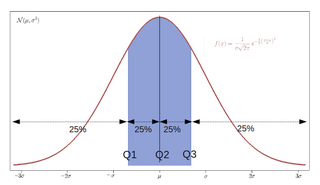
In statistics and probability, quantiles are cut points dividing the range of a probability distribution into continuous intervals with equal probabilities, or dividing the observations in a sample in the same way. There is one fewer quantile than the number of groups created. Common quantiles have special names, such as quartiles, deciles, and percentiles. The groups created are termed halves, thirds, quarters, etc., though sometimes the terms for the quantile are used for the groups created, rather than for the cut points.

In descriptive statistics, summary statistics are used to summarize a set of observations, in order to communicate the largest amount of information as simply as possible. Statisticians commonly try to describe the observations in

In probability theory and statistics, skewness is a measure of the asymmetry of the probability distribution of a real-valued random variable about its mean. The skewness value can be positive, zero, negative, or undefined.
The average absolute deviation (AAD) of a data set is the average of the absolute deviations from a central point. It is a summary statistic of statistical dispersion or variability. In the general form, the central point can be a mean, median, mode, or the result of any other measure of central tendency or any reference value related to the given data set. AAD includes the mean absolute deviation and the median absolute deviation.
Student's t-test is a statistical test used to test whether the difference between the response of two groups is statistically significant or not. It is any statistical hypothesis test in which the test statistic follows a Student's t-distribution under the null hypothesis. It is most commonly applied when the test statistic would follow a normal distribution if the value of a scaling term in the test statistic were known. When the scaling term is estimated based on the data, the test statistic—under certain conditions—follows a Student's t distribution. The t-test's most common application is to test whether the means of two populations are significantly different. In many cases, a Z-test will yield very similar results to a t-test because the latter converges to the former as the size of the dataset increases.
This glossary of statistics and probability is a list of definitions of terms and concepts used in the mathematical sciences of statistics and probability, their sub-disciplines, and related fields. For additional related terms, see Glossary of mathematics and Glossary of experimental design.
In statistics, the mid-range or mid-extreme is a measure of central tendency of a sample defined as the arithmetic mean of the maximum and minimum values of the data set:
Robust statistics are statistics that maintain their properties even if the underlying distributional assumptions are incorrect. Robust statistical methods have been developed for many common problems, such as estimating location, scale, and regression parameters. One motivation is to produce statistical methods that are not unduly affected by outliers. Another motivation is to provide methods with good performance when there are small departures from a parametric distribution. For example, robust methods work well for mixtures of two normal distributions with different standard deviations; under this model, non-robust methods like a t-test work poorly.
Bootstrapping is a procedure for estimating the distribution of an estimator by resampling one's data or a model estimated from the data. Bootstrapping assigns measures of accuracy to sample estimates. This technique allows estimation of the sampling distribution of almost any statistic using random sampling methods.
In statistics, Welch's t-test, or unequal variances t-test, is a two-sample location test which is used to test the (null) hypothesis that two populations have equal means. It is named for its creator, Bernard Lewis Welch, and is an adaptation of Student's t-test, and is more reliable when the two samples have unequal variances and possibly unequal sample sizes. These tests are often referred to as "unpaired" or "independent samples" t-tests, as they are typically applied when the statistical units underlying the two samples being compared are non-overlapping. Given that Welch's t-test has been less popular than Student's t-test and may be less familiar to readers, a more informative name is "Welch's unequal variances t-test" — or "unequal variances t-test" for brevity.
In statistics, normality tests are used to determine if a data set is well-modeled by a normal distribution and to compute how likely it is for a random variable underlying the data set to be normally distributed.
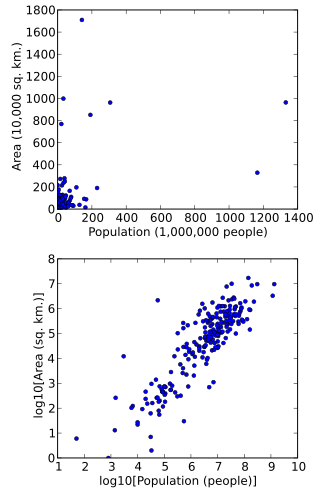
In statistics, data transformation is the application of a deterministic mathematical function to each point in a data set—that is, each data point zi is replaced with the transformed value yi = f(zi), where f is a function. Transforms are usually applied so that the data appear to more closely meet the assumptions of a statistical inference procedure that is to be applied, or to improve the interpretability or appearance of graphs.
In statistics, D'Agostino's K2 test, named for Ralph D'Agostino, is a goodness-of-fit measure of departure from normality, that is the test aims to gauge the compatibility of given data with the null hypothesis that the data is a realization of independent, identically distributed Gaussian random variables. The test is based on transformations of the sample kurtosis and skewness, and has power only against the alternatives that the distribution is skewed and/or kurtic.
In statistics, an L-estimator is an estimator which is a linear combination of order statistics of the measurements. This can be as little as a single point, as in the median, or as many as all points, as in the mean.
In statistics, the sample maximum and sample minimum, also called the largest observation and smallest observation, are the values of the greatest and least elements of a sample. They are basic summary statistics, used in descriptive statistics such as the five-number summary and Bowley's seven-figure summary and the associated box plot.
In statistics, robust measures of scale are methods that quantify the statistical dispersion in a sample of numerical data while resisting outliers. The most common such robust statistics are the interquartile range (IQR) and the median absolute deviation (MAD). These are contrasted with conventional or non-robust measures of scale, such as sample standard deviation, which are greatly influenced by outliers.
In statistics, L-moments are a sequence of statistics used to summarize the shape of a probability distribution. They are linear combinations of order statistics (L-statistics) analogous to conventional moments, and can be used to calculate quantities analogous to standard deviation, skewness and kurtosis, termed the L-scale, L-skewness and L-kurtosis respectively. Standardised L-moments are called L-moment ratios and are analogous to standardized moments. Just as for conventional moments, a theoretical distribution has a set of population L-moments. Sample L-moments can be defined for a sample from the population, and can be used as estimators of the population L-moments.
In statistics, the Jarque–Bera test is a goodness-of-fit test of whether sample data have the skewness and kurtosis matching a normal distribution. The test is named after Carlos Jarque and Anil K. Bera. The test statistic is always nonnegative. If it is far from zero, it signals the data do not have a normal distribution.


