Demographic analysis

Last updated

Demographic analysis examines and measures the dimensions and dynamics of populations. These methods have primarily been developed to study human populations, but are extended to a variety of areas where researchers want to know how populations of social actors can change across time through processes of birth, death, and migration. In the context of human biological populations, demographic analysis uses administrative records to develop an independent estimate of the population. [1] Demographic analysis estimates are often considered a reliable standard for judging the accuracy of the census information gathered at any time. In the labor force, demographic analysis is used to estimate sizes and flows of populations of workers; in population ecology the focus is on the birth, death, migration and immigration of individuals in a population of living organisms, alternatively, in social human sciences could involve movement of firms and institutional forms. Demographic analysis is used in a wide variety of contexts. For example, it is often used in business plans, to describe the population connected to the geographic location of the business. [2] Demographic analysis is usually abbreviated as DA. [3] For the 2010 U.S. Census, The U.S. Census Bureau has expanded its DA categories. [3] Also as part of the 2010 U.S. Census, DA now also includes comparative analysis between independent housing estimates, and census address lists at different key time points. [3]

Contents

Introduction

Demography is the statistical and mathematical study of the size, composition, and spatial distribution of human populations and how these features change over time. Data are obtained from a census of the population and from registries: records of events like birth, deaths, migrations, marriages, divorces, diseases, and employment. To do this, there needs to be an understanding of how they are calculated and the questions they answer which are included in these four concepts: population change, standardization of population numbers, the demographic bookkeeping equation, and population composition.

Population change

Population change is analyzed by measuring the change between one population size to another. Global population continues to rise, which makes population change an essential component to demographics. This is calculated by taking one population size minus the population size in an earlier census. The best way of measuring population change is using the intercensal percentage change. The intercensal percentage change is the absolute change in population between the censuses divided by the population size in the earlier census. Next, multiply this a hundredfold to receive a percentage. When this statistic is achieved, the population growth between two or more nations that differ in size, can be accurately measured and examined. [4] [5]

Standardization of population numbers

For there to be a significant comparison, numbers must be altered for the size of the population that is under study. For example, the fertility rate is calculated as the ratio of the number of births to women of childbearing age to the total number of women in this age range. If these adjustments were not made, we would not know if a nation with a higher rate of births or deaths has a population with more women of childbearing age or more births per eligible woman.

Within the category of standardization, there are two major approaches: direct standardization and indirect standardization.

Direct standardization

Direct standardization is able to be used when the population being studied is large enough for age-specific rate is stable.

Indirect standardization

Indirect standardization is used when a population is small enough that the number of events (births, deaths, etc.) are also small. In this case, methods must be used to produce a standardized mortality rate (SMR) or standardized incidence rate (SIR). [6] [7]

Demographic bookkeeping (or balancing) equation

Demographic bookkeeping is used in the identification of four main components of population growth during any given time interval.

The demographic bookkeeping equation is as follows:

The four components being studied by this equation are population growth (P1, P2), Births (B), Deaths (D), and in- (Mi) and out- (Mo) migration.

Meaning, the population at any time is equal to the earlier population plus the excess of births over deaths in the time, plus the amount of in-migration minus the amount of out-migration.

Population composition

Population composition is the description of population defined by characteristics such as age, race, sex or marital status. These descriptions can be necessary for understanding the social dynamics from historical and comparative research. This data is often compared using a population pyramid.

Population composition is also a very important part of historical research. Information ranging back hundreds of years is not always worthwhile, because the numbers of people for which data are available may not provide the information that is important (such as population size). Lack of information on the original data-collection procedures may prevent accurate evaluation of data quality.

Demographic analysis in institutions and organizations

Labor market

The demographic analysis of labor markets can be used to show slow population growth, population aging, and the increased importance of immigration. The U.S. Census Bureau projects that in the next 100 years, the United States will face some dramatic demographic changes.[ citation needed ] The population is expected to grow more slowly and age more rapidly than ever before and the nation will become a nation of immigrants. This influx is projected to rise over the next century as new immigrants and their children will account for over half the U.S. population. These demographic shifts could ignite major adjustments in the economy, more specifically, in labor markets.[ citation needed ]

Turnover and in internal labor markets

People decide to exit organizations for many reasons, such as, better jobs, dissatisfaction, and concerns within the family. The causes of turnover can be split into two separate factors, one linked with the culture of the organization, and the other relating to all other factors. People who do not fully accept a culture might leave voluntarily. Or, some individuals might leave because they fail to fit in and fail to change within a particular organization.

Population ecology of organizations

A basic definition of population ecology is a study of the distribution and abundance of organisms. As it relates to organizations and demography, organizations go through various liabilities to their continued survival. Hospitals, like all other large and complex organizations are impacted in the environment they work. For example, a study was done on the closure of acute care hospitals in Florida between a particular time. The study examined effect size, age, and niche density of these particular hospitals. A population theory says that organizational outcomes are mostly determined by environmental factors. Among several factors of the theory, there are four that apply to the hospital closure example: size, age, density of niches in which organizations operate, and density of niches in which organizations are established.

Business organizations

Problems in which demographers may be called upon to assist business organizations are when determining the best prospective location in an area of a branch store or service outlet, predicting the demand for a new product, and to analyze certain dynamics of a company's workforce. Choosing a new location for a branch of a bank, choosing the area in which to start a new supermarket, consulting a bank loan officer that a particular location would be a beneficial site to start a car wash, and determining what shopping area would be best to buy and be redeveloped in metropolis area are types of problems in which demographers can be called upon.

Standardization is a useful demographic technique used in the analysis of a business. It can be used as an interpretive and analytic tool for the comparison of different markets.

Nonprofit organizations

These organizations have interests about the number and characteristics of their clients so they can maximize the sale of their products, their outlook on their influence, or the ends of their power, services, and beneficial works.

Related Research Articles

Demographic statistics are measures of the characteristics of, or changes to, a population. Records of births, deaths, marriages, immigration and emigration and a regular census of population provide information that is key to making sound decisions about national policy.

Demographics of North Korea Demographic features of the population of North Korea

The demographics of North Korea are determined through national censuses and international estimates. The Central Bureau of Statistics of North Korea conducted the most recent census in 2008, where the population reached 24 million inhabitants. The population density is 199.54 inhabitants per square kilometre, and the 2014 estimated life expectancy is 69.81 years. In 1980, the population rose at a near consistent, but low, rate. Since 2000, North Korea's birth rate has exceeded its death rate; the natural growth is positive. In terms of age structure, the population is dominated by the 15–64-year-old segment (68.09%). The median age of the population is 32.9 years, and the gender ratio is 0.95 males to 1.00 female. Since the early 1990s, the birth rate has been fairly stable, with an average of 2 children per woman, down from an average of 3 in the early 1980s.

Demographics of China Aspect of human geography in China

The demographics of China demonstrate a large population with a relatively small youth component, partially a result of China's one-child policy. China's population reached 1 billion in late 1981.

Demography of the United Kingdom

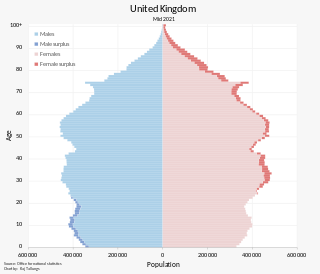
The current population of the United Kingdom is estimated at over 67.0 million, as of 2020. It is the 21st most populated country in the world and has a population density of 270 people per square kilometre, with England having significantly greater density than Wales, Scotland, and Northern Ireland. Almost a third of the population lives in South East England, which is predominantly urban and suburban, with about 9 million in the capital city, London, whose population density is just over 5,200 per square kilometre.

Demographics of Ukraine Demographics of country

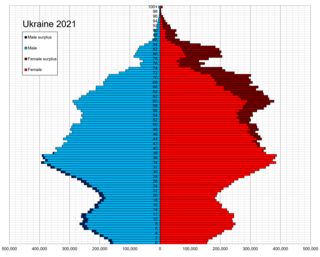
The demographics of Ukraine include statistics on population growth, population density, ethnicity, education level, health, economic status, religious affiliations, and other aspects of the population of Ukraine.

Demography Science that deals with populations and their structures, statistically and theoretically

Demography is the statistical study of populations, especially human beings.

Population dynamics is the type of mathematics used to model and study the size and age composition of populations as dynamical systems.

Zero population growth, sometimes abbreviated ZPG, is a condition of demographic balance where the number of people in a specified population neither grows nor declines, that is, the number of births plus in-migrants equals the number of deaths plus out-migrants. ZPG has been a prominent political movement since the 1960’s. As part of the concept of optimum population, the movement considers zero population growth to be an objective towards which countries and the whole world should strive in the interests of accomplishing long-term optimal standards and conditions of living.

Total fertility rate Number of children a woman is expected to have barring select circumstances

The total fertility rate (TFR) of a population is the average number of children that would be born to a woman over her lifetime if:

  1. she were to experience the exact current age-specific fertility rates (ASFRs) through her lifetime
  2. she were to live from birth until the end of her reproductive life.

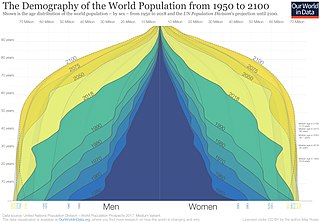
A population decline in humans is a reduction in a human population size. Over the long term, stretching from prehistory to the present, Earth's total human population has continued to grow; however, current projections suggest that this long-term trend of steady population growth may be coming to an end.

Population pyramid Graphical illustration showing distribution of age groups in a population

A population pyramid or "age-sex pyramid" is a graphical illustration of the distribution of a population by age groups and sex; it typically takes the shape of a pyramid when the population is growing. Males are usually shown on the left and females on the right, and they may be measured in absolute numbers or as a percentage of the total population. The pyramid can be used to visualize the age of a particular population. It is also used in ecology to determine the overall age distribution of a population; an indication of the reproductive capabilities and likelihood of the continuation of a species. Number of people per unit area of land is called population density.

Population geography

Population geography relates spatial variations in the distribution, composition, migration, and growth of populations to the terrain. Population geography involves demography in a geographical perspective. It focuses on the characteristics of population distributions that change in a spatial context. This often involves factors such as where population is found and how the size and composition of these population is regulated by the demographic processes of fertility, mortality, and migration.

Population momentum is a consequence of the demographic transition. Population momentum explains why a population will continue to grow even if the fertility rate declines. Population momentum occurs because it is not only the number of children per woman that determine population growth, but also the number of women in reproductive age. Eventually, when the fertility rate reaches the replacement rate and the population size of women in the reproductive age bracket stabilizes, the population achieves equilibrium and population momentum comes to an end. Population momentum is defined as the ratio of the size of the population at that new equilibrium level to the size of the initial population. Population momentum usually occurs in populations that are growing.

Rate of natural increase

In Demography, the rate of natural increase (RNI), also known as natural population change, is defined as the birth rate minus the death rate of a particular population, over a particular time period. It is typically expressed either as a number per 1,000 individuals in the population or as a percentage. RNI can be either positive or negative. It contrasts to total population change by ignoring net migration.

Population change is simply the change in the number of people in a specified area during a specific time period. Demographics is the study of population statistics, their variation and its causes. These statistics include birth rates, death rates, migration rates and sex ratios. All of these statistics are investigated by censuses and surveys conducted over a period of time. Some demographic information can also be obtained from historical maps, and aerial photographs.

The Population Estimates Program (PEP) is a program of the US Census Bureau that publishes annual population estimates and estimates of birth, death, and international migration rates for people in the United States. In addition to publishing those aggregate estimates for the entire country, the program also publishes those yearly estimates by age, sex, race, and Hispanic origin at the national, state, county and city and town level. By doing so, the Population Estimates Program provides up-to-date information on how the size and distribution of the US population has changed each year since the most recent 10-year US Census.

Earth has a human population of 7.97 billion, with an overall population density of 50 people per km2, excluding Antarctica. Nearly 60% of the world's population lives in Asia, with more than 2.7 billion in the countries of China and India combined. The percentage share of India, China and rest of South Asia in world population have remained on similar levels for the last few thousands years of recorded history. The world's literacy rate has increased dramatically in the last 40 years, from 66.7% in 1979 to 86.3% today. Lower literacy levels are mostly attributable to poverty. Lower literacy rates are mostly found in South Asia and Sub-Saharan Africa. The world's largest ethnic group is Han Chinese, with Mandarin being the world's most spoken language in terms of native speakers.

Projections of population growth World population growth projections

Population projections are attempts to show how the human population statistics might change in the future. These projections are an important input to forecasts of the population's impact on this planet and humanity's future well-being. Models of population growth take trends in human development, and apply projections into the future. These models use trend-based-assumptions about how populations will respond to economic, social and technological forces to understand how they will affect fertility and mortality, and thus population growth.

Fertility factors are determinants of the number of children that an individual is likely to have. Fertility factors are mostly positive or negative correlations without certain causations.

White demographic decline is a decrease in the white populace as a percentage of the total population in a city, state, subregion, or nation. It has been recorded in a number of countries and smaller jurisdictions. For example, according to their national censuses, white Americans, White Canadians, white Brazilians, and white people in the United Kingdom are in demographic decline in the United States, Canada, Brazil, and United Kingdom, respectively.

References

  1. http://govinfo.library.unt.edu/cmb/cmbp/downloads/da.pdf [ bare URL PDF ]
  2. Jean Murray. "How to Use Demographics for Business Advertising". About.com Money. Retrieved 26 March 2016.
  3. 1 2 3 US Census Bureau Webdesign: SSD, Laura K Yax, Content: DSSD, Phil Gbur, POP, Jason Devine. "Coverage Measurement" . Retrieved 26 March 2016.{{cite web}}: CS1 maint: multiple names: authors list (link)
  4. https://www.census.gov/prod/2001pubs/c2kbr01-2.pdf
  5. https://www.census.gov/prod/2004pubs/wp-02.pdf [ bare URL PDF ]
  6. "Direct and Indirect Standardization of Mortality Rates". Archived from the original on 3 April 2016. Retrieved 26 March 2016.
  7. examples of standardization

Further reading