For broader coverage of this topic, see Thematic map.
A bivariate dot density map showing the relative concentrations of the Black and Hispanic populations in the United States in 2010.
A dot distribution map (or a dot density map or simply a dot map) is a type of thematic map that uses a point symbol to visualize the geographic distribution of a large number of related phenomena. Dot maps are a type of unit visualizations that rely on a visual scatter to show spatial patterns, especially variances in density.[1][2] The dots may represent the actual locations of individual phenomena, or be randomly placed in aggregation districts to represent a number of individuals. Although these two procedures, and their underlying models, are very different, the general effect is the same.
Valentine Seaman's map of the 1796 outbreak of yellow fever in New York City, showing disease cases by numbered dots that were analyzed in the text.
The idea of using dots to show relative density came about during the Industrial era of England and France in the 1830s and 1840s, a time when most modern types of thematic map were developed into a relatively modern form.[3] They were enabled by the increasing availability of statistical data and growing recognition of their value for scientific understanding. As with other types, the earliest inventions of the technique often went unnoticed, with later publications garnering much more fame.
It has been claimed that the first dot distribution map was created by Valentine Seaman in a 1797 article analyzing a recent outbreak of yellow fever in New York City. Although the relatively small number of case locations is not in keeping with the typical use of this technique to visualize the overall distribution of a large number of individuals, it is still noteworthy as possibly the first instance of using a map as an analytical and communication tool for social science, of spatial analysis, and of epidemiology (even though his conclusions turned out to be incorrect).[4]
de Montizon's 1830 Carte Philosophique figurant la Population de la France, the earliest known dot density map.
The earliest known district-based dot density map was created in 1830 by Armand Joseph Frère de Montizon (1788–????), a Franciscanfriar, schoolteacher, and printer.[5] It is a relatively simple map of population by département (administrative district) in France, with each dot representing 10,000 individuals.[6] The map appears to have been drawn using the same technique practiced for the next two centuries and still performed by computer today: a number of dots, calculated from the total population of each department, is spread randomly across each department. The result is an intuitive visual display of population density, as higher population levels within an administrative border exhibit a closer, denser pattern of dots. Since the dots are evenly spaced, it is evident that they do not represent the actual locations of where people live within a department. This is an example of an ecological fallacy, where a value for an area generalizes all within that area to exhibit that value.[7]
von Mentzer's 1859 dot density map of Sweden and Norway, probably the first fully-developed representative dot density map.
Although Montizon's map was the first published dot map of its type, his innovation had no effect on practice for nearly 30 years until the district-based dot density map was reinvented in 1859 in a map of the population distribution of Sweden and Norway by Thure Alexander von Mentzer, a Swedish Army officer.[8] The dots in his map (each representing 200 residents) appear to have been based on the 1855 Census, but clearly show adjustments based on additional knowledge of population distribution.[9]
Shapter's 1849 map of the 1832-1834 Cholera outbreak in Exeter, with different symbols for cases in each year.
The point feature map was also reinvented in the mid-19th century, with epidemiology again being a leading driver, especially the search for the cause of cholera, which was recognized as occurring in clear geographic patterns.[10] Among the variety of maps created between 1820 and 1850 are some showing the locations of every case in a region. A notable example was an 1849 map by Thomas Shapter in his history of the 1832-1834 Cholera outbreak in Exeter.[11] The map is innovative in using different point symbols to represent the cases in each of the three years. Shapter did not go so far as identifying the cause of the disease clusters he observed, his map was influential; John Snow later cited it as an inspiration for his own work.
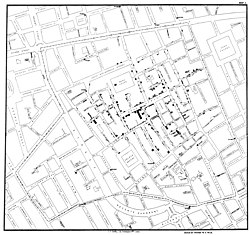
Original map by John Snow showing the clusters of cholera cases in the London epidemic of 1854. The pump is located at the intersection of Broad Street and Little Windmill Street.
When a large outbreak occurred in London in 1854, Dr. John Snow collected data about the individual cases, especially their location in Soho, using nascent methods of spatial analysis and contact tracing to conclude that contaminated water was the disease vector, and successfully had the source shut off.[12] The map that accompanied his 1855 report showed individual cases, stacked at each house location, clearly showing a concentration around the Broad Street Pump as well as gaps in locations that had other water sources.[13] The map is now hailed as revolutionary; although its role in the investigation itself and its effect on settling the debate over the cause of the disease is often overstated,[14] it does deserve recognition for Snow's insight that a map was the most effective tool for communicating the spatial patterns of the disease.
In later years, dot maps do not appear to have been as prolific as other types of thematic maps, possibly due to the time needed to create them. Many were seen as an accomplishment worthy of academic publication on their own.[15] A hybrid technique emerged in early 20th century maps of population density, using representative dots in rural areas with proportional circles to represent major cities. The dot density method became standardized during this period, and design guidelines developed,[16] such that the technique could be taught in the cartography textbooks of the mid-20th century.[17][18]
Geographic information systems have made the generation of dot density maps relatively easy by automating the placement of the individual dots, although the results are often less satisfactory than those that were manually crafted. A significant technological advance has been the availability of very large datasets, such as millions of geocoded social media posts, and innovations in how to visualize them. The resultant maps are able to show detailed patterns of geographic distributions.
Animated dot density map of COVID-19 cases in Connecticut between March 21 and May 21 2020.
Recent advancements in dot maps include using dasymetric mapping techniques to more accurately place dots within zones,[19] scaling dot maps to show different rates of dots per person at different zoom levels,[20] and using temporal interpolation to animate dot maps over time[2]
Types of dot maps
Two very different types of dot maps have been developed, often leading to some confusion in terminology. In fact, many cartographers have suggested that they not be grouped into a single type of thematic map. Although they use very different techniques, based on very different data sources, with a different semantics in the result, the general purpose is the same: to visualize the geographic distribution of a group phenomenon (i.e. a large number of individuals).
One-to-one (point feature)
A one-to-one dot distribution map, identifying concentrations of homicides in Washington, D.C.
A one-to-one dot map displays a large number of point symbols representing the locations individual occurrences of a phenomenon. Many kinds of maps display geographic features as point symbols, such as cities; this category only applies to those that show a large number of instances, each portrayed anonymously (e.g. not labeled), so that attention is focused on the overall distribution rather than on individuals. For many years, this approach has been a core part of the field of crime mapping, in addition to its original use in epidemiology. It has become especially popular in the recent era of big data, such as mapping millions of geotagged social media posts or cell phone locations, although these maps have raised concerns over privacy.[21][22][23]
Various terms for this technique have been proposed to distinguish it from the other approach, such as nominal point map, point feature map, and pin map.[24][25]:135 Another suggestion is to use the term dot distribution map exclusively for this type (with dot density reserved for the other type), although this does not clarify the confusion, since both maps aim to show distribution and density.
One-to-many (representative point)
Representative dot density map of Acres of Harvested Wheat in Illinois in 2012, using county-level aggregate data.
In a one-to-many dot map, each dot on the map does not represent an individual instance, but rather typifies the presence of one or more individuals derived from aggregate data. The data are based on predefined geographical districts (e.g., counties, provinces, countries, census tracts), into which data about individuals have been aggregated as statistical summary variables, such as total population. That is, it is the same type of dataset used for choropleth maps and many proportional symbol maps. Unlike a choropleth map, the only valid variable used for a dot density map is the total count of the individuals.[24] Once a dot value (the number of individuals represented by each dot) is chosen, the number of dots needed in each district can be calculated, and the dots are randomly distributed across the district. This distribution of a total over area gives the visual impression of population density.[18]
Most cartography textbooks prefer to use the term dot density map or dot map only for one-to-many dot maps.[24][26][18] The term one-to-many has become problematic as interactive maps have been developed that use this method but with each dot representing a single person,[27] although this is often criticized for creating the illusion of knowing the location of each individual. Other terms that have been suggested to distinguish this technique include representative dot map, district-based dot map, choropleth dot map, and point spread map.[28]
Representative dot design
The design of either type of dot map involves balancing the design of the individual point symbol (especially its size) with the spacing between the points. In the one-to-one dot map, the latter is fixed by the distribution of the individuals and the map scale, but in the representative dot map, it is also influenced by the cartographer's choice of dot value, the number of individuals that each dot represents. It has long been recognized that these choices are interdependent, with several competing considerations:[18][24]
Increasing the size of point symbols will reduce the spacing between them, even with a constant distribution.
For any dot size and distribution, at some level of density, the individual points coalesce into a solid mass. Once this happens, any higher density cannot be discerned.
Larger point symbols are easier to see than smaller symbol, but coalesce at relatively lower densities.
Smaller dot values (i.e., more dots) show much finer details in the geographic distribution than large dot values, and increase the chances that the smallest districts have at least a few dots, but also coalesce at relatively lower densities.
The ideal balance of these factors occurs when the dots start to coalesce in the most dense areas, the individual dots are just large enough to be seen individually, and the dot value is small enough that even the districts with the lowest values have more than one dot. In 1949, J. Ross Mackay developed a set of guidelines for calculating this balance of dot size and dot value, including an innovative nomograph, which became the standard for the profession.[16] Since then, improving technology in generating dots and printing or displaying them has led to modifications of the balance calculation, which has been automated in most GIS software.[29]
However, this ideal range of apparent densities places some restrictions on the phenomena that can be mapped. If the range of densities is too low (say, a ratio between the most sparse and most dense of less than about 1:10), the map will appear too consistent to be informative. If the range of densities is too high (a ratio of more than 1:1000), too many districts will be solid unless the dot value is decreased so much as to become invisible.[24] Design technology improvements have helped alleviate this restriction somewhat, such as the use of translucent dots, which can show a distinction between densities where dots are just coalescing and higher densities where many layers of dots are on top of one another.[27] However, this has the side effect of making individual dots very faint.
This one-to-one dot map shows the 1,300 immigrants from Germany and Switzerland in Salt Lake City, Utah in 1900 in black, compared to all 55,000 residents shown in gray. Note the blocks in which residents of the same household have been spread into distinct points using the "Grid" renderer in QGIS.
Another design challenge can happen with the one-to-one type of map when multiple points occur at the same location, giving a false impression of lower density (i.e., looking like one dot instead of many). While many users of GIS software do not account for this problem, several automated algorithms have been developed to mitigate it, usually based on the solution developed in the early maps of Shapter and Snow of spreading the points out slightly so that they are distinct but still appear densely packed.[30]
Criticisms
One concern with dot density that has been studied at length is how accurately map readers can interpret the apparent density. Since the 1930s, repeated studies have shown a tendency to underestimate the density of an area shown as dots.[31]
Another criticism is that aggregate district data has inherent problems that can lead to the same misinterpretations as other types of thematic maps based on this kind of data, such as choropleth maps, including the ecological fallacy and the modifiable areal unit problem. In fact, the dot technique can exacerbate the problem, because the detailed look of the individual dots gives the illusion of more detailed data than the solid color of a choropleth. Furthermore, map readers can easily interpret the dots, especially in sparse areas, as the locations of actual settlements.[24]
As with choropleth maps, the modifiable areal unit problem can be mitigated someone by using districts that are as small as is feasible, although this can lead to an increase in the extreme density variation problem discussed above. Another solution in common with choropleth mapping is the dasymetric technique. In the dot density application, external knowledge about the distribution of the phenomenon is incorporated to adjust the dot placement. The simplest approach is the binary method, creating a layer of land known to have no individuals (in the case of human population, this might include features such as water bodies and government-owned land), and using it as a mask to exclude dots from being drawn there, forcing them to be placed more densely in the remaining area.[24] Traditionally, a more subtle approach was taken when manually placing the dots, concentrating them in parts of the district where the density was known to be higher, leading to the appearance of the density varying gradually rather than changing abruptly at district boundaries.[18] Automated algorithms have been developed that mimic this technique, using ancillary information such as city point locations to alter the distribution of dots across each district, although they are not widely implemented in GIS software.[32]
↑ Johnson, Steven (2007). The Ghost Map: The story of London's most terrifying epidemic-- and how it changed science, cities, and the modern world. Riverhead Books.
↑ Kraak, Menno-Jan; Ormeling, Ferjan (2003). Cartography: Visualization of Spatial Data (2nded.). Prentice Hall. pp.116–121. ISBN978-0-13-088890-7.
↑ T. Slocum, R. McMaster, F. Kessler, H. Howard (2009). Thematic Cartography and Geovisualization, Third Edn, page 252. Pearson Prentice Hall: Upper Saddle River, NJ., pp.318-324
Racial Dot Map: detailed interactive district-based dot map of race and hispanic status from the 2010 Census with a 1:1 dot value
OmniSci Tweetmap: a 1:1 dot map of geocoded twitter postings that can be filtered by keywords
This page is based on this Wikipedia article Text is available under the CC BY-SA 4.0 license; additional terms may apply. Images, videos and audio are available under their respective licenses.