Clark defeated Pierre Trudeau in the 1979 election, but did not win a majority in the House of Commons of Canada. He formed a minority government, but it proved to be short-lived. The Clark government fell on a budget vote in December, 1979, triggering the 1980 election. Trudeau won that election and returned to office with a majority government. Clark became the Leader of the Opposition, but in 1983 he lost a leadership challenge to Brian Mulroney, who took over as leader of the Progressive Conservatives.
Clark again became leader of the party in 1998, and led the Progressive Conservatives in the 2000 election. The party lost seats in the House of Commons, remaining in fifth place. Clark led the party in the House for three years, until he announced his resignation in 2002. Peter Mackay succeeded him as leader of the Progressive Conservatives in 2003.
Clark stood for election to the House of Commons of Canada eight times. He was elected each time, often by substantial majorities. He also stood once for election to the Alberta Legislative Assembly but was not elected.
Summary
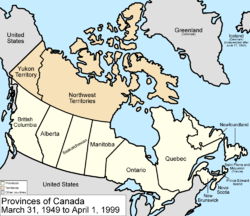
Canada had ten provinces and two territories throughout Clark's time as Prime Minister.
Clark ranks twentieth out of twenty-three prime ministers for time in office, serving one term of 273 days.[1]
Clark was active in the Progressive Conservative Party from a young age.[2] In 1976, he entered the leadership convention called to replace the outgoing leader, Robert Stanfield. Clark won the leadership against a crowded field, including Brian Mulroney.
In the 1979 election, Clark defeated Prime Minister Trudeau and the Liberals, but did not win a majority in the House of Commons. He formed a minority government but it proved to be short-lived. The Liberals and the New Democratic Party voted together to defeat the proposed budget in December, 1979, with the Social Credit members abstaining. The defeat on a budget measure triggered an immediate election, which Trudeau won, returning to power with a majority government.[3]
Clark returned to the position as Leader of the Official Opposition, but also faced criticism from within his own party. In 1983, there was a leadership review at the Progressive Conservative party convention. Although Clark won an approval of 66.9%, he determined that he needed a stronger mandate from the party. He resigned as leader, while announcing that he would again run for the leadership and seek the party's approval. At the leadership convention held in the summer of 1983, Clark was defeated by Mulroney.[2]
Although defeated for the leadership, Clark continued to sit in the Commons. When Mulroney led the Progressive Conservatives to a majority government in the general election of 1984, he appointed Clark to his Cabinet, first as Minister of External Affairs (1984-1991), and then as President of the Privy Council (1991-1993), with responsibility for constitutional affairs.[2] Clark announced his retirement before the 1993 general election, when the Progressive Conservatives were reduced from a majority government to only two seats in the Commons.
In 1998, Clark was again elected as leader of the Progressive Conservative Party, which had never recovered from the 1993 defeat. He led the party in the 2000 election. The party lost seats in the House of Commons, remaining in fifth place. He led the party in the Commons until announcing his second retirement, in 2003.
Clark stood for election to the House of Commons for four different ridings. Three were in Alberta and one was in Nova Scotia, in a by-election after he was elected party leader in 2000. He was elected each time, often by substantial majorities. He served a total of 24 years, 9 months, and 11 days in the House of Commons.[4]
Prior to his first election to the House of Commons, Clark stood for election to the Legislative Assembly of Alberta in 1967, but was defeated.
Federal general elections: 1979, 1980, and 2000
Clark led the Progressive Conservatives in three general elections. He won a minority government in the general election of 1979, but was defeated in the 1980 election. In the 2000 election, the Progressive Conservatives remained in fifth place in the Commons after the election.
1 Leader of the Opposition when election was called; Prime Minister after election. 2 Prime Minister when election was called; Leader of the Opposition after the election. 3 Table does not include parties which received votes but did not elect any members.
Clark's government fell on a budget vote in December, 1979, triggering the general election of 1980. Trudeau led the Liberals in the resulting election and was returned to power with a majority. Clark became the Leader of the Opposition.
Canadian Federal Election, 1980 - Parties, Leaders, Seats Won and Popular Vote
1 Leader of the Opposition when election was called; Prime Minister after election. 2 Prime Minister when election was called; Leader of the Opposition after the election. 3 Table does not include parties which received votes but did not elect any members.
Clark became leader of the Progressive Conservatives for a second time in 1998 and led them in the general election of 2000. The party lost seats and remained in fifth place in the Commons.
Canadian Federal Election, 2000 - Parties, Leaders, Seats Won and Popular Vote
1 Prime Minister when election was called; Prime Minister after election. 2 Leader of the Opposition when election was called; Leader of the Opposition after the election. 3 Table does not include parties which received votes but did not elect any members.
Federal constituency elections, 1972 to 1988; 2000
Clark stood for election to the House of Commons eight times, starting with the general election of 1972. He was elected all eight times, from three different ridings in Alberta and one Nova Scotia riding.
This was the only time when a former prime minister and leader of the opposition (Clark) and a future leader of the opposition (Manning) were candidates in the same riding election.
2000 Federal By-Election: Kings–Hants
The 2000 by-election was triggered by the resignation of the incumbent Member of Parliament, Scott Brison, on July 24, 2000, to open a seat for Clark to re-enter the Commons.
Federal By-Election, September 11, 2000: Kings—Hants, Nova Scotia
Progressive Conservative Party Leadership Conventions and Reviews: 1976 to 1983, 1997
Clark ran in three leadership conventions and two leadership reviews. He was elected leader of the Progressive Conservative Party twice (1976, 1997), and defeated once (1983). After his victory in 1976, he succeeded Robert L. Stanfield as party leader. At the 1983 leadership convention, Clark was defeated by Brian Mulroney, who became leader. In 1998, he succeeded Jean Charest as party leader. Upon his retirement from politics in 2003, he was succeeded by Peter MacKay.
Clark also passed two leadership reviews after the 1980 general election, at the conventions of 1981 and 1983.
When Robert Stanfield announced his resignation as party leader in 1976, Clark was one of a crowded field of candidates in the leadership convention. He won the leadership on the fourth ballot.
Progressive Conservative Leadership Convention, February 22, 1976 Voting results by ballot
The Progressive Conservative party held leadership reviews of Clark's leadership at the conventions of 1981 and 1983. At the 1981 convention, 66.5% of the delegates voted in favour of Clark, with 33.5% voting against him. Clark continued on as leader, but at the 1983 convention, a similar review was held. Clark won 66.9% of the delegates, with 33.1% voting against him. He concluded that this level of support was not sufficient, and announced his resignation as leader, triggering an election convention, while also announcing that he planned to contest the leadership again at the convention.
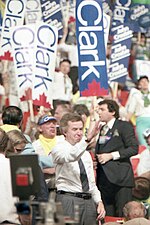
Clark at the 1983 leadership convention.Mulroney at the 1983 leadership convention (photo by Alasdair Roberts).
The party held the leadership convention in the early summer of 1983. Clark was defeated on the fourth ballot by Brian Mulroney, who succeeded him as party leader.
Progressive Conservative Leadership Convention, June 11, 1983 Voting results by ballot
In 1998, the Progressive Conservative Party held its leadership election under a new system. Instead of a convention with delegates, each Progressive Conservative constituency association had 100 points in the leadership election. Every member of the party could vote at the constituency level, to determine the allocation of the points for each constituency. A candidate had to win a majority of points (not necessarily votes) to win the leadership. Clark came out of retirement and won the leadership on the second round of ballots.
This page is based on this Wikipedia article Text is available under the CC BY-SA 4.0 license; additional terms may apply. Images, videos and audio are available under their respective licenses.