The ionosphere is the ionized part of the upper atmosphere of Earth, from about 48 km (30 mi) to 965 km (600 mi) above sea level, a region that includes the thermosphere and parts of the mesosphere and exosphere. The ionosphere is ionized by solar radiation. It plays an important role in atmospheric electricity and forms the inner edge of the magnetosphere. It has practical importance because, among other functions, it influences radio propagation to distant places on Earth. Travel through this layer also impacts GPS signals, resulting in effects such as deflection in their path and delay in the arrival of the signal.

The thermosphere is the layer in the Earth's atmosphere directly above the mesosphere and below the exosphere. Within this layer of the atmosphere, ultraviolet radiation causes photoionization/photodissociation of molecules, creating ions; the thermosphere thus constitutes the larger part of the ionosphere. Taking its name from the Greek θερμός meaning heat, the thermosphere begins at about 80 km (50 mi) above sea level. At these high altitudes, the residual atmospheric gases sort into strata according to molecular mass. Thermospheric temperatures increase with altitude due to absorption of highly energetic solar radiation. Temperatures are highly dependent on solar activity, and can rise to 2,000 °C (3,630 °F) or more. Radiation causes the atmospheric particles in this layer to become electrically charged, enabling radio waves to be refracted and thus be received beyond the horizon. In the exosphere, beginning at about 600 km (375 mi) above sea level, the atmosphere turns into space, although, by the judging criteria set for the definition of the Kármán line (100 km), most of the thermosphere is part of space. The border between the thermosphere and exosphere is known as the thermopause.

Space weather is a branch of space physics and aeronomy, or heliophysics, concerned with the varying conditions within the Solar System and its heliosphere. This includes the effects of the solar wind, especially on the Earth's magnetosphere, ionosphere, thermosphere, and exosphere. Though physically distinct, space weather is analogous to the terrestrial weather of Earth's atmosphere. The term "space weather" was first used in the 1950s and popularized in the 1990s. Later, it prompted research into "space climate", the large-scale and long-term patterns of space weather.

A geomagnetic storm, also known as a magnetic storm, is a temporary disturbance of the Earth's magnetosphere caused by a solar wind shock wave.

A whistler is a very low frequency (VLF) electromagnetic (radio) wave generated by lightning. Frequencies of terrestrial whistlers are 1 kHz to 30 kHz, with maximum frequencies usually at 3 kHz to 5 kHz. Although they are electromagnetic waves, they occur at audio frequencies, and can be converted to audio using a suitable receiver. They are produced by lightning strikes where the impulse travels along the Earth's magnetic field lines from one hemisphere to the other. They undergo dispersion of several kHz due to the slower velocity of the lower frequencies through the plasma environments of the ionosphere and magnetosphere. Thus they are perceived as a descending tone which can last for a few seconds. The study of whistlers categorizes them into Pure Note, Diffuse, 2-Hop, and Echo Train types.

Balfour Stewart was a Scottish physicist and meteorologist.

A Birkeland current is a set of electrical currents that flow along geomagnetic field lines connecting the Earth's magnetosphere to the Earth's high latitude ionosphere. In the Earth's magnetosphere, the currents are driven by the solar wind and interplanetary magnetic field (IMF) and by bulk motions of plasma through the magnetosphere. The strength of the Birkeland currents changes with activity in the magnetosphere. Small scale variations in the upward current sheets accelerate magnetospheric electrons which, when they reach the upper atmosphere, create the Auroras Borealis and Australis.
A sudden ionospheric disturbance (SID) is any one of several ionospheric perturbations, resulting from abnormally high ionization/plasma density in the D region of the ionosphere and caused by a solar flare and/or solar particle event (SPE). The SID results in a sudden increase in radio-wave absorption that is most severe in the upper medium frequency (MF) and lower high frequency (HF) ranges, and as a result often interrupts or interferes with telecommunications systems.
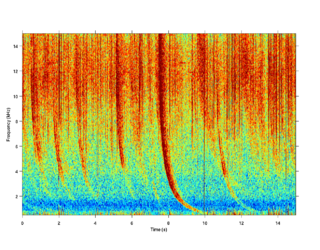
A radio atmospheric signal or sferic is a broadband electromagnetic impulse that occurs as a result of natural atmospheric lightning discharges. Sferics may propagate from their lightning source without major attenuation in the Earth–ionosphere waveguide, and can be received thousands of kilometres from their source. On a time-domain plot, a sferic may appear as a single high-amplitude spike in the time-domain data. On a spectrogram, a sferic appears as a vertical stripe that may extend from a few kHz to several tens of kHz, depending on atmospheric conditions.

Solar cycle 24 is the most recently completed solar cycle, the 24th since 1755, when extensive recording of solar sunspot activity began. It began in December 2008 with a minimum smoothed sunspot number of 2.2, and ended in December 2019. Activity was minimal until early 2010. It reached its maximum in April 2014 with a 23 months smoothed sunspot number of 81.8. This maximum value was substantially lower than other recent solar cycles, down to a level which had not been seen since cycles 12 to 15 (1878-1923).
This is an index to articles about terms used in discussion of radio propagation.
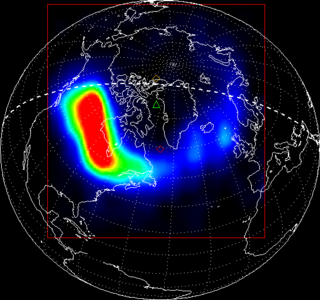
Ionospheric storms are storms which contain varying densities of energised electrons in the ionosphere as produced from the Sun. Ionospheric storms are caused by geomagnetic storms. They are categorised into positive and negative storms, where positive storms have a high density of electrons and negative storms contain a lower density. The total electron content (TEC) is used to measure these densities, and is a key variable used in data to record and compare the intensities of ionospheric storms.

A substorm, sometimes referred to as a magnetospheric substorm or an auroral substorm, is a brief disturbance in the Earth's magnetosphere that causes energy to be released from the "tail" of the magnetosphere and injected into the high latitude ionosphere. Visually, a substorm is seen as a sudden brightening and increased movement of auroral arcs. Substorms were first described in qualitative terms by Kristian Birkeland which he called polar elementary storms. Sydney Chapman used the term substorm about 1960 which is now the standard term. The morphology of aurora during a substorm was first described by Syun-Ichi Akasofu in 1964 using data collected during the International Geophysical Year.

The Institute for Space Applications and Remote Sensing (ISARS/NOA) was a research institute in Greece with expertise in multidisciplinary space and environmental sciences. It was an independent research Institute of the National Observatory of Athens (NOA) until 2012 when it was merged with the Institute of Astronomy and Astrophysics to a single unit entitled Institute for Astronomy, Astrophysics, Space Applications and Remote Sensing (IAASARS). Member scientists of all its research groups have broad knowledge of Space Science and Earth observation techniques and their applications. They collaborate with other research groups in Europe and United States, and have been internationally recognized through editorship in scientific journals, invited talks at international conferences, invited review papers in top journals, high rate of citations and coordination of EU-funded research projects.
The impact of the solar wind onto the magnetosphere generates an electric field within the inner magnetosphere - the convection field. Its general direction is from dawn to dusk. The co-rotating thermal plasma within the inner magnetosphere drifts orthogonal to that field and to the geomagnetic field Bo. The generation process is not yet completely understood. One possibility is viscous interaction between solar wind and the boundary layer of the magnetosphere (magnetopause). Another process may be magnetic reconnection. Finally, a hydromagnetic dynamo process in the polar regions of the inner magnetosphere may be possible. Direct measurements via satellites have given a fairly good picture of the structure of that field. A number of models of that field exists.
In the height region between about 85 and 200 km altitude on Earth, the ionospheric plasma is electrically conducting. Atmospheric tidal winds due to differential solar heating or due to gravitational lunar forcing move the ionospheric plasma against the geomagnetic field lines thus generating electric fields and currents just like a dynamo coil moving against magnetic field lines. That region is therefore called ionospheric dynamo region. The magnetic manifestation of these electric currents on the ground can be observed during magnetospheric quiet conditions. They are called Sq-variations and L-variations (L=lunar) of the geomagnetic field. Additional electric currents are generated by the varying magnetospheric electric convection field. These are the DP1-currents and the polar DP2-currents. Finally, a polar-ring current has been derived from the observations which depends on the polarity of the interplanetary magnetic field. These geomagnetic variations belong to the so-called external part of the geomagnetic field. Their amplitudes reach at most about 1% of the main internal geomagnetic field Bo.

The Bastille Day solar storm was a powerful solar storm on 14–16 July 2000 during the solar maximum of solar cycle 23. The storm began on the national day of France, Bastille Day. It involved a solar flare, a solar particle event, and a coronal mass ejection which caused a severe geomagnetic storm.

Solar phenomena are natural phenomena which occur within the atmosphere of the Sun. They take many forms, including solar wind, radio wave flux, solar flares, coronal mass ejections, coronal heating and sunspots.

The solar storms of August 1972 were a historically powerful series of solar storms with intense to extreme solar flare, solar particle event, and geomagnetic storm components in early August 1972, during solar cycle 20. The storm caused widespread electric- and communication-grid disturbances through large portions of North America as well as satellite disruptions. On 4 August 1972 the storm caused the accidental detonation of numerous U.S. naval mines near Haiphong, North Vietnam. The coronal mass ejection (CME)'s transit time from the Sun to the Earth is the fastest ever recorded.