Sunspots are temporary spots on the Sun's surface that are darker than the surrounding area. They are regions of reduced surface temperature caused by concentrations of magnetic flux that inhibit convection. Sunspots appear within active regions, usually in pairs of opposite magnetic polarity.[2] Their number varies according to the approximately 11-year solar cycle.
Individual sunspots or groups of sunspots may last anywhere from a few days to a few months, but eventually decay. Sunspots expand and contract as they move across the surface of the Sun, with diameters ranging from 16km (10mi)[3] to 160,000km (100,000mi).[4] Larger sunspots can be visible from Earth without the aid of a telescope.[5] They may travel at relative speeds, or proper motions, of a few hundred meters per second when they first emerge.
Indicating intense magnetic activity, sunspots accompany other active region phenomena such as coronal loops, prominences, and reconnection events. Most solar flares and coronal mass ejections originate in these magnetically active regions around visible sunspot groupings. Similar phenomena indirectly observed on stars other than the Sun are commonly called starspots, and both light and dark spots have been measured.[6]
The earliest record of sunspots is found in the Chinese I Ching, completed before 800 BC. The text describes that a dou and mei were observed in the sun, where both words refer to a small obscuration.[7] The earliest record of a deliberate sunspot observation also comes from China, and dates to 364 BC, based on comments by astronomer Gan De (甘德) in a star catalogue.[8] By 28 BC, Chinese astronomers were regularly recording sunspot observations in official imperial records.[9]
Sunspots were first observed telescopically in December 1610 by English astronomer Thomas Harriot.[13] His observations were recorded in his notebooks and were followed in March 1611 by observations and reports by Frisian astronomers Johannes and David Fabricius.[14][15] After Johannes Fabricius' death at the age of 29, his reports remained obscure and were overshadowed by the independent discoveries of and publications about sunspots by Christoph Scheiner and Galileo Galilei.[16] Galileo likely began telescopic sunspot observations around the same time as Harriot; however, Galileo's records did not start until 1612.[17] During the next decades numerous astronomers of that era participated in the pursuit of sunspots. One of these was the famous astronomer Johannes Hevelius who recorded 19 sunspot groups during the period of the early Maunder Minimum (1653-1679) in the book Machina Coelestis.[18]
In the early 19th century, William Herschel was one of the first to hypothesize a connection of sunspots with temperatures on Earth and believed that certain features of sunspots would indicate increased heating on Earth.[19] During his recognition of solar behavior and hypothesized solar structure, he inadvertently picked up the relative absence of sunspots from July 1795 to January 1800 and was perhaps the first to construct a past record of observed or missing sunspots. From this he found that the absence of sunspots coincided with high wheat prices in England. The president of the Royal Society commented that the upward trend in wheat prices was due to monetary inflation.[20] Years later scientists such as Richard Carrington in 1865 and John Henry Poynting in 1884 tried and failed to find a connection between wheat prices and sunspots, and modern analysis finds that there is no statistically significant correlation between wheat prices and sunspot numbers.[21]
Physics
Morphology
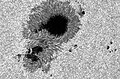
A decaying sunspot shown over the course of two hours. The umbra is separated into two pieces within the penumbra by a light bridge. Solar pores are also visible to the left of the penumbra.
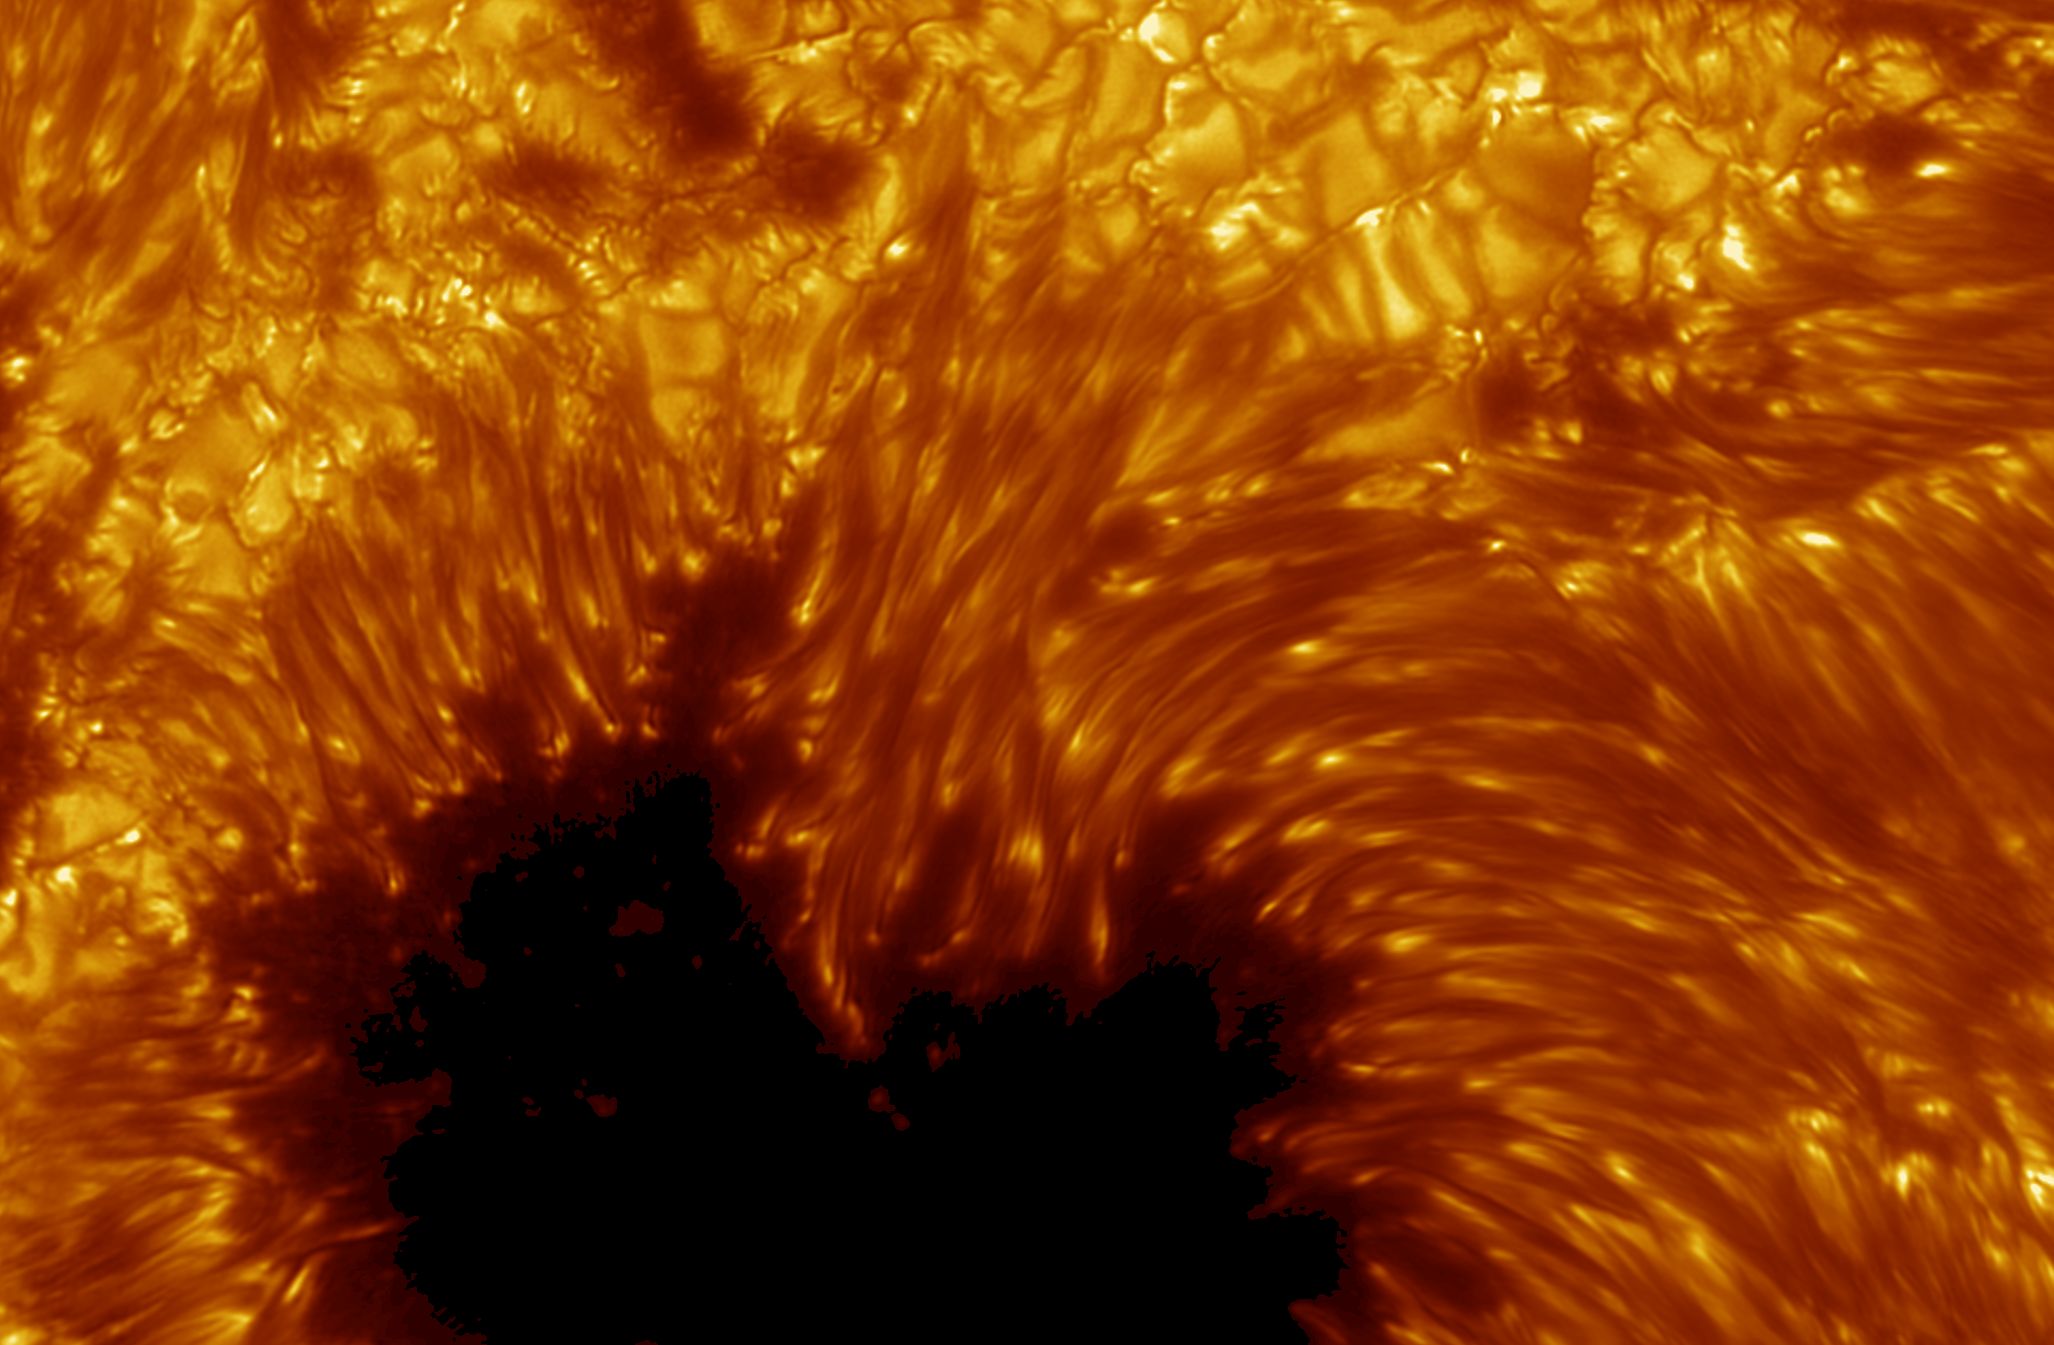
Sunspots have two main structures: a central umbra and a surrounding penumbra. The umbra is the darkest region of a sunspot and is where the magnetic field is strongest and approximately vertical, or normal, to the Sun's surface, or photosphere. The umbra may be surrounded completely or only partially by a brighter region known as the penumbra.[23] The penumbra is composed of radially elongated structures known as penumbral filaments and has a more inclined magnetic field than the umbra.[24] Within sunspot groups, multiple umbrae may be surrounded by a single, continuous penumbra.[25]
The temperature of the umbra is roughly 3000–4500K, in contrast to the surrounding material at about 5780K, leaving sunspots clearly visible as dark spots. This is because the luminance of a heated black body (closely approximated by the photosphere) at these temperatures varies greatly with temperature. Isolated from the surrounding photosphere, a single sunspot would shine brighter than the full moon, with a crimson-orange color.[26]
In some forming and decaying sunspots, relatively narrow regions of bright material appear penetrating into or completely dividing an umbra. These formations, referred to as light bridges, have been found to have a weaker, more tilted magnetic field compared to the umbra at the same height in the photosphere. Higher in the photosphere, the light bridge magnetic field merges and becomes comparable to that of the umbra. Gas pressure in light bridges has also been found to dominate over magnetic pressure, and convective motions have been detected.[22]
The Wilson effect implies that sunspots are depressions on the Sun's surface.[27]
Lifecycle
The emergence and evolution of a sunspot group over a period of two weeks
The appearance of an individual sunspot may last anywhere from a few days to a few months, though groups of sunspots and their associated active regions tend to last weeks or months. Sunspots expand and contract as they move across the surface of the Sun, with diameters ranging from 16km (10mi)[3] to 160,000km (100,000mi).[4]
Formation
Although the details of sunspot formation are still a matter of ongoing research, it is widely understood that they are the visible manifestations of magnetic flux tubes in the Sun's convective zone projecting through the photosphere within active regions.[28] Their characteristic darkening occurs due to this strong magnetic field inhibiting convection in the photosphere. As a result, the energy flux from the Sun's interior decreases, and with it, surface temperature, causing the surface area through which the magnetic field passes to look dark against the bright background of photospheric granules.[29]
Sunspots initially appear in the photosphere as small darkened spots lacking a penumbra. These structures are known as solar pores.[30] Over time, these pores increase in size and move towards one another. When a pore gets large enough, typically around 3,500km (2,000mi) in diameter, a penumbra will begin to form.[28]
Decay
Magnetic pressure should tend to remove field concentrations, causing the sunspots to disperse, but sunspot lifetimes are measured in days to weeks. In 2001, observations from the Solar and Heliospheric Observatory (SOHO) using sound waves traveling below the photosphere (local helioseismology) were used to develop a three-dimensional image of the internal structure below sunspots; these observations show that a powerful downdraft lies beneath each sunspot, forms a rotating vortex that sustains the concentrated magnetic field.[31]
Solar cycles last typically about eleven years, varying from just under 10 to just over 12 years. Over the solar cycle, sunspot populations increase quickly and then decrease more slowly. The point of highest sunspot activity during a cycle is known as solar maximum, and the point of lowest activity as solar minimum. This period is also observed in most other solar activity and is linked to a variation in the solar magnetic field that changes polarity with this period.[32]
Early in the cycle, sunspots appear at higher latitudes and then move towards the equator as the cycle approaches maximum, following Spörer's law. Spots from two sequential cycles co-exist for several years during the years near solar minimum. Spots from sequential cycles can be distinguished by direction of their magnetic field and their latitude.[33]
The Wolf number sunspot index counts the average number of sunspots and groups of sunspots during specific intervals. The 11-year solar cycles are numbered sequentially, starting with the observations made in the 1750s.[34]
George Ellery Hale first linked magnetic fields and sunspots in 1908.[35] Hale suggested that the sunspot cycle period is 22years, covering two periods of increased and decreased sunspot numbers, accompanied by polar reversals of the solar magnetic dipole field. Horace W. Babcock later proposed a qualitative model for the dynamics of the solar outer layers. The Babcock Model explains that magnetic fields cause the behavior described by Spörer's law, as well as other effects, which are twisted by the Sun's rotation.[36]
Sunspot numbers also change over long periods. For example, during the period known as the modern maximum from 1900 to 1958 the solar maxima trend of sunspot count was upwards; for the following 60 years the trend was mostly downwards.[37] Overall, the Sun was last as active as the modern maximum over 8,000 years ago.[38]
Sunspot number is correlated with the intensity of solar radiation over the period since 1979, when satellite measurements became available. The variation caused by the sunspot cycle to solar output is on the order of 0.1% of the solar constant (a peak-to-trough range of 1.3W·m−2 compared with 1366W·m−2 for the average solar constant).[39][40]
400-year history of sunspot numbers, showing Maunder and Dalton minima, and the Modern Maximum (left) and 11,000-year sunspot reconstruction showing a downward trend over 2000 BC – 1600 AD followed by the recent 400 year uptrend
The daily sunspot number from 1945 to 2017, and its power spectrum. There are two prominent peaks corresponding to its 11-year cycle and its 27-day cycle due to solar rotation.
Sunspots are observed with land-based and Earth-orbiting solar telescopes. These telescopes use filtration and projection techniques for direct observation, in addition to various types of filtered cameras. Specialized tools such as spectroscopes and spectrohelioscopes are used to examine sunspots and sunspot areas. Artificial eclipses allow viewing of the circumference of the Sun as sunspots rotate through the horizon.[42]
Since looking directly at the Sun with the naked eye permanently damages human vision, amateur observation of sunspots is generally conducted using projected images, or directly through protective filters. Small sections of very dark filter glass, such as a #14 welder's glass, are effective. A telescope eyepiece can project the image, without filtration, onto a white screen where it can be viewed indirectly, and even traced, to follow sunspot evolution. Special purpose hydrogen-alpha narrow bandpass filters and aluminum-coated glass attenuation filters (which have the appearance of mirrors due to their extremely high optical density) on the front of a telescope provide safe observation through the eyepiece.[43]
Application
Due to their correlation with other kinds of solar activity, sunspots can be used to help predict space weather, the state of the ionosphere, and conditions relevant to short-waveradio propagation or satellite communications. High sunspot activity is celebrated by members of the amateur radio community as a harbinger of excellent ionospheric propagation conditions that greatly increase radio range in the HF bands. During peaks in sunspot activity, worldwide radio communication can be achieved on frequencies as high as the 6-meter VHF band.[44]
Solar activity (and the solar cycle) have been implicated as a factor in global warming. The first possible example of this is the Maunder Minimum period of low sunspot activity which occurred during the Little Ice Age in Europe.[45] However, detailed studies from multiple paleoclimate indicators show that the lower northern hemisphere temperatures in the Little Ice Age began while sunspot numbers were still high before the start of the Maunder Minimum, and persisted until after the Maunder Minimum had ceased. Numerical climate modelling indicates that volcanic activity was the main driver of the Little Ice Age.[46]
Sunspots themselves, in terms of the magnitude of their radiant-energy deficit, have a weak effect on solar flux.[47] The total effect of sunspots and other magnetic processes in the solar photosphere is an increase of roughly 0.1% in brightness of the Sun in comparison with its brightness at the solar-minimum level. This is a difference in total solar irradiance at Earth over the sunspot cycle of close to . Other magnetic phenomena which correlate with sunspot activity include faculae and the chromospheric network.[48] The combination of these magnetic factors mean that the relationship of sunspot numbers to Total Solar Irradiance (TSI) over the decadal-scale solar cycle, and their relationship for century timescales, need not be the same. The main problem with quantifying the longer-term trends in TSI lies in the stability of the absolute radiometry measurements made from space, which has improved in recent decades but remains a problem.[49][50] Analysis shows that it is possible that TSI was actually higher in the Maunder Minimum compared to present-day levels, but uncertainties are high, with best estimates in the range with a uncertainty range of .[51]
Sunspots, with their intense magnetic field concentrations, facilitate the complex transfer of energy and momentum to the upper solar atmosphere. This transfer occurs through a variety of mechanisms, including generated waves in the lower solar atmosphere[52] and magnetic reconnection events.[53]
In 1947, G. E. Kron proposed that starspots were the reason for periodic changes in brightness on red dwarfs.[6] Since the mid-1990s, starspot observations have been made using increasingly powerful techniques yielding more and more detail: photometry showed starspot growth and decay and showed cyclic behavior similar to the Sun's; spectroscopy examined the structure of starspot regions by analyzing variations in spectral line splitting due to the Zeeman effect; Doppler imaging showed differential rotation of spots for several stars and distributions different from the Sun's; spectral line analysis measured the temperature range of spots and the stellar surfaces. For example, in 1999, Strassmeier reported the largest cool starspot ever seen rotating the giant K0star XX Trianguli (HD12545) with a temperature of 3,500K (3,230°C), together with a warm spot of 4,800K (4,530°C).[6][54]
See also
Hale's law – empirical law for the orientation of magnetic fields in solar active regions
Joy's law – empirical law for the distribution of sunspots in solar active regions
↑Vaquero, J.M.; Vázquez, M (2009). The Sun Recorded Through History: Scientific Data Extracted from Historical Documents vol. 361 of the series Astrophysics and Space Science Library. Vol.361. Springer, New York. doi:10.1007/978-0-387-92790-9. ISBN978-0-387-92789-3.
↑"Sunspots". NASA. 1 April 1998. Archived from the original on 3 April 2013. Retrieved 22 February 2013.
↑Löptien, Björn; Lagg, Andrà; van Noort, Michiel; Solanki, Sami K. (2018). "Measuring the Wilson depression of sunspots using the divergence-free condition of the magnetic field vector". Astronomy & Astrophysics. 619 A42. arXiv:1808.06867. Bibcode:2018A&A...619A..42L. doi:10.1051/0004-6361/201833571.
↑Solanki, Sami K.; Krivova, Natalie A. (2006). "Solar variability of possible relevance for planetary climates". Astronomy & Astrophysics Review. 125 (1–4): 25–37. Bibcode:2006SSRv..125...25S. doi:10.1007/s11214-006-9044-7.
↑Tribble, A. (2003). The Space Environment, Implications for Spacecraft Design. Princeton University Press. pp.15–18.
↑Babcock, Horace W. (1961). "The topology of the Sun's magnetic field and the 22-year cycle". The Astrophysical Journal. 133 (2): 572–587. Bibcode:1961ApJ...133..572B. doi:10.1086/147060.
↑"Solar Forcing of Climate". Climate Change 2001: Working Group I: The Scientific Basis. Archived from the original on 15 March 2005. Retrieved 10 March 2005.
"Sunspot Numbers". NOAA NGDC Solar Data Services (FTP). Retrieved 21 June 2010.[dead ftp link](To view documents see Help:FTP)
International Sunspot Number–sunspot maximum and minimum 1610–present; annual numbers 1700–present; monthly numbers 1749–present; daily values 1818–present; and sunspot numbers by north and south hemisphere. The McNish–Lincoln sunspot prediction is also included.
American sunspot numbers 1945–present
Ancient sunspot data 165 BC to 1684 AD
Group Sunspot Numbers (Doug Hoyt re-evaluation) 1610–1995
This page is based on this Wikipedia article Text is available under the CC BY-SA 4.0 license; additional terms may apply. Images, videos and audio are available under their respective licenses.


