Solar maximum

Last updated
A prediction for Sunspot Cycle 24 (2008-2020) gives a smoothed sunspot number maximum of about 66 in the Summer of 2013. Current observations make this the smallest sunspot cycle since records began in the 1750s. Solar Cycle Prediction.gif
A prediction for Sunspot Cycle 24 (2008-2020) gives a smoothed sunspot number maximum of about 66 in the Summer of 2013. Current observations make this the smallest sunspot cycle since records began in the 1750s.

Solar maximum is the regular period of greatest solar activity during the Sun's 11-year solar cycle. During solar maximum, large numbers of sunspots appear, and the solar irradiance output grows by about 0.07%. [2] On average, the solar cycle takes about 11 years to go from one solar maximum to the next, with duration observed varying from 9 to 14 years.

Contents

Three recent solar cycles Solar-cycle-data.png
Three recent solar cycles

Large solar storms often occur during solar maximum. For example, the Carrington Event, which took place a few months before the solar maximum of solar cycle 10, was the most intense geomagnetic storm in recorded history and widely considered to have been caused by an equally large solar storm. [3]

Predictions

Predictions of a future maximum's timing and strength are very difficult; predictions vary widely. There was a solar maximum in 2000. In 2006, NASA initially expected a solar maximum in 2010 or 2011, and thought that it could be the strongest since 1958. [4] However, the solar maximum was not declared to have occurred until 2014, and even then was ranked among the weakest on record. [5]

Grand solar minima and maxima

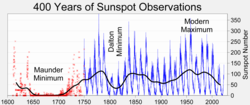
In addition to the ~11 year solar cycle, the intensity of the solar maxima can vary from cycle to cycle. When several solar cycles exhibit greater than average activity for decades or centuries, this period is labelled "Grand solar maximum". Solar cycles still occur during these grand solar maximum periods, but the intensity of those cycles is greater. Likewise, extended periods in which the solar maximum is lower than average are labeled "grand solar minima". Some researchers suggest that grand solar maxima have shown some correlation with global and regional climate changes, although others dispute this hypothesis (e.g., see Medieval Warm Period).

Following the advent of telescopic solar observation with Galileo's 1611 observations, the intensity of solar maxima is typically measured by counting numbers and size of sunspots; for periods previous to this, isotope ratios in ice cores can be used to estimate solar activity. The table below shows the approximate dates of some of the proposed solar minima in historical times.

400 year history of sunspot numbers. Sunspot Numbers.png
400 year history of sunspot numbers.
Solar minimum events and approximate dates
EventStartEnd
Homeric minimum [6] 950BC800BC
Oort minimum10401080
Medieval maximum11001250
Wolf minimum12801350
Spörer Minimum 14501550
Maunder Minimum 16451715
Dalton Minimum 17901820
Modern Maximum 19142008
Unspecified2009present

A proposed list of historical Grand minima of solar activity [7] includes also Grand minima ca. 690 AD, 360 BC, 770 BC, 1390 BC, 2860 BC, 3340 BC, 3500 BC, 3630 BC, 3940 BC, 4230 BC, 4330 BC, 5260 BC, 5460 BC, 5620 BC, 5710 BC, 5990 BC, 6220 BC, 6400 BC, 7040 BC, 7310 BC, 7520 BC, 8220 BC, 9170 BC.

See also

Related Research Articles

<span class="mw-page-title-main">Sunspot</span> Temporary phenomena on the Suns photosphere

Sunspots are phenomena on the Sun's photosphere that appear as temporary spots that are darker than the surrounding areas. They are regions of reduced surface temperature caused by concentrations of magnetic flux that inhibit convection. Sunspots appear within active regions, usually in pairs of opposite magnetic polarity. Their number varies according to the approximately 11-year solar cycle.

<span class="mw-page-title-main">Maunder Minimum</span> Period of low solar activity from 1645 to 1715

The Maunder Minimum, also known as the "prolonged sunspot minimum", was a period around 1645 to 1715 during which sunspots became exceedingly rare. During a 28-year period (1672–1699) within the minimum, observations revealed fewer than 50 sunspots. This contrasts with the typical 40,000–50,000 sunspots seen in modern times over a similar timespan.

<span class="mw-page-title-main">Solar flare</span> Eruption of electromagnetic radiation in the atmosphere of the Sun

A solar flare is an intense localized eruption of electromagnetic radiation in the Sun's atmosphere. Flares occur in active regions and are often, but not always, accompanied by coronal mass ejections, solar particle events, and other solar phenomena. The occurrence of solar flares varies with the 11-year solar cycle.

<span class="mw-page-title-main">Solar cycle</span> Periodic change in the Suns activity

The solar cycle, also known as the solar magnetic activity cycle, sunspot cycle, or Schwabe cycle, is a nearly periodic 11-year change in the Sun's activity measured in terms of variations in the number of observed sunspots on the Sun's surface. Over the period of a solar cycle, levels of solar radiation and ejection of solar material, the number and size of sunspots, solar flares, and coronal loops all exhibit a synchronized fluctuation from a period of minimum activity to a period of a maximum activity back to a period of minimum activity.

<span class="mw-page-title-main">Solar minimum</span> Regular period of least solar activity

Solar minimum is the regular period of least solar activity in the Sun's 11-year solar cycle. During solar minimum, sunspot and solar flare activity diminishes, and often does not occur for days at a time. On average, the solar cycle takes about 11 years to go from one solar minimum to the next, with duration observed varying from 9 to 14 years. The date of the minimum is described by a smoothed average over 12 months of sunspot activity, so identifying the date of the solar minimum usually can only happen 6 months after the minimum takes place.

<span class="mw-page-title-main">Wolf number</span>

The Wolf number is a quantity that measures the number of sunspots and groups of sunspots present on the surface of the Sun.

The Spörer Minimum is a hypothesized 90-year span of low solar activity, from about 1460 until 1550, which was identified and named by John A. Eddy in a landmark 1976 paper published in Science titled "The Maunder Minimum". It occurred before sunspots had been directly observed and was discovered instead by analysis of the proportion of carbon-14 in tree rings, which is strongly correlated with solar activity. It is named for the German astronomer Gustav Spörer.

The solar dynamo is a physical process that generates the Sun's magnetic field. It is explained with a variant of the dynamo theory. A naturally occurring electric generator in the Sun's interior produces electric currents and a magnetic field, following the laws of Ampère, Faraday and Ohm, as well as the laws of fluid dynamics, which together form the laws of magnetohydrodynamics. The detailed mechanism of the solar dynamo is not known and is the subject of current research.

<span class="mw-page-title-main">Solar cycle 24</span> Solar activity from December 2008 to December 2019

Solar cycle 24 is the most recently completed solar cycle, the 24th since 1755, when extensive recording of solar sunspot activity began. It began in December 2008 with a minimum smoothed sunspot number of 2.2, and ended in December 2019. Activity was minimal until early 2010. It reached its maximum in April 2014 with a 23 months smoothed sunspot number of 81.8. This maximum value was substantially lower than other recent solar cycles, down to a level which had not been seen since cycles 12 to 15 (1878-1923).

<span class="mw-page-title-main">Solar cycle 9</span> Solar activity from July 1843 to December 1855

Solar cycle 9 was the ninth solar cycle since 1755, when extensive recording of solar sunspot activity began. The solar cycle lasted 12.4 years, beginning in July 1843 and ending in December 1855. The maximum smoothed sunspot number observed during the solar cycle was 219.9, and the starting minimum was 17.6. During the solar cycle minimum transit from solar cycle 9 to solar cycle 10, there were a total of 655 days with no sunspots.

<span class="mw-page-title-main">Solar cycle 12</span> Solar activity from December 1878 to March 1890

Solar cycle 12 was the twelfth solar cycle since 1755, when extensive recording of solar sunspot activity began. The solar cycle lasted 11.3 years, beginning in December 1878 and ending in March 1890. The maximum smoothed sunspot number observed during the solar cycle was 124.4, and the starting minimum was 3.7. During the minimum transit from solar cycle 12 to 13, there were a total of 736 days with no sunspots.

<span class="mw-page-title-main">Solar cycle 13</span> Solar activity from March 1890 to January 1902

Solar cycle 13 was the thirteenth solar cycle since 1755, when extensive recording of solar sunspot activity began. The solar cycle lasted 11.8 years, beginning in March 1890 and ending in January 1902. The maximum smoothed sunspot number observed during the solar cycle was 146.5, and the starting minimum was 8.3. During the minimum transit from solar cycle 13 to 14, there were a total of 934 days with no sunspots.

<span class="mw-page-title-main">Solar cycle 14</span> Solar activity from January 1902 to July 1913

Solar cycle 14 was the fourteenth solar cycle since 1755, when extensive recording of solar sunspot activity began. The solar cycle lasted 11.5 years, beginning in January 1902 and ending in July 1913. The maximum smoothed sunspot number observed during the solar cycle was 107.1, in February 1906, and the starting minimum was 4.5. During the minimum transit from solar cycle 14 to 15, there were a total of 1023 days with no sunspots.

<span class="mw-page-title-main">Solar cycle 16</span> Solar activity from August 1923 to September 1933

Solar cycle 16 was the sixteenth solar cycle since 1755, when extensive recording of solar sunspot activity began. The solar cycle lasted 10.1 years, beginning in August 1923 and ending in September 1933. The maximum smoothed sunspot number observed during the solar cycle was 130.2, and the starting minimum was 9.4. During the minimum transit from solar cycle 16 to 17, there were a total of 568 days with no sunspots.

<span class="mw-page-title-main">Solar cycle 19</span> Solar activity from April 1954 to October 1964

Solar cycle 19 was the nineteenth solar cycle since 1755, when extensive recording of solar sunspot activity began. The solar cycle lasted 10.5 years, beginning in April 1954 and ending in October 1964. The International Geophysical Year occurred at the peak of this solar cycle.

<span class="mw-page-title-main">Solar cycle 23</span> Solar activity from August 1996 to December 2008

Solar cycle 23 was the 23rd solar cycle since 1755, when extensive recording of solar sunspot activity began. The solar cycle lasted 12.3 years, beginning in August 1996 and ending in December 2008. The maximum smoothed sunspot number observed during the solar cycle was 180.3, and the starting minimum was 11.2. During the minimum transit from solar cycle 23 to 24, there were a total of 817 days with no sunspots. Compared to the last several solar cycles, it was fairly average in terms of activity.

<span class="mw-page-title-main">Solar cycle 25</span> Predicted Sun activity 2019 to about 2030

Solar cycle 25 is the current solar cycle, the 25th since 1755, when extensive recording of solar sunspot activity began. It began in December 2019 with a minimum smoothed sunspot number of 1.8. It is expected to continue until about 2030.

Solar observation is the scientific endeavor of studying the Sun and its behavior and relation to the Earth and the remainder of the Solar System. Deliberate solar observation began thousands of years ago. That initial era of direct observation gave way to telescopes in the 1600s followed by satellites in the twentieth century.

<span class="mw-page-title-main">Solar phenomena</span> Natural phenomena within the Suns atmosphere

Solar phenomena are natural phenomena which occur within the atmosphere of the Sun. These phenomena take many forms, including solar wind, radio wave flux, solar flares, coronal mass ejections, coronal heating and sunspots.

References

  1. NASA
  2. C. D. Camp & K. K. Tung (2007). "Surface warming by the solar cycle as revealed by the composite mean difference projection" (PDF). Geophysical Research Letters. 34 (14): L14703. Bibcode:2007GeoRL..3414703C. doi: 10.1029/2007GL030207 . Retrieved 20 January 2012.
  3. "Monster radiation burst from Sun". BBC News . 14 May 2013. Retrieved 2015-01-06.
  4. "Solar Storm Warning", Science@NASA, 10 March 2006, Accessed 26 Mar. 2010
  5. "Solar Mini-Max". NASA. Retrieved 2014-12-24.
  6. Celia Martin-Puertas; Katja Matthes; Achim Brauer; Raimund Muscheler; et al. (April 2, 2012). "Regional atmospheric circulation shifts induced by a grand solar minimum". Nature Geoscience . 5 (6): 397–401. Bibcode:2012NatGe...5..397M. doi:10.1038/ngeo1460.
  7. Usoskin, Ilya G.; Solanki, Sami K.; Kovaltsov, Gennady A. (2007). "Grand minima and maxima of solar activity: new observational constraints" (PDF). Astron. Astrophys. 471 (1): 301–9. arXiv: 0706.0385 . Bibcode:2007A&A...471..301U. doi:10.1051/0004-6361:20077704. S2CID   7742132.