The NASA Advanced Supercomputing (NAS) Division is located at NASA Ames Research Center, Moffett Field in the heart of Silicon Valley in Mountain View, California. It has been the major supercomputing and modeling and simulation resource for NASA missions in aerodynamics, space exploration, studies in weather patterns and ocean currents, and space shuttle and aircraft design and development for almost forty years.
The facility currently houses the petascalePleiades, Aitken, and Electra supercomputers, as well as the terascale Endeavour supercomputer. The systems are based on SGI and HPE architecture with Intel processors. The main building also houses disk and archival tape storage systems with a capacity of over an exabyte of data, the hyperwall visualization system, and one of the largest InfiniBand network fabrics in the world.[1] The NAS Division is part of NASA's Exploration Technology Directorate and operates NASA's High-End Computing Capability (HECC) Project.[2]
History
Founding
In the mid-1970s, a group of aerospace engineers at Ames Research Center began to look into transferring aerospace research and development from costly and time-consuming wind tunnel testing to simulation-based design and engineering using computational fluid dynamics (CFD) models on supercomputers more powerful than those commercially available at the time. This endeavor was later named the Numerical Aerodynamic Simulator (NAS) Project and the first computer was installed at the Central Computing Facility at Ames Research Center in 1984.
Groundbreaking on a state-of-the-art supercomputing facility took place on March 14, 1985 in order to construct a building where CFD experts, computer scientists, visualization specialists, and network and storage engineers could be under one roof in a collaborative environment. In 1986, NAS transitioned into a full-fledged NASA division and in 1987, NAS staff and equipment, including a second supercomputer, a Cray-2 named Navier, were relocated to the new facility, which was dedicated on March 9, 1987.[3]
In 1995, NAS changed its name to the Numerical Aerospace Simulation Division, and in 2001 to the name it has today.
Industry leading innovations
NAS has been one of the leading innovators in the supercomputing world, developing many tools and processes that became widely used in commercial supercomputing. Some of these firsts include:[4]
Installed Cray's first UNIX-based supercomputer[5]
Implemented a client/server model linking the supercomputers and workstations together to distribute computation and visualization
Developed and implemented a high-speed wide area network (WAN) connecting supercomputing resources to remote users (AEROnet)
Co-developed NASA's first method for dynamic distribution of production loads across supercomputing resources in geographically distant locations (NASA Metacenter)
Implemented TCP/IP networking in a supercomputing environment
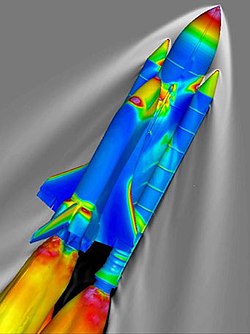
An image of the flowfield around the Space Shuttle Launch Vehicle traveling at Mach 2.46 and at an altitude of 66,000 feet (20,000m). The surface of the vehicle is colored by the pressure coefficient, and the gray contours represent the density of the surrounding air, as calculated using the OVERFLOW code.
Software development
NAS develops and adapts software in order to "complement and enhance the work performed on its supercomputers, including software for systems support, monitoring systems, security, and scientific visualization," and often provides this software to its users through the NASA Open Source Agreement (NOSA).[6]
A few of the important software developments from NAS include:
NAS Parallel Benchmarks (NPB) were developed to evaluate highly parallel supercomputers and mimic the characteristics of large-scale CFD applications.
Portable Batch System (PBS) was the first batch queuing software for parallel and distributed systems. It was released commercially in 1998 and is still widely used in the industry.
PLOT3D was created in 1982 and is a computer graphics program still used today to visualize the grids and solutions of structured CFD datasets. The PLOT3D team was awarded the fourth largest prize ever given by the NASA Space Act Program for the development of their software, which revolutionized scientific visualization and analysis of 3D CFD solutions.[3]
FAST (Flow Analysis Software Toolkit) is a software environment based on PLOT3D and used to analyze data from numerical simulations which, though tailored to CFD visualization, can be used to visualize almost any scalar and vector data. It was awarded the NASA Software of the Year Award in 1995.[7]
INS2D and INS3D are codes developed by NAS engineers to solve incompressible Navier-Stokes equations in two- and three-dimensional generalized coordinates, respectively, for steady-state and time varying flow. In 1994, INS3D won the NASA Software of the Year Award.[3]
Cart3D is a high-fidelity analysis package for aerodynamic design which allows users to perform automated CFD simulations on complex forms. It is still used at NASA and other government agencies to test conceptual and preliminary air- and spacecraft designs.[8] The Cart3D team won the NASA Software of the Year award in 2002.
OVERFLOW (Overset grid flow solver) is a software package developed to simulate fluid flow around solid bodies using Reynolds-averaged, Navier-Stokes CFD equations. It was the first general-purpose NASA CFD code for overset (Chimera) grid systems and was released outside of NASA in 1992.
Chimera Grid Tools (CGT) is a software package containing a variety of tools for the Chimera overset grid approach for solving CFD problems of surface and volume grid generation; as well as grid manipulation, smoothing, and projection.
HiMAP A three level (Intra/Inter discipline, multicase) parallel HIgh fidelity Multidisciplinary (Fluids, Structures, Controls) Analysis Process,[9][10]
Supercomputing history
Since its construction in 1987, the NASA Advanced Supercomputing Facility has housed and operated some of the most powerful supercomputers in the world. Many of these computers include testbed systems built to test new architecture, hardware, or networking set-ups that might be utilized on a larger scale.[3][5] Peak performance is shown in Floating Point Operations Per Second (FLOPS).
The NAS facility currently houses disk mass storage on an SGI parallel DMF cluster with high-availability software consisting of four 32-processor front-end systems, which are connected to the supercomputers and the archival tape storage system. The system has 192 GB of memory per front-end[31] and 7.6 petabytes (PB) of disk cache.[1] Data stored on disk is regularly migrated to the tape archival storage systems at the facility to free up space for other user projects being run on the supercomputers.
Archive and storage systems
In 1987, NAS developed the first UNIX-based hierarchical mass storage system, named NAStore. It contained two StorageTek 4400 cartridge tape robots, each with a storage capacity of approximately 1.1 terabytes, cutting tape retrieval time from 4 minutes to 15 seconds.[3]
With the installation of the Pleiades supercomputer in 2008, the StorageTek systems that NAS had been using for 20 years were unable to meet the needs of the greater number of users and increasing file sizes of each project's datasets.[32] In 2009, NAS brought in Spectra Logic T950 robotic tape systems which increased the maximum capacity at the facility to 16 petabytes of space available for users to archive their data from the supercomputers.[33] As of March 2019, the NAS facility increased the total archival storage capacity of the Spectra Logic tape libraries to 1,048 petabytes (or 1 exabyte) with 35% compression.[31] SGI's Data Migration Facility (DMF) and OpenVault manage disk-to-tape data migration and tape-to-disk de-migration for the NAS facility.
As of March 2019, there is over 110 petabytes of unique data stored in the NAS archival storage system.[31]
Data visualization systems
In 1984, NAS purchased 25 SGI IRIS 1000 graphics terminals, the beginning of their long partnership with the Silicon Valley–based company, which made a significant impact on post-processing and visualization of CFD results run on the supercomputers at the facility.[3] Visualization became a key process in the analysis of simulation data run on the supercomputers, allowing engineers and scientists to view their results spatially and in ways that allowed for a greater understanding of the CFD forces at work in their designs.
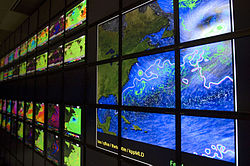
The hyperwall visualization system at the NAS facility allows researchers to view multiple simulations run on the supercomputers, or a single large image or animation.
The hyperwall
In 2002, NAS visualization experts developed a visualization system called the "hyperwall" which included 49 linked LCD panels that allowed scientists to view complex datasets on a large, dynamic seven-by-seven screen array. Each screen had its own processing power, allowing each one to display, process, and share datasets so that a single image could be displayed across all screens or configured so that data could be displayed in "cells" like a giant visual spreadsheet.[34]
The second generation "hyperwall-2" was developed in 2008 by NAS in partnership with Colfax International and is made up of 128 LCD screens arranged in an 8x16 grid 23 feet wide by 10 feet tall. It is capable of rendering one quarter billion pixels, making it the highest resolution scientific visualization system in the world.[35] It contains 128 nodes, each with two quad-core AMDOpteron (Barcelona) processors and a NvidiaGeForce 480 GTXgraphics processing unit (GPU) for a dedicated peak processing power of 128 teraflops across the entire system—100 times more powerful than the original hyperwall.[36] The hyperwall-2 is directly connected to the Pleiades supercomputer's filesystem over an InfiniBand network, which allows the system to read data directly from the filesystem without needing to copy files onto the hyperwall-2's memory.
In 2014, the hyperwall was upgraded with new hardware: 256 Intel Xeon "Ivy Bridge" processors and 128 NVIDIA Geforce 780 Ti GPUs. The upgrade increased the system's peak processing power from 9 teraflops to 57 teraflops, and now has nearly 400 gigabytes of graphics memory.[37]
In 2020, the hyperwall was further upgraded with new hardware: 256 Intel Xeon Platinum 8268 (Cascade Lake) processors and 128 NVIDIA Quadro RTX 6000 GPUs with a total of 3.1 terabytes of graphics memory. The upgrade increased the system's peak processing power from 57 teraflops to 512 teraflops.[38]
Concurrent visualization
An important feature of the hyperwall technology developed at NAS is that it allows for "concurrent visualization" of data, which enables scientists and engineers to analyze and interpret data while the calculations are running on the supercomputers. Not only does this show the current state of the calculation for runtime monitoring, steering, and termination, but it also "allows higher temporal resolution visualization compared to post-processing because I/O and storage space requirements are largely obviated... [and] may show features in a simulation that would otherwise not be visible."[39]
The NAS visualization team developed a configurable concurrent pipeline for use with a massively parallel forecast model run on the Columbia supercomputer in 2005 to help predict the Atlantic hurricane season for the National Hurricane Center. Because of the deadlines to submit each of the forecasts, it was important that the visualization process would not significantly impede the simulation or cause it to fail.
This page is based on this Wikipedia article Text is available under the CC BY-SA 4.0 license; additional terms may apply. Images, videos and audio are available under their respective licenses.