
The economy of Canada is a highly developed mixed economy, with the world's tenth-largest economy as of 2023, and a nominal GDP of approximately US$2.117 trillion. Canada is one of the world's largest trading nations, with a highly globalized economy. In 2021, Canadian trade in goods and services reached $2.016 trillion. Canada's exports totalled over $637 billion, while its imported goods were worth over $631 billion, of which approximately $391 billion originated from the United States. In 2018, Canada had a trade deficit in goods of $22 billion and a trade deficit in services of $25 billion. The Toronto Stock Exchange is the tenth-largest stock exchange in the world by market capitalization, listing over 1,500 companies with a combined market capitalization of over US$3 trillion.

The economy of Nicaragua is focused primarily on the agricultural sector. Nicaragua itself is the least developed country in Central America, and the second poorest in the Americas by nominal GDP. In recent years, under the administrations of Daniel Ortega, the Nicaraguan economy has expanded somewhat, following the Great Recession, when the country's economy actually contracted by 1.5%, due to decreased export demand in the American and Central American markets, lower commodity prices for key agricultural exports, and low remittance growth. The economy saw 4.5% growth in 2010 thanks to a recovery in export demand and growth in its tourism industry. Nicaragua's economy continues to post growth, with preliminary indicators showing the Nicaraguan economy growing an additional 5% in 2011. Consumer Price inflation have also curtailed since 2008, when Nicaragua's inflation rate hovered at 19.82%. In 2009 and 2010, the country posted lower inflation rates, 3.68% and 5.45%, respectively. Remittances are a major source of income, equivalent to 15% of the country's GDP, which originate primarily from Costa Rica, the United States, and European Union member states. Approximately one million Nicaraguans contribute to the remittance sector of the economy.
In economics, a recession is a business cycle contraction that occurs when there is a period of broad decline in economic activity. Recessions generally occur when there is a widespread drop in spending. This may be triggered by various events, such as a financial crisis, an external trade shock, an adverse supply shock, the bursting of an economic bubble, or a large-scale anthropogenic or natural disaster. But there is no official definition of a recession, according to the IMF.

The economy of the Republic of the Congo is a mixture of subsistence hunting and agriculture, an industrial sector based largely on petroleum extraction and support services. Government spending is characterized by budget problems and overstaffing. Petroleum has supplanted forestry as the mainstay of the economy, providing a major share of government revenues and exports. Nowadays the Republic of the Congo is increasingly converting natural gas to electricity rather than burning it, greatly improving energy prospects.

Reaganomics, or Reaganism, were the neoliberal economic policies promoted by U.S. President Ronald Reagan during the 1980s. These policies are characterized as supply-side economics, trickle-down economics, or "voodoo economics" by opponents, including some Republicans, while Reagan and his advocates preferred to call it free-market economics.

Unemployment, according to the OECD, is people above a specified age not being in paid employment or self-employment but currently available for work during the reference period.

The United States is a highly developed free market economy. It is the world's largest economy by nominal GDP; it is also the second largest by purchasing power parity (PPP), behind China. It has the world's sixth highest per capita GDP (nominal) and the eighth highest per capita GDP (PPP) as of 2024. The U.S. accounted for 26% of the global economy in 2023 in nominal terms, and about 15.5% in PPP terms. The U.S. dollar is the currency of record most used in international transactions and is the world's reserve currency, backed by a large U.S. treasuries market, its role as the reference standard for the petrodollar system, and its linked eurodollar. Several countries use it as their official currency and in others it is the de facto currency. Since the end of World War II, the economy has achieved relatively steady growth, low unemployment and inflation, and rapid advances in technology.
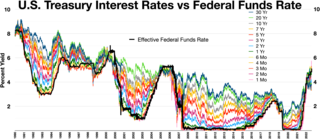
An economic indicator is a statistic about an economic activity. Economic indicators allow analysis of economic performance and predictions of future performance. One application of economic indicators is the study of business cycles. Economic indicators include various indices, earnings reports, and economic summaries: for example, the unemployment rate, quits rate, housing starts, consumer price index, Inverted yield curve, consumer leverage ratio, industrial production, bankruptcies, gross domestic product, broadband internet penetration, retail sales, price index, and changes in credit conditions.
The economies of Canada and the United States are similar because both are developed countries. While both countries feature in the top ten economies in the world in 2022, the U.S. is the largest economy in the world, with US$24.8 trillion, with Canada ranking ninth at US$2.2 trillion.
The early 1990s recession describes the period of economic downturn affecting much of the Western world in the early 1990s. The impacts of the recession contributed in part to the 1992 U.S. presidential election victory of Bill Clinton over incumbent president George H. W. Bush. The recession also included the resignation of Canadian prime minister Brian Mulroney, the reduction of active companies by 15% and unemployment up to nearly 20% in Finland, civil disturbances in the United Kingdom and the growth of discount stores in the United States and beyond.

Politicians and pundits frequently refer to the ability of the president of the United States to "create jobs" in the U.S. during his term in office. The numbers are most often seen during the election season or in regard to a president's economic legacy. The numbers typically used and most frequently cited by economists are total nonfarm payroll employment numbers as collected by the Bureau of Labor Statistics on a monthly and annual basis. The BLS also provides numbers for private-sector non-farm employment and other subsets of the aggregate.
The early 2000s recession was a major decline in economic activity which mainly occurred in developed countries. The recession affected the European Union during 2000 and 2001 and the United States from March to November 2001. The UK, Canada and Australia avoided the recession, while Russia, a nation that did not experience prosperity during the 1990s, began to recover from it. Japan's 1990s recession continued. A combination of the Dot Com Bubble collapse and the September 11th attacks lengthed and worsened the recession.

The Great Moderation is a period in the United States of America starting from the mid-1980s until at least 2007 characterized by the reduction in the volatility of business cycle fluctuations in developed nations compared with the decades before. It is believed to be caused by institutional and structural changes, particularly in central bank policies, in the second half of the twentieth century.

The International Labor Comparisons Program (ILC) of the U.S. Bureau of Labor Statistics (BLS) adjusts economic statistics to a common conceptual framework in order to make data comparable across countries. Its data can be used to evaluate the economic performance of one country relative to that of other countries and to assess international competitiveness.
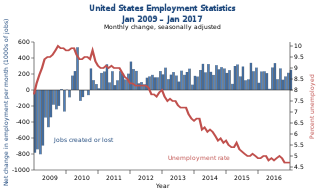
Unemployment in the United States discusses the causes and measures of U.S. unemployment and strategies for reducing it. Job creation and unemployment are affected by factors such as economic conditions, global competition, education, automation, and demographics. These factors can affect the number of workers, the duration of unemployment, and wage levels.

The United States entered a recession in 1990, which lasted 8 months through March 1991. Although the recession was mild relative to other post-war recessions, it was characterized by a sluggish employment recovery, most commonly referred to as a jobless recovery. Unemployment continued to rise through June 1992, even though a positive economic growth rate had returned the previous year.
The United States entered recession in January 1980 and returned to growth six months later in July 1980. Although recovery took hold, the unemployment rate remained unchanged through the start of a second recession in July 1981. The downturn ended 16 months later, in November 1982. The economy entered a strong recovery and experienced a lengthy expansion through 1990.

The economy of the Australian Capital Territory (ACT) is the fastest-growing, sixth biggest economy of Australia as of the end of the 2017-18 financial year. Since the introduction of its self-government status in 1989, and with few exceptions in 1992, 1996, and 2014, the ACT economy has exhibited positive growth at a 1991-2018 average of 3.17 percent per year. A vast majority of the economy is concentrated in Canberra, the capital city of Australia, and is composed primarily (about 75%) by service industries, particularly those related to the administration of federal and local government. Construction also contributes to an important part of the economy, boosted by large government-funded projects and an active residential market. In contrast to other Australian states and territories, primary sectors such as agriculture, forestry, and mining, represent a very small proportion of the economy (±1%). A negative balance of trade has characterised the ACT economy since 2012-13, with small goods trade and a growing service export industry comprised mainly by education and public administration services.

The JOLTS report or Job Openings and Labor Turnover Survey is a report from the Bureau of Labor Statistics measuring employment, layoffs, job openings, and quits in the United States economy. The report is released monthly and usually a month after the jobs report for the same reference period. Job separations are broken down into three categories quits or voluntary resignations, layoffs or discharges, and other separations which include deaths and retirements. Job openings and the quits rate were at an all time high in 2021 and 2022 in what came to be called the Great Resignation.

