This article needs to be updated. Please help update this article to reflect recent events or newly available information.(December 2025)
Oroville Dam crisis
View of Oroville Dam's main spillway (center) and emergency spillway (top), February 11, 2017. The large gully to the right of the main spillway was caused by water flowing through its broken and damaged concrete surface.
In early February 2017, Oroville Dam's main and emergency spillways both sustained damage during a period of sustained outflow from Lake Oroville, leading to the evacuation of areas downstream. Severe rainstorms and snowstorms impacted California, which, after being in a state of drought for five years, was not environmentally capable of absorbing the excess precipitation into the ground. The lake levels began rising rapidly following another wet storm in early February, and soon began flowing out of the main spillway. Damage to the spillway was first noted on February 7; as the spillway continued to degrade, the decision was made to reduce its outflow by utilizing the emergency spillway on February 11, 2017, which had not been used since the dam’s construction, which consisted of a barren hillside. The hillside began eroding much faster than had been anticipated, particularly at its top, and this headward erosion threatened to undermine the concrete weir at the top of the emergency spillway, which could have sent a 30-foot (10 m) wall of water into the Feather River below and flooded communities downstream. On February 13, as authorities oversaw the evacuation of more than 180,000 people living in the threatened areas, mainly those in Butte County, Yuba County, and Sutter County, emergency reinforcements were added to the emergency spillway and the outflow through the main spillway was increased again, which significantly exacerbated the damage to the main spillway and the adjacent hillside. On February 14, amidst declining outflows and the cessation of flow through the emergency spillway, the evacuees were allowed to return. Repairs to the dam were substantially complete by 2019.
The Oroville dam before the crisis, with main spillway center and overflow spillway immediately to the left, above vegetation
For flood control purposes, some space in Oroville Reservoir has to be kept dry to capture floodwaters, a practice that has caused controversy at other dams of California over the amounts of water wasted.[6] Dam operators were required to discharge water based on charts contained in the Oroville Dam Reservoir Regulation Manual, a flood-control manual developed by the U.S. Army Corps of Engineers.[7][8]:6–9 At the time of the incident, the Oroville Dam Reservoir Regulation Manual had last been updated in 1970 and the discharge charts were based on climatological data and runoff projections that did not account for climate change or significant floods in 1986 and 1997. In the immediate aftermath of the incident, it was not clear if the outdated manual was a significant factor in the February 2017 crisis.[7][9] The Final Report of the Independent Review Board, released 11 months after the crisis, did not cite the outdated manual as a significant factor.[10]
The dam complex was designed with four routes for water to pass from Lake Oroville:
Through the hydro-electric generators, which have a combined maximum flow rate of 16,950cuft/s (480m3/s).[5]
Through a river outlet (also known as the bypass valve) that has a capacity of 5,400cuft/s (150m3/s).[1]:A5–A6
Through the main (service) spillway located on the northwest abutment of the dam, which is used to control the height of the reservoir by quickly releasing large amounts of excess water down a 3,050ft (930m) concrete-lined channel that extends to the river below. Water flow onto the main spillway is controlled by eight radial (Tainter) gates that have a combined maximum discharge capacity of 270,000cuft/s (7,600m3/s) when the lake elevation is 905 feet. Since the sill elevation of the spillway is 813.6ft (248.0m), it can only be used at lake elevations above that level.[1]:A5–A6[11]
Over the top of an emergency spillway, consisting of a 1,730-foot (530m) long, 30-foot (9.1m) high concrete weir beside the main spillway and the adjacent earthen slope of the abutment. Once the lake reaches an elevation of 901ft (275m) above mean sea level—21 feet (6m) below the height of the main dam structure—water flows, uncontrolled, over the weir and down the earthen slope until it reaches the river below.[12][1]:A5–A6
In 2005, the dam underwent re-licensing by the Federal Energy Regulatory Commission, during which three environmental advocacy groups filed a motion with the FERC raising concerns about use of the emergency spillway.[2][13] The environmental advocacy groups stated a 2002 technical memorandum by the Yuba County Water Agency that noted that significant erosion of the hillside would occur if the emergency spillway is used, which could cause significant downstream damage and impair operation of the Edward Hyatt Powerplant.[8]:13 The groups urged the FERC to condition renewal of the Oroville Dam's license on the lining of the slope of the emergency spillway with concrete and to update the Oroville Dam Reservoir Regulation Manual.[13][2][8]:24–28
According to FERC engineering guidelines, "Emergency spillways may be used to obtain a high degree of hydrologic safety with minimal additional cost. Because of their infrequent use it is acceptable for them to sustain significant damage when used and they may be designed with lower structural standards than used for auxiliary spillways."[8]:18–19 The FERC determined that the emergency spillway structure was compliant with its engineering standards and that the erosion concerns raised by the environmental advocacy groups were overblown.[13] The commission also determined that the emergency spillway could handle 300,000cuft/s (8,500m3/s) of discharge and renewed the dam's license without requiring the concrete lining of the emergency spillway, estimated to cost over $100million.[13][2] A 2018 study by the Association of State Dam Safety Officials discovered that the commission relied on original geology reports from the 1960s, stating that the hillside below the emergency spillway was bedrock; it was actually weathered rock subject to deep erosion if the spillway were to be put into use.[14]
Partial view of the emergency spillway (left) and the concrete structure containing the gates for the main service spillway (right)
Prior to February 2017, the main spillway had been last inspected in August 2016. During that inspection, the spillway was visually inspected without inspectors entering the spillway chute. Inspectors entered the spillway chute for inspections in 2014 and 2015 without finding any concerns. Cracks in the concrete spillway chute were repaired in 2009 and 2013.[15]
Timeline of crisis
Timeline of Oroville Dam crisis, February 2017
Oroville Dam normal operations
2005: Upgrade proposal rejected
7 Feb 2017: Main spillway fails
raw example of images below text
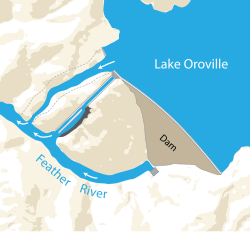
1. The lake level is controlled using the main spillway gate, which releases water down the concrete spillway to get to the river below. 2. The emergency spillway, which has a 30ft (9m) high concrete wall at the top of a hill, is unused.
Despite concerns that the emergency spillway is vulnerable to erosion, a $100 million request by environmentalists to upgrade it to a concrete-lined auxiliary spillway is rejected by the federal regulators.
Craters appear in the main spillway. To avoid increasing the damage to the spillway, water releases are slowed allowing the lake to rise.
11 Feb 2017: Emergency spillway used
13 Feb 2017: Repairs made
Potential risks
Water flows over the emergency spillway causing erosion and damage. This is by design and prevents water going over the top of the main dam. However the ground erodes faster than expected.
Rocks and concrete (1) are placed under the emergency spillway weir to repair erosion damage (2). The release of water into the main spillway is increased, to lower the lake in preparation for more rain. This erodes the adjacent hillside considerably, generating a debris dam (3) that blocks the river and forces the closure of the hydroelectric plant.
While the main 770ft (230m) dam is not threatened, if the erosion on either spillway reaches the top, it would cause the weir or gate (respectively) to collapse, causing a large uncontrolled water release and life-threatening floods.
version 3 – February 28, 2017
public domain OK to share and use
Main spillway damage
In early February 2017, high inflows to Lake Oroville caused dam operators to start using the concrete main spillway to control the lake level.[16] Between February 6–10, 2017, 12.8in (330mm) of rain fell on the Feather River Basin. Inflow of water into Lake Oroville rose from 30,000cuft/s (850m3/s) on February 6 to over 130,000cuft/s (3,700m3/s) at mid-day on February 7, before subsiding to about 75,000cuft/s (2,100m3/s) the following day.[17] Dam operators began increasing the flow down the main spillway to 54,500cuft/s (1,540m3/s) on February 7 but soon noticed an unusual flow pattern.[17] The flow of water down the spillway was stopped for investigation, revealing a crater about halfway down the spillway where the concrete lining was eroded through and water was escaping the concrete chute.[17][18] The DWR consulted with FERC and other dam safety agencies about the issue and prepared for the possibility of using the emergency spillway.[17]
During two test flows down the spillway on February 8–9, the length of the crater increased from 250ft (76m) to 300ft (91m).[18] Meanwhile, the level of Lake Oroville was rising as inflow into Lake Oroville skyrocketed from about 130,000cuft/s (3,700m3/s) on February 7 to a peak of 190,435cuft/s (5,395m3/s) late on February 9.[17] The DWR was then confronted with two choices: use the main spillway, knowing it would likely be further damaged, or allow Lake Oroville to rise until it overtopped the emergency spillway.[18]
March 2011
February 7, 2017
February 27, 2017
Damage to the main spillway began as a crater in the middle (center) and eventually resulted in a separate channel eroded to the side (right). At left, the main spillway is shown in March 2011 while at its maximum discharge rate.
On February 9, the main spillway was reopened. DWR hoped that using the damaged spillway with a limited flow could drain the lake enough to avoid use of the emergency spillway, which would potentially damage powerlines servicing the hydroelectric plant.[19] The following day, discharge on the main spillway was reduced from 65,000cuft/s (1,800m3/s) to 55,000cuft/s (1,600m3/s), but this flow was not enough to prevent the lake from rising.[20][21][17] On February 11, the lake level reached 901ft (275m) above mean sea level and water began flowing—as designed—over the concrete weir along the top of the emergency spillway, cascading onto the emergency spillway for the first time in the dam's history.[12]
Emergency spillway damage
Water flowing into Oroville Dam's main spillway (bottom) and overflowing into the emergency spillway (top), February 11, 2017
As the lake level rose, measures were taken to prepare the emergency spillway for use. On February 10, 2017, workers began clear-cutting trees on the hillside below the emergency spillway.[22]
Shortly after 8:00am on February 11, 2017, the emergency spillway began carrying water for the first time since the dam's construction in 1968.[23] Because the spillway was a separate structure from the dam, officials stated that there was no danger of the main embankment being breached, and evacuation of Oroville was not considered at that time, as officials stated that there was no threat to public safety. The uncontrolled flow over the weir topped out at 12,600cuft/s (360m3/s).[24][25]
Erosion at the base of the weir—which was expected—progressed much faster than anticipated.[17] The headward erosion of the emergency spillway threatened to undermine and collapse the concrete weir, in which case a 30-foot (9m) wall of water would be sent into the Feather River below and flood communities downstream.[12] Fearing a collapse, the Butte County Sheriff's Office issued an evacuation order of the Oroville area.[12][17] To ease pressure on the emergency spillway and prevent a possible collapse of the weir, the DWR nearly doubled the discharge volume of the main spillway from 55,000cuft/s (1,600m3/s) to 100,000cuft/s (2,800m3/s).[17] Several hours later, water stopped flowing over the weir onto the emergency spillway and officials began assessing the state of the emergency spillway.[17]
Evacuation of the Feather River Basin
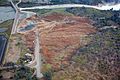
Aerial view of spillways and erosion on February 12
On February 12, 2017, evacuation was ordered for those in low-lying areas along the Feather River Basin in Butte, Yuba and Sutter counties, because of an anticipated failure of the emergency spillway.[26] Specifically, erosion on the hillside was growing uphill toward the concrete lip of the emergency spillway, leading to the fear that it would collapse. A failure of the concrete top of the spillway would allow up to 30 feet (9m) vertical of Lake Oroville through the gap in an uncontrolled deluge.[27] The flow over the main spillway was increased to 100,000cuft/s (2,800m3/s) to try to slow the erosion of the emergency spillway.[28]
By 9p.m. on the evening of February 12, the increased flow had successfully lowered the water level to below the emergency spillway top, causing the emergency spillway to stop overflowing. The stop in water flow allowed the erosion there to be hastily inspected and stabilized with boulders.[27] Engineers worried that the damage would be transferred to the main spillway, not only making future repairs more expensive, but also that the damage to the main spillway could grow uphill to the point that it endangered the main spillway gates, leaving no safe way to release water. The extent of such damage was unknown; it was expected to be assessed on the morning of February 13.[27] On February 13 helicopters began to drop sandbags and large rocks in the area of the now-dry emergency spillway, in order to protect the base from erosion.[29][30] By February 13, 188,000 people in the vicinity were reported evacuated.[31] About 23,000 National Guardsmen were ordered to be ready for "immediate deployment if the dam spillway should fail" to help with evacuation and relief efforts.[29] On February 14, at 2:45 pm local time, the evacuation order above was reduced to an evacuation watch by emergency management officials and the State of California Department of Water Resources, and people were allowed to return to the evacuated areas.[32]
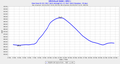
Level of Lake Oroville, February 3–23
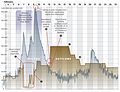
Chart of Lake Oroville inflow and outflow, February 4–25
Emergency shoring of the emergency spillway with rock and concrete (February 16)
Rock being loaded into bags for transport by helicopter (upper right) to reinforce the emergency spillway (February 13)
Closeup view of emergency reinforcement (concrete over rocks) on emergency spillway (February 19)
Aerial view of erosion on the emergency spillway (February 16)
Senator Kamala Harris joins local officials in performing an aerial inspection of the dam (February 23)
Eroded soil and debris blocking Feather River (February 27)
Downstream effects
Baby salmon being rounded up (left) from the murky waters at the Feather River Fish Hatchery, due to soil eroded at the spillway, and unloaded at the Thermalito Afterbay Complex (right)
The immediate harm from the damage is limited to the area downstream of the breach, eroding the hillside to form a canyon. However, a major danger is that the spillway can erode back up toward the gate because of being undercut by the water falling into the crater. Eventually, this would threaten the spillway gate, in close proximity to the actual abutment of the dam.[20]
About 150,000 cubic yards (110,000m3)[33] of erosion debris clogged the channel of the Feather River below the dam, preventing release of water from the hydroelectric plant, thus reducing the overall capacity of the dam to release water.[20] Debris was carried downstream and caused damage to the Feather River Fish Hatchery due to high turbidity.[34] State workers began evacuating fish and eggs from the hatchery in an attempt to mitigate the damage and evacuated over nine million fish downstream to a satellite hatchery adjacent to Thermalito Afterbay.[35][36]
On February 27, the flow to the spillway was temporarily shut off, allowing crews to begin removing debris in the river in preparation to restart the power plant.[37] After the spillway was shut off, it appeared that headward erosion along the spillway channel had mostly stabilized, reducing the immediate threat of a gate failure and uncontrolled water release.[38] The bedrock under the upper half of the spillway appears to be much stronger than the rock which was washed out under the midsection of the spillway. In addition, the force of the falling water had excavated the original crater into a deep plunge pool which acts as a hydraulic cushion, dissipating much of the energy that otherwise might have caused additional damage to the spillway.[39]
Investigation
The Federal Energy Regulatory Commission (FERC) ordered the California Department of Water Resources (DWR) to assemble a team of five independent experts to assess the dam and issue recommendations.[40] On February 17, 2017, the DWR commissioned an independent Board of Consultants (BOC) to investigate causes, review, and comment on repairs to Oroville Dam.[41] Memoranda (reports) prepared by the BOC are posted at the DWR website.[42] DWR also assembled an Independent Forensic Team (IFT) to determine the cause of the spillways incident, including effects of operations, management, structural design, and geological conditions, and the IFT published a nearly 600-page report in January 2018.[10][43] The DWR also requested assistance from the FERC in the form of expedited permitting and full-time FERC staff to provide immediate oversight, review, and approval of repair plans that would make the dam safe for the 2017–18 flood season.[43]
Department of Water Resources 2017–18 Operations Plan
The DWR prepared a Lake Oroville 2017/2018 Flood Control Season Operations Plan.[44] The plan detailed steps to lower the lake level to an elevation of 700 feet, instead of the previous 780 feet. The lower lake level would allow the DWR to keep releases on the reconstructed spillways to 100,000 cubic feet per second, ensuring lake levels remain below 901 feet. It also held the contingency that if the reservoir rose quickly in winter months, the DWR would increase outflows through the Hyatt Powerplant, river valve outlets, or the main spillway to manage lake levels. The DWR consulted with the United States Army Corps of Engineers to develop the plan.
Public hearings
On May 11, 2017, a hearing took place. During the hearing, the California Department of Water Resources came under criticism for ignoring warning signs in the spillway's designs. Butte County Supervisor also complained that DWR had broken promise with Oroville, as the county had to spend $5.3 million annually for dam-related services, while getting no compensation from the state. Witnesses also stated that DWR did not take safety seriously.[45]
Repairs
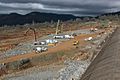
The Oroville Dam main spillway on August 5, 2018, during phase 2 repairs
The main spillway was successfully reconstructed by November 1, 2018.[46]
According to its 2017–18 operations plan, the DWR maintained Lake Oroville at a lower than normal level to reduce the possibility that the spillway would have to be used the following winter.[44]
In a second phase of spillway repairs in 2018–19, temporary repairs on the main spillway done during Phase 1 were being torn out and replaced with steel-reinforced structural concrete.[47]
Completed spillway in May 2023 releasing water for the first time in four years
On April 2, 2019, due to heavy rainfall upstream, the DWR began releasing water over the newly reconstructed spillway at a rate of 8,300cuft/s (240m3/s).[49] Releases were increased to 25,000cuft/s (710m3/s) on April 7 to test how the spillway performed in higher flows. They were decreased to 15,000cuft/s (420m3/s) on April 9.
Overall, repairs took over 2 million hours to rebuild the Oroville Spillways.[50]
With the main damage repaired, there are still periodic concrete and sealant repairs. The Department of Water Resources monitor the weather and reservoir levels closely to determine whether early repair work in necessary. The construction period for this is set to end in 2025.[1]
This page is based on this Wikipedia article Text is available under the CC BY-SA 4.0 license; additional terms may apply. Images, videos and audio are available under their respective licenses.