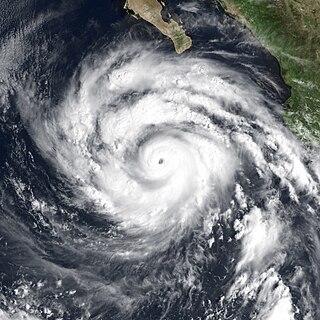
Hurricane Linda was an extremely powerful tropical cyclone that was, at the time, the most intense eastern Pacific hurricane on record, until it was surpassed 18 years later by Patricia. Forming from a tropical wave on September 9, 1997, Linda steadily intensified and reached hurricane status within 36 hours of developing. The storm rapidly intensified, reaching sustained winds of 185 mph (295 km/h) and an estimated central pressure of 902 millibars (26.6 inHg); both were records for the eastern Pacific until Hurricane Patricia surpassed them in 2015. The hurricane was briefly forecast to move toward southern California, but instead, it turned out to sea and lost its status as a tropical cyclone on September 17, before dissipating on September 21. Linda was the fifteenth tropical cyclone, thirteenth named storm, seventh hurricane, and fifth major hurricane of the 1997 Pacific hurricane season. Linda was also the most intense tropical cyclone worldwide in 1997.

The 1997 Pacific hurricane season was a very active hurricane season. With hundreds of deaths and hundreds of millions of dollars in damage, this was one of the deadliest and costliest Pacific hurricane seasons on record. This was due to the exceptionally strong 1997–98 El Niño event. The season officially started on May 15, in the eastern Pacific, and on June 1, in the central Pacific, and lasted until November 30. These dates conventionally delimit the period of each year when almost all tropical cyclones form in the northeastern Pacific Ocean.

The 1986 Pacific hurricane season featured several tropical cyclones that contributed to significant flooding to the Central United States. The hurricane season officially started May 15, 1986, in the eastern Pacific, and June 1, 1986 in the central Pacific, and lasted until November 30, 1986 in both regions. These dates conventionally delimit the period of each year when most tropical cyclones form in the northeastern Pacific Ocean. A total of 17 named storms and 9 hurricanes developed during the season; this is slightly above the averages of 15 named storms and 8 hurricanes, respectively. In addition, 26 tropical depressions formed in the eastern Pacific during 1986, which, at the time, was the second most ever recorded; only the 1982 Pacific hurricane season saw a higher total.

The 1983 Pacific hurricane season was the longest season ever recorded at that time. It was a very active Pacific hurricane season. The season started on May 15, 1983 in the eastern Pacific, and on June 1, 1983 in the central Pacific, and lasted until November 30, 1983. These dates conventionally delimit the period of each year when most tropical cyclones form in the northeastern Pacific Ocean. During the 1983 season, there were 20 named storms, which was slightly less than the previous season. Furthermore, twelve of those storms became hurricanes. And eight of the storms reached major hurricane status, or Category 3 or higher on the Saffir–Simpson hurricane wind scale (SSHWS). The decaying 1982–83 El Niño event likely contributed to this level of activity. That same El Niño influenced a very quiet Atlantic hurricane season.

The 1977 Pacific hurricane season stands alongside 2010 as the least active Pacific hurricane season since reliable records began in 1971. Only eight tropical storms formed throughout the year; four further intensified into hurricanes, yet none strengthened into major hurricanes—a Category 3 or stronger on the Saffir–Simpson scale—an occurrence not seen again until 2003. Most tropical cyclones remained over the open eastern Pacific; however, the remnants of hurricanes Doreen and Heather led to heavy rainfall which damaged or destroyed structures and flooded roadways throughout the Southwest United States. Notably, Hurricane Anita which originally formed in the Gulf of Mexico made the rare trek across Mexico into the eastern Pacific, briefly existing as a tropical depression. Eight deaths were recorded while damage reached $39.6 million.

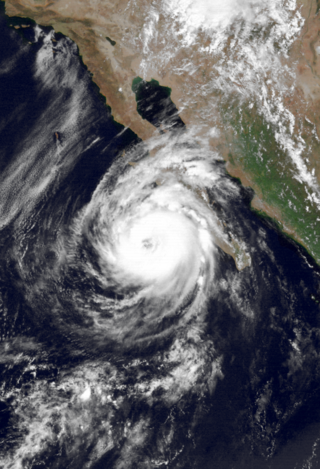
Hurricane Nora was the first tropical cyclone to enter the Continental United States from the Pacific Ocean since Hurricane Lester in 1992. Nora was the fourteenth named tropical cyclone and the seventh hurricane of the 1997 Pacific hurricane season. The September storm formed off the Pacific coast of Mexico, and aided by waters warmed by the 1997–98 El Niño event, eventually peaked at Category 4 intensity on the Saffir–Simpson hurricane scale.

Tropical Storm Norma was the fourteenth named tropical cyclone of the 1970 Pacific hurricane season. The storm formed off the coast of Mexico and intensified rapidly, peaking as a strong tropical storm on September 3, before starting a weakening trend. It dissipated before making landfall on Baja California.

Hurricane Isis was the only hurricane to make landfall during the 1998 Pacific hurricane season. The ninth tropical storm and sixth hurricane of the season, Isis developed on September 1 from an interaction between a tropical wave and a large surface circulation to the southwest of Mexico. It moved northward, striking the extreme southeastern portion of the Baja California peninsula before attaining hurricane status in the Gulf of California. Isis made landfall at Topolobampo in the Mexican state of Sinaloa on September 3, and quickly lost its low-level circulation. The remnants persisted for several days before dissipating over the U.S. state of Idaho on September 8.
Hurricane Lester was the first Pacific tropical cyclone to enter the United States as a tropical storm since 1967. The fourteenth named storm and eighth hurricane of the 1992 Pacific hurricane season, Lester formed on August 20 from a tropical wave southwest of Mexico. The tropical storm moved generally northwestward while steadily intensifying. After turning to the north, approaching the Mexican coast, Lester attained hurricane status. The hurricane reached peak winds of 85 mph (137 km/h) before making landfall on west-central Baja California. The system weakened while moving across the peninsula and then over northwestern Mexico. Not long after entering Arizona, Lester weakened to a tropical depression, and degenerated into an extratropical low on August 24, 1992, over New Mexico. The storm's remnants later merged with the remnants of Hurricane Andrew and another frontal system on August 29.
Hurricane Raymond was the strongest tropical cyclone of the 1989 Pacific hurricane season, peaking as a strong Category 4 hurricane on the Saffir–Simpson hurricane scale. Forming out of a tropical wave on September 25, 1989, the tropical depression slowly tracked northwest before becoming nearly stationary the next day. Shortly after, the depression intensified into Tropical Storm Raymond and took a general westward track. Gradually intensifying, Raymond attained hurricane-status on September 28 and attained its peak intensity on September 30, with winds of 145 mph (233 km/h) and a barometric pressure of 935 mbar. Steady weakening then took place and by October 3, Raymond turned northeast towards land. The storm continued to weaken as it accelerated and eventually made landfall on the Baja California Peninsula as a tropical storm late on October 4 and a second landfall in Sonora, Mexico. Shortly after, Raymond weakened to a depression as it tracked inland. The remnants of the system persisted until October 7 when it dissipated over the Central United States.
Hurricane Irene–Olivia was the first actively tracked tropical cyclone to move into the eastern Pacific Ocean from the Atlantic basin. It originated as a tropical depression on September 11, 1971, in the tropical Atlantic. The cyclone tracked nearly due westward at a low latitude, passing through the southern Windward Islands and later over northern South America. In the southwest Caribbean Sea, it intensified to a tropical storm and later a hurricane. Irene made landfall on southeastern Nicaragua on September 19, and maintained its circulation as it crossed the low-lying terrain of the country. Restrengthening after reaching the Pacific, Irene was renamed Hurricane Olivia, which ultimately attained peak winds of 115 mph (185 km/h). Olivia weakened significantly before moving ashore on the Baja California Peninsula on September 30; the next day it dissipated.

Hurricane Jimena is tied with Hurricane Norbert as the strongest tropical cyclone to make landfall on western portion of the Baja California Peninsula. Jimena was the twelfth named storm, fifth hurricane, third major hurricane and overall second-strongest tropical cyclone of the 2009 Pacific hurricane season. Forming from a tropical wave late on August 28, 2009, off of Mexico's Pacific coast, the system rapidly intensified into a Category 2 hurricane on the next day. Two days after developing, Jimena strengthened into a Category 4 hurricane. After peaking close to Category 5 intensity on September 1, it encountered cold water and began to weaken. When the hurricane made landfall on the Baja California Peninsula on September 3, it was only a Category 2 hurricane. On the next day, the tropical cyclone entered the Gulf of California, though the storm weakened into a remnant low after looping back eastward towards Baja California. The storm's remnants drifted westward into the Pacific afterward, before dissipating on September 8.

Hurricane Madeline was the second landfalling major hurricane along the Pacific coast of Mexico in a week. Madeline formed on September 29, not far from Central America. The next day, the circulation dissipated, and as a result weakened to a remnant low. Four days later, on October 3, the low regenerated into a tropical depression. The system remained weak for three days as it drifted west-northwest. When it began to recurve towards Mexico on October 6, the cyclone rapidly intensified and eventually made landfall at peak intensity as a Category 4. Shortly after landfall, the cyclone rapidly dissipated.

The 2015 Pacific hurricane season is the second-most active Pacific hurricane season on record, with 26 named storms, only behind the 1992 season. A record-tying 16 of those storms became hurricanes, and a record 11 storms further intensified into major hurricanes throughout the season. The Central Pacific, the portion of the Northeast Pacific Ocean between the International Date Line and the 140th meridian west, had its most active year on record, with 16 tropical cyclones forming in or entering the basin. Moreover, the season was the third-most active season in terms of accumulated cyclone energy, amassing a total of 290 units. The season officially started on May 15 in the Eastern Pacific and on June 1 in the Central Pacific; they both ended on November 30. These dates conventionally delimit the period of each year when most tropical cyclones form in the Northeast Pacific basin. However, the formation of tropical cyclones is possible at any time of the year. This was shown when a tropical depression formed on December 31. The above-average activity during the season was attributed in part to the very strong 2014–2016 El Niño event.

Hurricane Doreen was considered the worst tropical cyclone to affect California in 32 years. The tenth tropical cyclone, fourth named storm, and second hurricane of the otherwise inactive 1977 Pacific hurricane season, it developed on August 13. The depression tracked northwestward, intensifying into Tropical Storm Doreen later that day. Further strengthening occurred over the subsequent days, and Doreen attained its peak as a minimal hurricane early on August 15. Executing a turn towards the north-northwest, Doreen made its first landfall as a Category 1 hurricane on the Saffir–Simpson Hurricane Wind Scale near Puerto San Carlos. Drifting offshore, Doreen made a second and final landfall near the northern portion of the Baja California as a tropical storm before rapidly weakening to a tropical depression. The tropical depression dissipated south of southern California on August 18.

Hurricane Joanne was one of four tropical cyclones to bring gale-force winds to the Southwestern United States in the 20th century. A tropical depression developed on September 30, 1972. It then moved west northwest and intensified into a hurricane on October 1. Hurricane Joanne peaked as a Category 2 hurricane, as measured by the modern Saffir-Simpson hurricane wind scale (SSHWS), October 2. Joanne then slowed and began to re-curve. Joanne made landfall along the northern portion of the Baja California Peninsula as a tropical storm. The tropical storm moved inland over Sonora on October 6 and was believed to have survived into Arizona as a tropical storm. In Arizona, many roads were closed and some water rescues had to be performed due to a prolonged period of heavy rains. One person was reportedly killed while another was electrocuted. A few weeks after the hurricane, Arizona would sustain additional flooding and eight additional deaths.

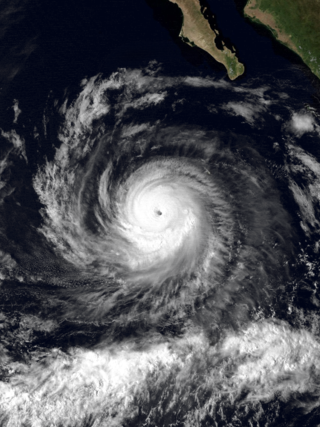
Hurricane Dolores was a powerful and moderately damaging tropical cyclone whose remnants brought record-breaking heavy rains and strong winds to California. The seventh named storm, fourth hurricane, and third major hurricane of the record-breaking 2015 Pacific hurricane season, Dolores formed from a tropical wave on July 11. The system gradually strengthened, attaining hurricane status on July 13. Dolores rapidly intensified as it neared the Baja California peninsula, finally peaking as a Category 4 hurricane on the Saffir–Simpson scale with winds of 130 mph (215 km/h) on July 15. An eyewall replacement cycle began and cooler sea-surface temperatures rapidly weakened the hurricane, and Dolores weakened to a tropical storm two days later. On July 18, Dolores degenerated into a remnant low west of the Baja California peninsula.

Hurricane Kay was a Category 2 hurricane that made landfall along the Pacific coast of the Baja California peninsula as a tropical storm. The twelfth named storm and eighth hurricane of the 2022 Pacific hurricane season, Kay originated from an area of disturbed weather that formed south of southern Mexico. Overall, damage from Kay totaled $10.62 million and it was responsible for five fatalities. Rain from the storm proved beneficial for firefighters battling the Fairview Fire in Southern California.


