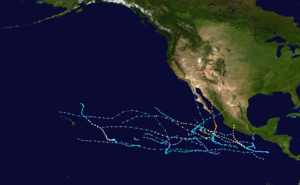
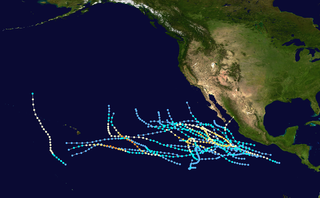
1976 Pacific hurricane season

Last updated
1976 Pacific hurricane season
1976 Pacific hurricane season summary map.png
Season summary map
Seasonal boundaries
First system formedJune 2, 1976
Last system dissipatedOctober 29, 1976
Strongest storm
NameAnnette
  Maximum winds140 mph (220 km/h)
(1-minute sustained)
  Lowest pressure925 mbar (hPa; 27.32 inHg)
Seasonal statistics
Total depressions19
Total storms15
Hurricanes9
Major hurricanes
(Cat. 3+)
5
Total fatalities614-964 total
Total damage$360 million (1976 USD)
Related articles
Pacific hurricane seasons
1974, 1975, 1976, 1977, 1978

The 1976 Pacific hurricane season was a very deadly and costly season. Hurricanes Kathleen, Liza, and Madeline were the most notable storms this year. Hurricane Kathleen caused death and destruction in California and Arizona due to flooding. Hurricane Liza was the deadliest storm of the season when it killed over 600 people in Mexico. Hurricane Madeline is notable for being one of the most intense Pacific hurricanes at landfall.

Contents

Season summary

Hurricane Madeline (1976)Hurricane LizaHurricane KathleenSaffir–Simpson Hurricane Scale1976 Pacific hurricane season

The season officially started May 15, 1976, in the eastern Pacific, and June 1, 1976, in the central Pacific, and lasted until November 30, 1976. These dates conventionally delimit the period of each year when most tropical cyclones form in the northeastern Pacific Ocean. In practice, the season lasted from the formation of the first storm on June 2 to the dissipation of the last on October 30.

This season had a slightly below average number of tropical storms, with fourteen. The number of hurricanes was average, with eight. The season had an above-average number of major hurricanes, with five reaching Category 3 or higher on the Saffir-Simpson Hurricane Scale. Four of tropical depressions dissipated before they could reach tropical storm strength. There were five landfalls, including three by consecutive storms. In the Central Pacific, one tropical cyclone, a hurricane formed. Two storms entered the region from the east. These totals are close to average. [1]

Systems

Hurricane Annette

Category 4 hurricane (SSHWS)
AnnetteJune101976.png   Annette 1976 track.png
DurationJune 3 – June 14
Peak intensity140 mph (220 km/h) (1-min);
925  mbar  (hPa)

A tropical disturbance formed well south of the Gulf of Tehuantepec on June 2. [2] It organized into a tropical depression around 00:00 UTC on June 3 but initially failed to intensify further, [3] due in part to its loosely-defined circulation. [2] Following a consolidation of its center, the cyclone finally strengthened into Tropical Storm Annette early on June 6 and entered a period of steady to rapid development. Annette became the season's first hurricane by 06:00 UTC on June 7, [3] coincident with indications of an eye on satellite imagery. It became a major hurricane late on June 8 and reached Category 4 intensity with peak winds of 140 mph (230 km/h) the next day, when a reconnaissance aircraft measured a minimum atmospheric pressure of 925 mbar (hPa; 27.32 inHg). Annette slowed and curved north after its peak, bringing the cyclone over colder waters that prompted weakening. [2] The hurricane was downgraded to a tropical storm early on June 12 and further to a tropical depression late the next day. Annette dissipated by 06:00 UTC on June 14. [3]

Hurricane Bonny

Category 1 hurricane (SSHWS)
BonnyJune281976.png   Bonny 1976 track.png
DurationJune 26 – June 29
Peak intensity75 mph (120 km/h) (1-min);
987  mbar  (hPa)

A tropical disturbance formed about 335 miles (539 km) south of Acapulco, Guerrero, early on June 22, [2] only slowly consolidating into a tropical depression by 00:00 UTC on June 26. [3] On a westward track, it strengthened into Tropical Storm Bonny twelve hours after formation and further organized into a hurricane around 06:00 UTC on June 27, attaining peak winds of 75 mph (121 km/h). [3] This forward trajectory brought the system over cooler waters, [2] causing Bonny to weaken to rapidly weaken to a tropical depression by early on June 28. It moved erratically before dissipating around 18:00 UTC the next day. [3]

Tropical Storm Celeste

Tropical storm (SSHWS)
CelesteJuly1619762315UTC.png   Celeste 1976 track.png
DurationJuly 14 – July 19
Peak intensity50 mph (85 km/h) (1-min);

On July 14, a tropical disturbance formed about 655 miles (1,054 km) southwest of Acapulco, Guerrero; [2] it rapidly developed into a tropical depression around 12:00 UTC that day. [3] The depression intensified into Tropical Storm Celeste late on July 15, and it continued to gather strength as it moved west, reaching peak winds of 50 mph (80 km/h) on July 16 as a transient eye appeared on satellite imagery. The effects of cooler water impeded further development, [2] and the storm rapidly weakened to a tropical depression early on July 17 before dissipating around 06:00 UTC on July 19. [3]

Hurricane Diana

Category 2 hurricane (SSHWS)
DianaJuly1819761745UTC.png   Diana 1976 track.png
DurationJuly 16 – July 23
Peak intensity100 mph (155 km/h) (1-min);

A day after the formation of Celeste, a new tropical disturbance formed roughly 460 miles (740 km) south of Acapulco, Guerrero, organizing into the season's sixth tropical depression around 00:00 UTC on July 16. [3] A sprawling storm, [2] the system strengthened into Tropical Storm Diana twelve hours later. It reached hurricane strength the next day and continued to intensify, peaking as a Category 2 hurricane with winds of 100 mph (160 km/h) around 18:00 UTC on July 18. [3] A continual west-northwest track brought Diana over progressively cooler waters, [2] causing it to weaken to a tropical storm again early on July 20. [3] After further degrading to a tropical depression, the system crossed into the Central Pacific Hurricane Center's area of responsibility, where it maintained its status as a tropical cyclone until dissipating around 06:00 UTC on July 23. [3]

Tropical Storm Estelle

Tropical storm (SSHWS)
EstelleJuly2819760415UTC.gif   Estelle 1976 track.png
DurationJuly 27 – July 28
Peak intensity40 mph (65 km/h) (1-min);

On July 24, a large area of disturbed weather developed about 1,035 miles (1,666 km) southwest of Acapulco, Guerrero. This complex became composed of two distinctly separate areas of low pressure late on July 26. [2] The eastern circulation organized into a tropical depression around 00:00 UTC on July 27 and further strengthened into Tropical Storm Estelle six hours later. Moving swiftly toward the west, the system failed to intensify beyond minimal tropical storm intensity, instead weakening to a tropical depression again by 06:00 UTC on July 28 as it moved into cooler waters. After losing its convective structure, Estelle dissipated around 00:00 UTC on July 29. [2] [3]

Tropical Storm Fernanda

Tropical storm (SSHWS)
FernandaJuly2819760415UTC.gif   Fernanda 1976 track.png
DurationJuly 28 – August 2
Peak intensity40 mph (65 km/h) (1-min);

Fernanda developed out of the same area of disturbed weather that first formed on July 24 and split into two separate circulations two days later. While the easternmost low organized into Tropical Storm Estelle, [2] the western circulation developed into a tropical depression by 00:00 UTC on July 28. It intensified into a tropical storm six hours later. Like Estelle, however, the cyclone failed to intensify beyond minimal tropical storm strength. The compact storm instead weakened to a tropical depression by 18:00 UTC on July 29, shortly before it entered the Central Pacific Hurricane Center's area of responsibility. [2] It dissipated around 00:00 UTC on August 2. [3]

Tropical Storm Gwen

Tropical storm (SSHWS)
Gwenaug9197623z.png   Gwen 1976 track.png
DurationAugust 5 – August 18
Peak intensity65 mph (100 km/h) (1-min);

An area of disturbed weather formed roughly 435 miles (700 km) south of Acapulco, Guerrero, on August 3. [2] The westward-moving disturbance organized into a tropical depression by 00:00 UTC on August 5 and further developed into Tropical Storm Gwen about 24 hours later. The newly named storm continued to intensify, reaching peak winds of 65 mph (105 km/h) on August 8. [3] Thereafter, a deceleration of the storm's forward speed over a patch of colder waters prompted weakening, and Gwen fell to tropical depression strength early on August 11. Rapidly-developing Hurricane Hyacinth to its east forced the weak cyclone to move abruptly north, [2] during which time Gwen regained its status as a tropical storm around 18:00 UTC on August 12. [3] This redevelopment was short-lived, as Gwen weakened to a tropical depression yet again on August 14 as it absorbed the weakening Hyacinth and crossed into the Central Pacific Hurricane Center's area of responsibility. [2] Gwen moved westward and passed north of the Hawaiian Islands before dissipating around 06:00 UTC on August 18. [3]

Hurricane Hyacinth

Category 3 hurricane (SSHWS)
Hyacinthaug9197623z.png   Hyacinth 1976 track.png
DurationAugust 6 – August 14
Peak intensity115 mph (185 km/h) (1-min);

An area of disturbed weather formed well south of Mexico around 18:00 UTC on August 5. [2] It intensified into a tropical depression 24 hours later and further organized into Tropical Storm Hyacinth by 06:00 UTC on August 7. On a west-northwest track, the storm continued to strengthen and became a hurricane around 12:00 UTC on August 9, [3] after which time a small yet distinct eye became evident on satellite imagery. [2] Hyacinth attained its peak as a Category 3 hurricane with winds of 115 mph (185 km/h) the next day, [3] but soon began to weaken as it rapidly moved toward cooler waters. [2] It weakened to a tropical storm early on August 13 and further degraded to a tropical depression on August 14 before being absorbed by nearby Tropical Storm Gwen around 06:00 UTC that day. [2] [3]

Hurricane Iva

Category 4 hurricane (SSHWS)
IvaAugust2819760615UTC.gif   Iva 1976 track.png
DurationAugust 24 – September 1
Peak intensity130 mph (215 km/h) (1-min);

Late on August 23, an area of disturbed weather developed about 485 miles (781 km) south of Acapulco, Guerrero. [2] It rapidly coalesced into a tropical depression around 00:00 UTC the next day, but only slowly strengthened into Tropical Storm Iva by 18:00 UTC on August 25. [3] The system moved west and then west-northwest, further developing into a hurricane by 18:00 UTC on August 26 as a small eye became distinct. [2] Iva attained major hurricane strength late on August 27, further intensifying to its peak as a Category 4 hurricane with winds of 130 mph (210 km/h) around 06:00 UTC the following morning. [3] It oscillated in strength over the subsequent 24 hours, but ultimately began a steady weakening trend by August 30 while passing over marginal ocean temperatures. [2] Iva fell to tropical storm strength early that day, weakened to a tropical depression early on September 1, and dissipated around 00:00 UTC on September 2. [3]

Tropical Storm Joanne

Tropical storm (SSHWS)
JoanneSeptember419760015UTC.gif   Joanne 1976 track.png
DurationAugust 29 – September 7
Peak intensity50 mph (85 km/h) (1-min);

A tropical disturbance formed about 175 miles (282 km) west of the coastline of Colombia early on August 26. The large system moved steadily west, [2] developing into a tropical depression by 00:00 UTC on August 29. Over the course of the next several days, the depression failed to intensify further as it moved erratically. Finally, by 12:00 UTC on September 3, the depression strengthened into Tropical Storm Joanne. After reaching peak winds of 50 mph (80 km/h), the storm moved generally west-southwest and weakened. It degraded to a tropical depression early on September 5 and maintained its status as a weak tropical cyclone until dissipating around 00:00 UTC on September 8. [3]

Hurricane Kathleen

Category 1 hurricane (SSHWS)
KathleenSeptember919760415UTC.gif   Kathleen 1976 track.png
DurationSeptember 7 – September 10
Peak intensity80 mph (130 km/h) (1-min);
986  mbar  (hPa)

Kathleen formed from an area of disturbed weather that was first identified roughly 345 miles (555 km) southwest of Acapulco, Guerrero, on September 6. [2] The disturbance organized into a tropical depression around 12:00 UTC on September 7 and further intensified into Tropical Storm Kathleen twelve hours later as it began to move northwestward. Despite fluctuations in strength over the next day, Kathleen intensified into a Category 1 hurricane around 00:00 UTC on September 10, [3] when a reconnaissance aircraft measured peak winds of 80 mph (130 km/h). An accelerating forward motion brought the cyclone over Point Eugenia as a moderate tropical storm early on September 10. It continued onshore about 160 miles (260 km) south of Ensenada, Baja California, [2] ultimately losing its status as a tropical cyclone by 18:00 UTC. [3] The remnants of the storm continued north across Arizona and Nevada on September 11. [2]

Hurricane Kate

Category 2 hurricane (SSHWS)
Katesep261976.png   Kate 1976 track.png
DurationSeptember 21 – October 2
Peak intensity100 mph (155 km/h) (1-min);
971  mbar  (hPa)

The only hurricane to form in the central Pacific arose from a disturbance that drifted in from the east. Tropical Depression Twenty-two formed on September 22. The depression became Tropical Storm Kate the next day. [4] Kate headed almost due northwest. Early on September 24, the storm became a hurricane. This prompted a hurricane watch being issued for the Big Island on September 28. The watch continued until Kate was downgraded to a storm on September 29. It passed 200 miles northwest of the island and was destroyed by wind shear on October 2. [1]

There was only minor damage reported to the northern and eastern shores of Oahu, Maui, and Hawaii due to heavy surf. A ship called the Hawaiian Princess was caught by gales caused by Kate but escaped. [1]

Hurricane Liza

Category 4 hurricane (SSHWS)
Hurricane Liza (1976) Colored.jpg   Liza 1976 Path.png
DurationSeptember 25 – October 1
Peak intensity140 mph (220 km/h) (1-min);
948  mbar  (hPa)

The deadliest and most destructive hurricane of the 1976 season originated as a large tropical disturbance about 525 miles (845 km) southwest of Acapulco, Guerrero, on September 25. [2] It developed into a tropical depression around 18:00 UTC that day and steadily strengthened into Tropical Storm Liza 24 hours later. [3] The incipient cyclone turned toward the north while continuing over warm waters, [2] and it attained hurricane strength by 00:00 UTC on September 28. Liza intensified into a major hurricane on September 29, [3] and a reconnaissance aircraft measured peak winds of 140 mph (230 km/h) around 18:00 UTC, when the storm was in the midst of an eyewall replacement cycle. [2] Liza maintained Category 4 intensity until early on October 1 when it moved ashore the coastline of Mexico north of Los Mochis, Sinaloa, as a slighter weaker Category 3 cyclone. Liza rapidly weakened over the mountainous terrain and was last tracked as a tropical cyclone at 12:00 UTC on October 1. [2] [3]

Hurricane Madeline

Category 4 hurricane (SSHWS)
Hurricane Madeline (1976).jpg   Madeline 1976 track.png
DurationSeptember 29 – October 8
Peak intensity145 mph (230 km/h) (1-min);
940  mbar  (hPa)

A tropical disturbance was first noted about 345 miles (555 km) south of the Guatemalan coastline on September 27. [2] It organized into Tropical Storm Madeline by 00:00 UTC on September 29 but failed to further develop, instead weakening to a tropical depression the next morning. By 00:00 UTC on October 4, Madeline re-intensified into a tropical storm, beginning a gradual curve toward the north as well. The system continued to strengthen and became a hurricane early on October 6; by 06:00 UTC on October 8, Madline peaked as a Category 4 hurricane with winds of 145 mph (233 km/h). It moved onshore the coastline of Mexico a few hours later, rapidly weakening and losing its status as a tropical cyclone after 18:00 UTC that day. [3]

Tropical Storm Naomi

Tropical storm (SSHWS)
NaomiOctober2819761045UTC.gif   Naomi 1976 track.png
DurationOctober 25 – October 29
Peak intensity50 mph (85 km/h) (1-min);
≤1005  mbar  (hPa)

The last storm of the season began as a tropical disturbance roughly 920 miles (1,480 km) south-southwest of Mazatlán, Sinaloa, late on October 22. It originally moved west but later curved toward the north, [2] developing into a tropical depression around 12:00 UTC on October 25, and further intensifying into Tropical Storm Naomi six hours later. By 18:00 UTC on October 27, Naomi had reached peak winds of 50 mph (80 km/h). [3] In the presence of wind shear, the cyclone slowly weakened thereafter, moving ashore the coastline of Mexico near Mazatlán as a minimal tropical storm early on October 29. [2] Naomi rapidly weakened once inland and was last tracked as a tropical cyclone around 12:00 UTC that day. [3]

Other systems

There were four tropical depressions during the 1976 season. The first lasted from June 1–3 over the open eastern Pacific. The second existed from June 28–30, originating in the Gulf of Tehuantepec and making landfall near Salina Cruz, Oaxaca, before dissipating. The third occurred from August 7–8 in the far western reaches of the East pacific while the fourth and final depression was active from August 16–19 well southwest of Baja California. [2]

Storm names

The following names were used for named storms that formed in the eastern Pacific in 1976. It is the same list used in the 1972 season. No names were retired from this list. However, as modern naming began in 1978, this is the last time this list was used, though names Estelle, Fernanda, Madeline, Pauline, Tara and Willa were recycled into modern naming lists.

  • Annette
  • Bonny
  • Celeste
  • Diana
  • Estelle
  • Fernanda
  • Gwen
  • Orla (unused)
  • Pauline (unused)
  • Rebecca (unused)
  • Simone (unused)
  • Tara (unused)
  • Valerie (unused)
  • Willa (unused)

The central Pacific used names and numbers from the western Pacific typhoon name list. Kate was the only name required.

See also

Related Research Articles

<span class="mw-page-title-main">2005 Pacific hurricane season</span> Hurricane season in the Pacific Ocean

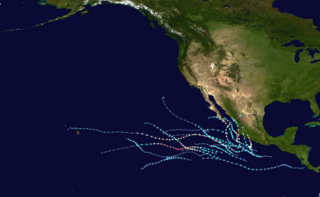
The 2005 Pacific hurricane season was a near-average Pacific hurricane season which produced fifteen named storms, seven hurricanes and two major hurricanes. It was also the second consecutive season in which no tropical cyclone of at least tropical storm intensity made landfall. The season officially began on May 15 in the East Pacific Ocean, and on June 1 in the Central Pacific; they ended on November 30. These dates conventionally delimit the period of each year when most tropical cyclones form in the Pacific basin. However, the formation of tropical cyclones is possible at any time of the year.

<span class="mw-page-title-main">2003 Pacific hurricane season</span> Hurricane season in the Pacific Ocean

The 2003 Pacific hurricane season was the first season to feature no major hurricanes since 1977. The season officially began on May 15, 2003 in the Eastern North Pacific, and on June 1 in the Central ; both ended on November 30. These dates, adopted by convention, historically describe the period in each year when most tropical cyclogenesis occurs in these regions of the Pacific. The season featured 16 tropical storms, 7 of which intensified into hurricanes, which was then considered an average season. Damage across the basin reached US$129 million, and 23 people were killed by the storms.

<span class="mw-page-title-main">1999 Pacific hurricane season</span> Hurricane season in the Pacific Ocean

The 1999 Pacific hurricane season was one of the least active Pacific hurricane seasons on record. The season officially began on May 15 in the Eastern Pacific, and on June 1 in the Central Pacific; in both basins, it ended on November 30. These dates conventionally delimit the period during which most tropical cyclones form in the northeastern Pacific Ocean. The first tropical cyclone of the season, Hurricane Adrian, developed on June 18, while the final storm of the season, Tropical Storm Irwin, dissipated on October 11. No storms developed in the Central Pacific during the season. However, two storms from the Eastern Pacific, Dora and Eugene, entered the basin, with the former entering as a hurricane and becoming the second farthest travelling Pacific hurricane on record.

<span class="mw-page-title-main">1993 Pacific hurricane season</span> Hurricane season in the Pacific Ocean

The 1993 Pacific hurricane season included more than double the average number of major hurricanes – Category 3 or stronger cyclones on the Saffir–Simpson scale. This activity was the result of an El Niño event, which is the main factor contributing to above-average activity across the Pacific basin. The season featured 15 named storms, 11 hurricanes, and 9 major hurricanes. While the number of named storms was near the long-term average, the number of hurricanes was above the average of 8, and the number of major hurricanes far exceeded the long-term average of 4. Seasonal activity began on May 17 and ended on November 8, within the confines of a traditional hurricane season which begins on May 15 in the East Pacific and June 1 in the Central Pacific. The season ends on November 30 in both basins. These dates conventionally delimit the period during each year when most tropical cyclones form.

<span class="mw-page-title-main">1987 Pacific hurricane season</span> Hurricane season in the Pacific Ocean

The 1987 Pacific hurricane season was the last year in which the Eastern Pacific Hurricane Center was the primary warning center for tropical cyclones in the eastern Pacific Ocean. The season officially started May 15, 1987, in the eastern Pacific, and June 1, 1987, in the central Pacific, and lasted until November 30, 1987. These dates conventionally delimit the period of each year when the vast majority of tropical cyclones form in the northeastern Pacific Ocean.

<span class="mw-page-title-main">1986 Pacific hurricane season</span> Hurricane season in the Pacific Ocean

The 1986 Pacific hurricane season featured several tropical cyclones that contributed to significant flooding to the Central United States. The hurricane season officially started May 15, 1986, in the eastern Pacific, and June 1, 1986 in the central Pacific, and lasted until November 30, 1986 in both regions. These dates conventionally delimit the period of each year when most tropical cyclones form in the northeastern Pacific Ocean. A total of 17 named storms and 9 hurricanes developed during the season; this is slightly above the averages of 15 named storms and 8 hurricanes, respectively. In addition, 26 tropical depressions formed in the eastern Pacific during 1986, which, at the time, was the second most ever recorded; only the 1982 Pacific hurricane season saw a higher total.

<span class="mw-page-title-main">1985 Pacific hurricane season</span> Hurricane season in the Pacific Ocean

The 1985 Pacific hurricane season is the third-most active Pacific hurricane season on record. It officially started on May 15, 1985, in the eastern Pacific, and on June 1, 1985, in the central Pacific, and lasted until November 30, 1985. These dates conventionally delimit the period of each year when most tropical cyclones form in the northeastern Pacific Ocean. At the time, the 1985 season was the most active on record in the eastern north Pacific, with 28 tropical cyclones forming. Of those, 24 were named, 13 reached hurricane intensity, and 8 became major hurricanes by attaining Category 3 status or higher on the Saffir–Simpson scale. At that time, the 24 named storms was a record; however, this record was broken seven years later in 1992, and was therefore recognized as the second busiest season within the basin, until it was surpassed exactly thirty years later by the 2015 season.

<span class="mw-page-title-main">1984 Pacific hurricane season</span> Hurricane season in the Pacific Ocean

The 1984 Pacific hurricane season featured numerous tropical cyclones, several of which were impactful to land. It was a busy hurricane season with 21 named storms, 13 hurricanes, and 7 major hurricanes, the latter of which are Category 3 or stronger cyclones on the Saffir–Simpson scale. This activity was unusual given the presence of a La Niña, which typically suppresses Central and East Pacific tropical cyclone activity, and only average sea surface temperatures. Seasonal activity began on May 17 and ended on November 8. This lies within the confines of a traditional hurricane season which begins on May 15 in the East Pacific and June 1 in the Central Pacific, and ends on November 30 in both basins. These dates conventionally delimit the period during each year when most tropical cyclones form.

<span class="mw-page-title-main">1977 Pacific hurricane season</span> Hurricane season in the Pacific Ocean

The 1977 Pacific hurricane season stands alongside 2010 as the least active Pacific hurricane season since reliable records began in 1971. Only eight tropical storms formed throughout the year; four further intensified into hurricanes, yet none strengthened into major hurricanes—a Category 3 or stronger on the Saffir–Simpson scale—an occurrence not seen again until 2003. Most tropical cyclones remained over the open eastern Pacific; however, the remnants of hurricanes Doreen and Heather led to heavy rainfall which damaged or destroyed structures and flooded roadways throughout the Southwest United States. Notably, Hurricane Anita which originally formed in the Gulf of Mexico made the rare trek across Mexico into the eastern Pacific, briefly existing as a tropical depression. Eight deaths were recorded while damage reached $39.6 million.

<span class="mw-page-title-main">1979 Pacific hurricane season</span> Hurricane season in the Pacific Ocean

The 1979 Pacific hurricane season was an inactive season, featuring 10 named storms, 6 hurricanes, and 4 major hurricanes. It featured zero tropical cyclones in the Central Pacific, the most recent occurrence on record as of 2023. An average year sees four to five tropical cyclones in that basin.

<span class="mw-page-title-main">1978 Pacific hurricane season</span> Hurricane season in the Pacific Ocean

The 1978 Pacific hurricane season was the first Pacific hurricane season to use both masculine and feminine names for tropical cyclones. It also began the modern practice of utilizing naming lists every six years. Despite lacking an El Niño, a common driver of enhanced activity in the East and Central Pacific basins, the 1978 season was active. It featured 19 named storms, 14 hurricanes, and 7 major hurricanes, the latter of which are Category 3 or stronger cyclones on the Saffir–Simpson scale. Within the confines of the Central Pacific basin, located between the International Date Line and 140°W, 13 tropical cyclones or their remnants were observed by forecasters at the Central Pacific Hurricane Center, a record number of occurrences at the time. Seasonal activity began on May 30 and ended on October 21, within the limits of a traditional hurricane season which begins on May 15 in the East Pacific and June 1 in the Central Pacific. The season ends on November 30 in both basins. These dates conventionally delimit the period during each year when most tropical cyclones form.

<span class="mw-page-title-main">2011 Pacific hurricane season</span> Hurricane season in the Pacific Ocean

The 2011 Pacific hurricane season was a below average season in terms of named storms, although it had an above average number of hurricanes and major hurricanes. During the season, 13 tropical depressions formed along with 11 tropical storms, 10 hurricanes and 6 major hurricanes. The season officially began on May 15 in the East Pacific Ocean, and on June 1 in the Central Pacific; they both ended on November 30. These dates conventionally delimit the period of each year when most tropical cyclones form in the Pacific basin. The season's first cyclone, Hurricane Adrian formed on June 7, and the last, Hurricane Kenneth, dissipated on November 25.

<span class="mw-page-title-main">2012 Pacific hurricane season</span> Hurricane season in the Pacific Ocean

The 2012 Pacific hurricane season was a moderately active Pacific hurricane season that saw an unusually high number of tropical cyclones pass west of the Baja California Peninsula. The season officially began on May 15 in the eastern Pacific Ocean, and on June 1 in the central Pacific (from 140°W to the International Date Line, north of the equator; they both ended on November 30. These dates conventionally delimit the period of each year when most tropical cyclones form in these regions of the Pacific Ocean. However, the formation of tropical cyclones is possible at any time of the year. This season's first system, Tropical Storm Aletta, formed on May 14, and the last, Tropical Storm Rosa, dissipated on November 3.

<span class="mw-page-title-main">2013 Pacific hurricane season</span> Hurricane season in the Pacific Ocean

The 2013 Pacific hurricane season was an above average Pacific hurricane season with 21 tropical cyclones forming. Of these, 20 became named storms – 18 in the Eastern Pacific basin, and 2 in the Central Pacific basin. Of the 18 named storms in the east, 9 became hurricanes, with one, Raymond, becoming the season's only major hurricane. In the central, neither named storm became a hurricane. It was also a below-normal season in terms of Accumulated cyclone energy (ACE), as many of its systems were weak and short-lived. The season officially began on May 15 in the Eastern Pacific and started on June 1 in the Central Pacific; both ended on November 30. These dates conventionally delimit the period of each year when most tropical development occurs in these North Pacific basins. The first cyclone, Tropical Storm Alvin, formed on May 15, and the last, Tropical Storm Sonia, dissipated on November 4.

<span class="mw-page-title-main">2014 Pacific hurricane season</span> Hurricane season in the Pacific Ocean

The 2014 Pacific hurricane season was the fifth-busiest season since reliable records began in 1949, alongside the 2016 season. The season officially started on May 15 in the East Pacific Ocean, and on June 1 in the Central Pacific; they both ended on November 30. These dates conventionally delimit the period of each year when most tropical cyclones form in the Pacific basin.

<span class="mw-page-title-main">2015 Pacific hurricane season</span> Hurricane season in the Pacific Ocean

The 2015 Pacific hurricane season is the second-most active Pacific hurricane season on record, with 26 named storms, only behind the 1992 season. A record-tying 16 of those storms became hurricanes, and a record 11 storms further intensified into major hurricanes throughout the season. The Central Pacific, the portion of the Northeast Pacific Ocean between the International Date Line and the 140th meridian west, had its most active year on record, with 16 tropical cyclones forming in or entering the basin. Moreover, the season was the third-most active season in terms of accumulated cyclone energy, amassing a total of 290 units. The season officially started on May 15 in the Eastern Pacific and on June 1 in the Central Pacific; they both ended on November 30. These dates conventionally delimit the period of each year when most tropical cyclones form in the Northeast Pacific basin. However, the formation of tropical cyclones is possible at any time of the year. This was shown when a tropical depression formed on December 31. The above-average activity during the season was attributed in part to the very strong 2014–16 El Niño event.

<span class="mw-page-title-main">Timeline of the 2010 Pacific hurricane season</span>

The 2010 Pacific hurricane season was one of the least active seasons on record, featuring the fewest named storms since 1977. The season officially started on May 15 in the eastern Pacific—east of 140°W—and on June 1 in the central Pacific—between the International Date Line and 140°W—and lasted until November 30. These dates typically cover the period of each year when most tropical cyclones form in the eastern Pacific basin. The season's first storm, Tropical Storm Agatha, developed on May 29; the season's final storm, Tropical Storm Omeka, degenerated on December 21.

<span class="mw-page-title-main">2019 Pacific hurricane season</span> Hurricane season in the Pacific Ocean

The 2019 Pacific hurricane season was an above average season which produced nineteen named storms, most of which were rather weak and short-lived. Only seven hurricanes formed, the fewest since 2010. The season officially began on May 15 in the East Pacific Ocean, and on June 1 in the Central Pacific; they both ended on November 30. These dates conventionally delimit the period of each year when most tropical cyclones form in the Pacific basin. This season was one of the latest-starting Pacific hurricane seasons on record, with the first tropical cyclone, Hurricane Alvin, forming on June 25. The final system, Tropical Depression Twenty-One-E, dissipated on November 18.

<span class="mw-page-title-main">2020 Pacific hurricane season</span> Hurricane season in the Pacific Ocean

The 2020 Pacific hurricane season was a near average Pacific hurricane season in terms of named storms, featuring 17, but well below average season for hurricanes and major hurricanes, with only 4 hurricanes and 3 major hurricanes forming. Additionally, no tropical cyclones formed in the Central Pacific basin for the first time since 2017. The season officially began on May 15 in the East Pacific Ocean, and on June 1 in the Central Pacific (from 140°W to the International Date Line, north of the equator; they both ended on November 30. These dates conventionally delimit the period of each year when most tropical cyclones form in the respective regions. However, the formation of tropical cyclones is possible at any time of the year, as illustrated in 2020 by the formation of the season's first system, Tropical Depression One-E, on April 25. This was the earliest formation of a tropical cyclone on record in the eastern Pacific basin proper. The final system of the season was Tropical Storm Polo, which dissipated on November 19.

<span class="mw-page-title-main">2021 Pacific hurricane season</span> Hurricane season in the Pacific Ocean

The 2021 Pacific hurricane season was a moderately active Pacific hurricane season, with above-average activity in terms of number of named storms, but below-average activity in terms of major hurricanes, as 19 named storms, 8 hurricanes, and 2 major hurricanes formed in all. It also had a near-normal accumulated cyclone energy (ACE). The season officially began on May 15, 2021 in the Eastern Pacific Ocean, and on June 1, 2021, in the Central Pacific in the Northern Hemisphere. The season ended in both regions on November 30, 2021. These dates historically describe the period each year when most tropical cyclogenesis occurs in these regions of the Pacific and are adopted by convention. However, the formation of tropical cyclones is possible at any time of the year, as illustrated by the formation of Tropical Storm Andres on May 9, which was the earliest forming tropical storm on record in the Eastern Pacific. Conversely, 2021 was the second consecutive season in which no tropical cyclones formed in the Central Pacific.

References

  1. 1 2 3 Central Pacific Hurricane Center archive accessed March 11, 2006
  2. 1 2 3 4 5 6 7 8 9 10 11 12 13 14 15 16 17 18 19 20 21 22 23 24 25 26 27 28 29 30 31 32 33 34 35 Emil L. Gunther (April 1977). "Eastern North Pacific Tropical Cyclones of 1976". Monthly Weather Review (PDF). American Meteorological Society. 105 (4): 508–522. Bibcode:1977MWRv..105..508G. doi: 10.1175/1520-0493(1977)105<0508:EPTCO>2.0.CO;2 .
  3. 1 2 3 4 5 6 7 8 9 10 11 12 13 14 15 16 17 18 19 20 21 22 23 24 25 26 27 28 29 30 31 32 National Hurricane Center; Hurricane Research Division; Central Pacific Hurricane Center (April 4, 2023). "The Northeast and North Central Pacific hurricane database 1949–2022". United States National Oceanic and Atmospheric Administration's National Weather Service. A guide on how to read the database is available here. PD-icon.svg This article incorporates text from this source, which is in the public domain.
  4. Pao-Shin Chu; Peng Wu (2008). Climatic Atlas of Tropical Cyclone Tracks over the Central North Pacific (PDF) (Report). University of Hawaii-Manoa. Retrieved August 2, 2015.