1972 Pacific hurricane season

Last updated

1972 Pacific hurricane season
1972 Pacific hurricane season summary map.png
Season summary map
Seasonal boundaries
First system formedJune 1, 1972
Last system dissipatedNovember 20, 1972
Strongest storm
Name Celeste
  Maximum winds130 mph (215 km/h)
(1-minute sustained)
  Lowest pressure940 mbar (hPa; 27.76 inHg)
Seasonal statistics
Total depressions20
Total storms14
Hurricanes9
Major hurricanes
(Cat. 3+)
4
Total fatalities1
Total damageAt least $75,000 (1972 USD)
Related articles
Pacific hurricane seasons
1970, 1971, 1972, 1973, 1974

The 1972 Pacific hurricane season was an ongoing event in tropical cyclone meteorology. There were few notable storms this year. Only one person was killed and storm effects were almost not serious at all. The most notable systems were Hurricane Celeste and Joanne. Celeste was the strongest storm of the season, and caused heavy damage to Johnston Atoll. Hurricane Joanne brought gale-force winds to the Continental United States and caused flooding in Arizona and northern Mexico, which killed one person. The only other system to directly impact land was Hurricane Annette.

Contents

The season began on May 15, 1972, in the east Pacific, and on June 1, 1972, in the central Pacific. It ended on November 30, 1972. These dates conventionally delimit the period of time when tropical cyclones form in the east Pacific Ocean. This season had a below average number of storms. There were twenty tropical cyclones, four of which were in the central Pacific. Of those, four were tropical storms, eight were hurricanes, and four were major hurricanes that reached Category 3 or higher on the Saffir–Simpson hurricane scale. In the central Pacific, two tropical storms and two tropical depressions formed. One of the depressions and one of the storms crossed the International Date Line to become typhoons in the 1972 Pacific typhoon season.

Timeline

Hurricane Joanne (1972)Hurricane Celeste (1972)1972 Pacific hurricane season

The 1972 Pacific hurricane season began with the formation of Hurricane Annette on June 1, and the season ended with the dissipation of Tropical Depression Sixteen on November 21, spanning 173 days. In the northeastern Pacific (from the North American coastline to 140°W)[ citation needed ], one storm formed in June, one in July, six in August, two in September, and one in November. In the central Pacific (from 140°W to 180°W)[ citation needed ], one storm formed in September and one in November. This season is tied with the 1977 and 1996 seasons for the second-fewest number of tropical storms to form in the eastern Pacific in July since the start of the satellite era in 1971 [ citation needed ], behind only the 2010 season. [1] The 1972 season also shares the record for busiest November in the central Pacific with the 1957 and 1982 seasons. [1]

Systems

This ATS 1 weather satellite image of Tropical Cyclones Celeste, Diana, Estelle, and Fernanda was taken on August 18, 1972 CelesteDianaEstelleFernandaAug181972ATS1.png
This ATS 1 weather satellite image of Tropical Cyclones Celeste, Diana, Estelle, and Fernanda was taken on August 18, 1972

Of this season's fourteen named tropical cyclones, twelve formed in the eastern Pacific and two in the central. Both central Pacific tropical cyclones were tropical storms. Of the eastern Pacific systems, four were tropical storms and eight were hurricanes. Of those eight hurricanes, four were major hurricanes because they peaked as Category 3 or higher on the Saffir–Simpson hurricane scale. [1] Although these totals are below the modern long-term averages of fifteen named storms, nine hurricanes, and four major hurricanes, [2] At the time, 1972 was the central north Pacific's busiest known season. [3]

Hurricane Annette

Category 1 hurricane (SSHWS)
Hurricane Annette.JPG   Annette 1972 track.png
DurationJune 1 – June 8
Peak intensity85 mph (140 km/h) (1-min);
≤993  mbar  (hPa)

On June 1, a tropical disturbance organized into a tropical storm. It slowly moved north and then recurved to the northeast as it accelerated slightly. It intensified into a hurricane on June 4. It remained at that strength for one day. Annette then began weakening. As a tropical storm, Annette made landfall in southeast of Manzanillo on June 7. The next day, it dissipated inland. [4]

Annette brought several days of rainy weather to parts of Mexico. However, no deaths or damage were attributed to this tropical cyclone. [4]

Tropical Depression Two

Tropical Depression Two existed from June 27 to June 28. It paralleled the coast of Mexico without making landfall. [3]

Tropical Depression Three

Tropical Depression Three formed on July 4 and dissipated two days later. It moved westward while out to sea and never approached land. [3]

Tropical Storm Bonny

Tropical storm (SSHWS)
BonnyJuly2719722223UTCESSA9.png   Bonny 1972 track.png
DurationJuly 27 – July 30
Peak intensity50 mph (85 km/h) (1-min);
993  mbar  (hPa)

Only July 27, fifty days after the dissipation of Tropical Depression Annette, an area of clouds southwest of Manzanillo developed a closed circulation and became a tropical depression. The next day, it strengthened into a tropical storm. Heading generally west northwest, Bonny peaked in intensity on July 28. It weakened after that, and dissipated July 30. Bonny never came near land and caused no known impact. [4]

Hurricane Celeste

Category 4 hurricane (SSHWS)
CelesteAug181972ATS1.png   Celeste 1972 track.png
DurationAugust 6 – August 22
Peak intensity130 mph (215 km/h) (1-min);
940  mbar  (hPa)

On August 6, a tropical disturbance developed into a tropical storm, skipping the depression stage. It edged south until August 8. At that point, it turned to the west. It would continue in that general direction until it dissipated. Celeste intensified into a hurricane on August 10. It then left the Eastern Pacific Hurricane Center's area of responsibility and entered the central Pacific. [4] Celeste continued intensifying and eventually peaked as a Category 4 hurricane on the Saffir–Simpson hurricane scale. Celeste's Category 4 winds and central pressure of 940 millibars (940 hPa) made it the most intense cyclone of the season. After that, Celeste steadily weakened. [1] After turning north, it dissipated on August 22 due to wind shear. [5]

Celeste harassed several ships during its existence. The most serious incident involved a sailing vessel called the Regina Marina. On August 9, that ship was flooded and had to issue a distress call. It was spotted by a hurricane hunter and was reached and towed to safety by another ship, the Vishea Trith, and later on, the USCGC Mellon. Two people aboard the Regina Marina were treated for injuries. [4] Celeste passed close to Johnston Atoll and was the first recorded hurricane to hit that island. [3] Many buildings on the weather station on the island lost roof tiles, and parts of most buildings were sandblasted by the wind. Celeste brought the highest recorded sustained winds in the station's thirteen years of operation, and the lowest barometric pressure ever recorded at Johnston at the time. A total of 6.21 inches (160 mm) of rain was recorded by a rain gauge; this may be an underestimate due to the gauge's funnel being partly blocked by a lump of coral. [5] Program 437, an anti-satellite weapons system, was destroyed by the hurricane. [6] On Johnston, no casualties were reported due to evacuations of the island's inhabitants. High waves also pounded the Puna, Kau, and South Kona Coasts of the Big Island. An exact estimate of damage is not available. [5]

At the time, Celeste was longest-lasting Pacific hurricane with a lifespan of 16.25 days; that record was tied next season by Hurricane Doreen and outrun by Hurricane Fico in 1978. It is the ninth-longest lasting Pacific hurricane, tied with Kenneth (2005) and 1973's Doreen. [1]

Hurricane Diana

Category 2 hurricane (SSHWS)
DianaAug181972ATS1.png   Diana 1972 track.png
DurationAugust 11 – August 20
Peak intensity110 mph (175 km/h) (1-min);
968  mbar  (hPa)

On August 11, a tropical storm formed. It headed to the west northwest and strengthened into a hurricane on August 12. Diana then turned to the northwest, and peaked in intensity on August 1. It then headed west, and crossed into the central Pacific as a Category 1 hurricane. [4] Shortly after crossing the basin boundary on a path directly towards the Hawaiian Islands, Diana weakened into a tropical storm. On August 18, Diana turned to the northwest. It dissipated two days later. [5]

Diana threatened the Hawaiian Islands enough to warrant the issuance of a tropical storm warning. Although it never made landfall, Diana dumped very heavy rain on the Big Island, though without flooding; the highest total was 10 inches (250 mm) somewhere northeast of Hilo. At Vacationland, surf swept four homes off their foundations, doing extensive damage to one of them. Another home was flooded. Debris was carried inland, and 200 feet (60 m) of private roads were washed away. [5] The cost of damage to the extensively damaged house was $75,000 (1972 USD; $546,3012024 USD), furnishings excluded. [3]

Hurricane Estelle

Category 1 hurricane (SSHWS)
EstelleAug181972ATS1.gif   Estelle 1972 track.png
DurationAugust 15 – August 22
Peak intensity80 mph (130 km/h) (1-min);
1004  mbar  (hPa)

A swirl of thunderstorms near Clipperton Island became a tropical depression on August 15. It moved generally northwest. The depression strengthened into a tropical storm on August 16. Estelle continued to intensify, and became a hurricane on August 19. After peaking the next day, Estelle slowly weakened. It became a tropical storm on August 20 and dissipated two days later. Hurricane Estelle spent its entire life well away from inhabited land, and consequently caused no deaths or damage. [4]

Hurricane Fernanda

Category 3 hurricane (SSHWS)
FernandaAug231972ATS1.gif   Fernanda 1972 track.png
DurationAugust 20 – September 1
Peak intensity115 mph (185 km/h) (1-min);
≤948  mbar  (hPa)

An area of disturbed weather was witnessed well south of mainland Mexico on August 18. [7] The system developed into a tropical storm on August 20. It slowly strengthened, moving generally west-northwest, and became a hurricane on August 22. It continued strengthening, and was briefly a Category 3 major hurricane on 24. Fernanda weakened after that, and it was a tropical storm by the time it crossed 140°W and entered the central Pacific. [4] It remained at a steady intensity until it rapidly weakened when north of Kauai on September 1. A flash flood on Waipio Stream in the Big Island's Kohala Mountains may have been due to Fernanda. Other than that, this tropical cyclone caused no known impact. [5]

Hurricane Gwen

Category 3 hurricane (SSHWS)
GwenAug211972.gif   Gwen 1972 track.png
DurationAugust 22 – August 31
Peak intensity125 mph (205 km/h) (1-min);
≤941  mbar  (hPa)

On August 22, a tropical depression formed from a disturbance. It immediately strengthened into a storm and was named Gwen. Gwen moved generally northwest, paralleling the coast of Mexico, and intensified into a hurricane on August 24. It then spent a few days heading west-northwest before resuming its original course. The hurricane became a major hurricane on August 27. After retaining that intensity for over a day, it rapidly weakened. Gwen became a tropical storm on August 29, weakened into a depression the next day, and dissipated just after that. Hurricane Gwen caused some concern for high surf in California, including a forecast for storm surge, but only the high surf materialized. Hurricane Gwen caused no deaths or damage. [4]

Hurricane Hyacinth

Category 3 hurricane (SSHWS)
HyacinthSep31972.gif   Hyacinth 1972 track.png
DurationAugust 28 – September 7
Peak intensity125 mph (205 km/h) (1-min);
≤962  mbar  (hPa)

A circulation south of the Gulf of Tehuantepec organized into a tropical depression on August 28. It moved west for a day and then turned to the west northwest. It intensified into a tropical storm on August 29 and a hurricane the next day. Hyacinth peaked as a Category 3 major hurricane on August 31 through September 1. It then weakened. It also began to recurve to the north and then the northeast. Hyacinth reached its westernmost point on September 4 while a tropical storm. On September 6, it weakened into a tropical depression. It then made landfall north of San Diego, California, as a depression later that day, but it was nearly dissipated. [4]

Hyacinth caused increased surf along the coast of California, [8] but was otherwise without serious effects. [4] Tropical Depression Hyacinth's landfall was the first in California since 1939. [1] [9]

Tropical Storm Iva

Tropical storm (SSHWS)
IvaSeptember1519722117UTCESSA9.gif   Iva 1972 track.png
DurationSeptember 14 – September 22
Peak intensity50 mph (85 km/h) (1-min);
≤999  mbar  (hPa)

South of Salina Cruz, a tropical depression formed on September 14. It paralleled the coast of Mexico until it strengthened into a tropical storm on September 16. Iva spent three days barely moving. On August 19, Iva got caught in the trade winds, headed westwards out to sea, and promptly weakened into a depression. By September 22 it was just a mass of clouds. Iva did not come near land and had no appreciable impact. [4]

Tropical Storm June

Tropical storm (SSHWS)
June 1972 track.png  
DurationSeptember 24 – September 28
Peak intensity60 mph (95 km/h) (1-min);

A northwestward-moving disturbance in the Intertropical Convergence Zone developed into a tropical depression on September 24 and a storm two days later. It never strengthened much, and rapidly weakened on September 28. Tropical Storm June passed southwest of Johnston Island on September 27, but was too feeble to cause damage, only bringing gusty breezes and some rain. [5]

Unnamed tropical depression

Tropical depression (SSHWS)
TDOct11972.gif  
DurationSeptember 28 – October 3
Peak intensity35 mph (55 km/h) (1-min);

A tropical depression formed September 28 east of the Hawaiian Islands. It headed towards the archipelago and dissipated on the afternoon of October 3. Later that day, its remnants dumped up to 10.5 in (270 mm) of rain on the mountains of the Big Island. [5]

Hurricane Joanne

Category 2 hurricane (SSHWS)
JoanneOct219722233UTC.gif   Joanne 1972 track.png
DurationSeptember 30 – October 7
Peak intensity100 mph (155 km/h) (1-min);
≤971  mbar  (hPa)

A westward-moving area of squalls south of Mexico organized into a tropical depression on September 30. It then strengthened into a tropical storm and was named Joanne. Joanne moved west northwest, and intensified into a hurricane on October 1. It then peaked as a Category 2 hurricane on October 2. Joanne then slowed down and began to recurve, first to the north, and then the north northeast. While accelerating in that direction, Joanne made landfall near Laguna Chapala on the Baja California Peninsula as a tropical storm. [4] Joanne managed to retain a closed circulation and bring tropical storm force winds to Arizona, the first recorded time that had happened. [10] The tropical storm dissipated inland over Sonora on October 7. [4] Joanne is one of only four known Pacific hurricanes to bring gale-force winds to the Continental United States, and was the first since the 1939 California tropical storm. [11]

Heavy rainfall was reported throughout Arizona. Over 5 inches (100 mm) was measured at the Mogollon Rim. Heavy rains were recorded elsewhere in the region. The rains caused flooding in the areas of Clifton, Duncan, and Safford. [10] The highest total in Mexico was 9.45 in (240 mm) in San Felipe/Mexicali, while the highest total in the United States was 4.34 in (110 mm) in Sierra Ancha. [12] Joanne also caused heavy surf in California. [13] A young man in Phoenix was electrocuted and killed when he attempted to remove a downed power line from his car. [14] [15]

Tropical Depression Thirteen

Tropical Depression Thirteen formed on October 12. It first headed southwest, then west, and performed a cyclonic loop. It headed north before sharply recurving. It dissipated on October 18. [3]

Tropical Storm Kathleen

Tropical storm (SSHWS)
KathleenOct1719722151UTCESSA9.gif   Kathleen 1972 track.png
DurationOctober 18 – October 19
Peak intensity45 mph (75 km/h) (1-min);

On October 18, a vortex in the Intertropical Convergence Zone was determined to be a tropical storm through the use of satellite pictures. [4] Kathleen was a tropical storm for only eighteen hours before weakening into a tropical depression and recurving to the northeast. [1] The tropical cyclone dissipated on October 19 while out to sea west of Puerto Vallarta. No deaths or damages were reported. [4]

Tropical Depression Olga

Tropical depression (SSHWS)
OlgaOct2419720343UTCESSA9.gif   Olga 1972 track.png
DurationOctober 19 – October 19
Peak intensity35 mph (55 km/h) (1-min);

On October 16, the northern hemisphere component of a "cyclone twin" was classified by JTWC as a tropical depression while located near 7.0°N 179°W, just within the central Pacific basin. [5] [16] After crossing the International Date Line, it intensified into Tropical Storm Olga of the 1972 Pacific typhoon season. After passing through the Marshalls as a tropical storm, Olga intensified into a typhoon on October 25. It then swung through part of the Northern Marianas Islands before it was absorbed by a front near Honshū on October 29. As the NMI had already been hit by Typhoon Marie three weeks earlier, little damage was reported. [5]

Hurricane Ruby

Category 1 hurricane (SSHWS)
RubyNov1619720310UTC.gif   Ruby 1972 track.png
DurationNovember 12 – November 14
Peak intensity80 mph (130 km/h) (1-min);

An area of enhanced convection in the ITCZ close to the equator formed into a tropical depression on November 11. It headed north northwest, and intensified into Tropical Storm Ruby on November 13. Ruby then abruptly turned west and crossed the dateline, briefly reaching hurricane status. [5] [16] After becoming a typhoon just after crossing the dateline, the first time that had happened since 1967, Ruby steadily strengthened and eventually peaked as a moderately intense typhoon on November 16 while east of Taongi Atoll. It then steadily weakened as it headed west northwest, and wind shear destroyed the cyclone on November 20 when it was east of the Northern Marianas Islands. Ruby caused no deaths or damage. Of note is the fact that on November 17, Ruby had a central pressure of 983 mb (983 hPa), which is high for a 100-knot typhoon. [3]

Tropical Storm Liza

Tropical storm (SSHWS)
LizaNov1319722122UTC.gif   Liza 1972 track.png
DurationNovember 13 – November 15
Peak intensity50 mph (85 km/h) (1-min);
1007  mbar  (hPa)

A tropical depression formed south of the Gulf of Tehuantepec on November 13. It headed nearly due east and intensified into Tropical Storm Liza on November 14. Liza degenerated into a tropical wave the next day. No deaths or damages were reported. [4] Liza was a tropical storm for less than a day. [1]

Tropical Depression Sixteen

Tropical Depression Sixteen formed on November 20. It briefly headed north and then turned to the west. It dissipated on November 21. [3]

Storm names

The following list of names was used for named storms that formed in the North Pacific Ocean east of 140°W in 1972. [17] This was the same set of names used for the 1968 season. [18] No names were retired after this season, [19] thus the same list was used again for the 1976 season. [20]

  • Annette
  • Bonny
  • Celeste *
  • Diana*
  • Estelle
  • Fernanda*
  • Gwen
  • Hyacinth
  • Iva
  • Joanne
  • Kathleen
  • Liza
  • Madeline (unused)
  • Naomi (unused)
  • Orla (unused)
  • Pauline (unused)
  • Rebecca (unused)
  • Simone (unused)
  • Tara (unused)
  • Valerie (unused)
  • Willa (unused)

Two named storms, listed below, formed in the North Pacific between 140°W and the International Date Line in 1972. At the time, storm names within this region were assigned by the Joint Typhoon Warning Center on Guam. [17] [21] Named storms in the table above that crossed into the area during the season are noted (*). [16]

  • June
  • Ruby

Season effects

This is a table of all of the storms that formed in the 1972 Pacific hurricane season. It includes their name, duration, peak classification and intensities, areas affected, damage, and death totals. Deaths in parentheses are additional and indirect (an example of an indirect death would be a traffic accident), but were still related to that storm. Damage and deaths include totals while the storm was extratropical, a wave, or a low, and all of the damage figures are in 1972 USD.

Saffir–Simpson scale
TDTSC1C2C3C4C5
1973 Pacific hurricane season statistics
Storm
name
Dates activeStorm category
at peak intensity
Max 1-min
wind
mph (km/h)
Min.
press.
(mbar)
Areas affectedDamage
(USD)
DeathsRef(s)
AnnetteJune 1–8Category 1 hurricane85 (140)993MexicoNone0
TwoJune 27–28Tropical depression35 (55)UnknownNoneNone0
ThreeJuly 4–6Tropical depression35 (55)UnknownNoneNone0
BonnyJuly 27–30Tropical storm50 (85)993NoneNone0
Celeste August 6–22Category 4 hurricane130 (215)940 Hawaii, Johnston Atoll Unknown0
DianaAugust 11–20Category 2 hurricane110 (175)968 Hawaii 0.0720
EstelleAugust 15–22Category 1 hurricane80 (130)1004NoneNone0
FernandaAugust 20 – September 1Category 3 hurricane115 (185)948 Hawaii None0
GwenAugust 22–31Category 3 hurricane125 (205)941NoneNone0
HyacinthAugust 28 – September 7Category 3 hurricane125 (205)962 California None0
IvaSeptember 14–22Tropical storm50 (85)999NoneNone0
JuneSeptember 24–28Tropical storm60 (95)UnknownNoneNone0
UnnamedSeptember 28 – October 3Tropical depression35 (55)Unknown Hawaii None0
Joanne September 30 – October 7Category 2 hurricane100 (155)971Mexico, California, Arizona Unknown(1)
ThirteenOctober 12–18Tropical depression35 (55)UnknownNoneNone0
KathleenOctober 18–19Tropical storm45 (75)UnknownNoneNone0
OlgaOctober 19Tropical depression35 (55)UnknownNoneNone0
RubyNovember 12–14Category 1 hurricane80 (130)983NoneNone0
LizaNovember 13–15Tropical storm50 (85)1007NoneNone0
SixteenNovember 20–21Tropical depression35 (55)UnknownNoneNone0
Season aggregates
20 systemsJune 1 – November 20 130 (215)940Mexico, Johnston Atoll, California, Arizona, Hawaii 0.072(1) 

See also

Related Research Articles

<span class="mw-page-title-main">2002 Pacific hurricane season</span>

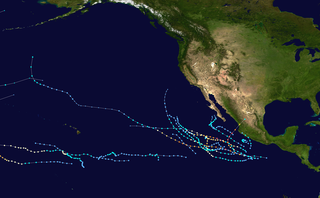
The 2002 Pacific hurricane season was a near–average season which produced fifteen named storms. Eight hurricanes formed, including a record-equaling three Category 5 hurricanes, a record it shares with the 1994 and 2018 seasons. It was also a near-average season in terms of accumulated cyclone energy (ACE), having an ACE of 125. The season officially began on May 15, 2002 in the East Pacific Ocean, and on June 1, 2002 in the Central Pacific; both ended on November 30. These dates conventionally delimit the period of each year when most tropical cyclone formation occurs in these regions of the Pacific. The first system of the 2002 season, Hurricane Alma, formed on May 24, and the last, Tropical Depression Sixteen-E, dissipated on November 16.

<span class="mw-page-title-main">1997 Pacific hurricane season</span>

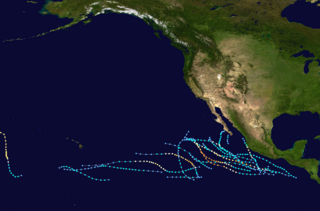
The 1997 Pacific hurricane season was a very active hurricane season. With hundreds of deaths and hundreds of millions of dollars in damage, this was one of the deadliest and costliest Pacific hurricane seasons on record. This was due to the exceptionally strong 1997–98 El Niño event. The season officially started on May 15, in the eastern Pacific, and on June 1, in the central Pacific, and lasted until November 30. These dates conventionally delimit the period of each year when almost all tropical cyclones form in the northeastern Pacific Ocean.

<span class="mw-page-title-main">1987 Pacific hurricane season</span>

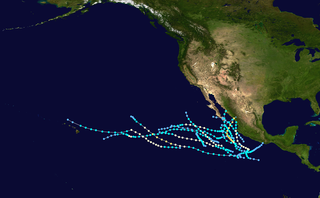
The 1987 Pacific hurricane season was the last year in which the Eastern Pacific Hurricane Center was the primary warning center for tropical cyclones in the eastern Pacific Ocean. The season officially started May 15, 1987, in the eastern Pacific, and June 1, 1987, in the central Pacific, and lasted until November 30, 1987. These dates conventionally delimit the period of each year when the vast majority of tropical cyclones form in the northeastern Pacific Ocean.

<span class="mw-page-title-main">1981 Pacific hurricane season</span>

The 1981 Pacific hurricane season was a slightly below average Pacific hurricane season. The season officially started on May 15 in the eastern Pacific basin and June 1 in the central Pacific basin. Both basins' seasons ended on November 30; these dates conventionally delimit the period during which most tropical cyclones form in the northeastern Pacific Ocean. The first tropical cyclone of the season was designated on May 30, and the final storm of the season, Hurricane Otis, dissipated on October 30. The season produced fifteen named storms and a total of eight hurricanes, which was near normal. However, the total of one major hurricane was below the average of three.

<span class="mw-page-title-main">1980 Pacific hurricane season</span>

The 1980 Pacific hurricane season officially started May 15, 1980, in the eastern Pacific and June 1, 1980, in the central Pacific, lasting until November 30, 1980. These dates conventionally delimit each year when most tropical cyclones form in the northeastern and central Pacific Ocean. This season was relatively uneventful; since no tropical cyclones made landfall, there were no reports of casualties or damage.

<span class="mw-page-title-main">1973 Pacific hurricane season</span>

The 1973 Pacific hurricane season was a below average, with twelve named tropical cyclones in total. Seven storms became hurricanes, of which three were major. The season officially started May 15, 1973, in the eastern Pacific, and June 1, 1973, in the central Pacific, and lasted until November 30, 1973. These dates conventionally delimit the period of each year when most tropical cyclones form in the northeastern Pacific Ocean.

<span class="mw-page-title-main">1976 Pacific hurricane season</span>

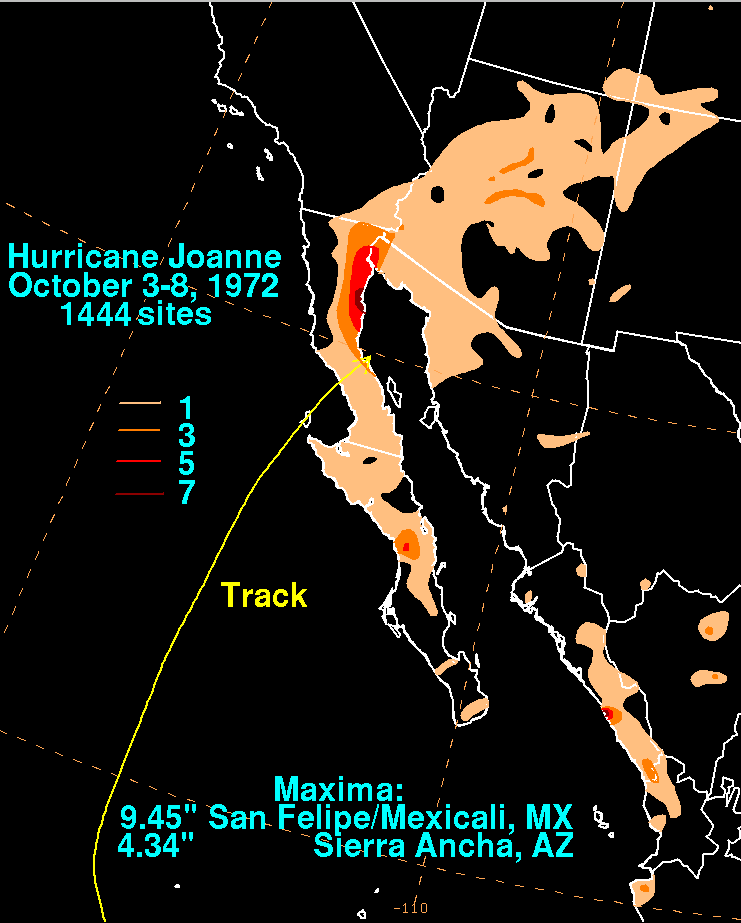
The 1976 Pacific hurricane season was a very deadly and costly season. Hurricanes Kathleen, Liza, and Madeline were the most notable storms this year. Hurricane Kathleen caused death and destruction in California and Arizona due to flooding. Hurricane Liza was the deadliest storm of the season when it killed over 600 people in Mexico. Hurricane Madeline is notable for being one of the most intense Pacific hurricanes at landfall.

<span class="mw-page-title-main">1975 Pacific hurricane season</span>

The 1975 Pacific hurricane season officially started May 15, 1975, in the eastern Pacific, and June 1, 1975, in the central Pacific, and lasted until November 30, 1975. These dates conventionally delimit the period of each year when most tropical cyclones form in the northeast Pacific Ocean.

<span class="mw-page-title-main">1994 Pacific typhoon season</span>

The 1994 Pacific typhoon season was an extremely active season in the annual cycle of tropical cyclone formation in the Western North Pacific, being the second most active season in the basin, only behind 1964. With a total of 36 tropical storms, where 20 of them reached typhoon strength and 6 further strengthening into super typhoons, during the course of the season, much like the Pacific hurricane season. The season had no official bounds and it ran year-round in 1994, but most tropical cyclones tend to form in the northwestern Pacific Ocean between May and November. Tropical storms that formed west of the date line were assigned a name by the Joint Typhoon Warning Center. The World Meteorological Organization-designated Regional Specialized Meteorological Centre for tropical cyclones for the region is the Japan Meteorological Agency. Tropical depressions that entered or formed in the Philippine area of responsibility were assigned a name by the Philippine Atmospheric, Geophysical and Astronomical Services Administration or PAGASA. This can result in some storms having two names.

<span class="mw-page-title-main">1991 Pacific typhoon season</span>

The 1991 Pacific typhoon season was a slightly above-average season with 29 tropical storms, 17 typhoons and five super typhoons forming. It was quite a catastrophic season – Typhoon Yunya impacted the Philippines in mid June while in the same time experiencing a volcanic eruption, Typhoon Mireille severely impacting Japan, which became known for being the costliest typhoon on record with US$10 billion worths of damages, and Tropical Storm Thelma on November which became one of the deadliest storms to strike the Philippines, killing at least over 5,000 people.

<span class="mw-page-title-main">1979 Pacific typhoon season</span>

The 1979 Pacific typhoon season featured the largest and most intense tropical cyclone recorded globally, Typhoon Tip. The season also used both male and female names as tropical cyclone names for the first time. Additionally, the season was slightly below-average in terms of tropical cyclone activity, with only 24 storms, 12 typhoons, and 4 super typhoons developing. The season had no official bounds; it ran year-round in 1979, but most tropical cyclones tend to form in the northwestern Pacific Ocean between June and December. These dates conventionally delimit the period of each year when most tropical cyclones form in the northwestern Pacific Ocean.

<span class="mw-page-title-main">1959 Pacific typhoon season</span>

The 1959 Pacific typhoon season was regarded as one of the most devastating years for Pacific typhoons on record, with China, Japan and South Korea sustaining catastrophic losses. It was an event in the annual cycle of tropical cyclone formation. The season had no official bounds, but tropical cyclones in the Western Pacific Ocean normally develop between May and October.

<span class="mw-page-title-main">1970 Pacific typhoon season</span>

The 1970 Pacific typhoon season has no official bounds; it ran year-round in 1970, but most tropical cyclones tend to form in the northwestern Pacific Ocean between June and December. These dates conventionally delimit the period of each year when most tropical cyclones form in the northwestern Pacific Ocean.

<span class="mw-page-title-main">1971 Pacific hurricane season</span>

The 1971 Pacific hurricane season began on May 15, 1971 in the eastern Pacific, and on June 1, 1971 in the Central Pacific ; both ended on November 30, 1971. These dates, adopted by convention, historically describe the period in each year when most tropical cyclogenesis occurs in these regions of the Pacific. It was the first year that continuous Weather satellite coverage existed over the entire Central Pacific. As such, this season is often viewed as the start year for modern reliable tropical cyclone data in the Pacific Ocean.

<span class="mw-page-title-main">1972 Pacific typhoon season</span>

The 1972 Pacific typhoon season was an above average season, producing 31 tropical storms, 24 typhoons and 2 intense typhoons. It has no official bounds; it ran year-round in 1972, but most tropical cyclones tend to form in the northwestern Pacific Ocean between June and December. These dates conventionally delimit the period of each year when most tropical cyclones form in the northwestern Pacific Ocean.

<span class="mw-page-title-main">1962 Pacific typhoon season</span>

The 1962 Pacific typhoon season had no official bounds; there was activity in every month but January, March, and June, but most tropical cyclones form in the northwestern Pacific Ocean between May and November and this conventionally delimits the season.

<span class="mw-page-title-main">1957 Pacific typhoon season</span>

The 1957 Pacific typhoon season has no official bounds; it ran year-round in 1957, but most tropical cyclones tend to form in the northwestern Pacific Ocean between June and December. These dates conventionally delimit the period of each year when most tropical cyclones form in the northwestern Pacific Ocean.

<span class="mw-page-title-main">1968 Pacific hurricane season</span>

The 1968 Pacific hurricane season ties the record for having the most active August in terms of tropical storms. It officially started on May 15, 1968, in the eastern Pacific and June 1 in the central Pacific and lasted until November 30, 1968. These dates conventionally delimit the period of each year when most tropical cyclones form in the northeastern Pacific Ocean.

<span class="mw-page-title-main">1966 Pacific hurricane season</span>

The 1966 Pacific hurricane season started on May 15, 1966, and ended November 30, 1966. The season was of little note. Hurricane Blanca traveled 4,300 miles, setting a new record. During September and October of the year, Hurricane Helga and Tropical Storms Kirsten, Lorraine, and Maggie hitting Mexico. Kirsten caused 8 deaths and US$5.6 million in damages in Mexico.

<span class="mw-page-title-main">Tropical cyclones in 2022</span>

During 2022, tropical cyclones formed in seven major bodies of water, commonly known as tropical cyclone basins. Tropical cyclones were named by various weather agencies when they attained maximum sustained winds of 35 knots. During the year, 133 systems formed, of which 87 were named. The strongest storm to form was Typhoon Nanmadol, with minimum pressure of 910 hPa (26.87 inHg). The deadliest tropical cyclone was Tropical Storm Megi, which caused 214 fatalities in the Philippines, while the costliest was Hurricane Ian, which had an estimated damage total of at least $113.1 billion after affecting Trinidad and Tobago, Venezuela, Colombia, the western part of the Greater Antilles and Southeast United States.

References

  1. 1 2 3 4 5 6 7 8 National Hurricane Center; Hurricane Research Division; Central Pacific Hurricane Center (April 26, 2024). "The Northeast and North Central Pacific hurricane database 1949–2023". United States National Oceanic and Atmospheric Administration's National Weather Service. Archived from the original on May 29, 2024. A guide on how to read the database is available here. PD-icon.svg This article incorporates text from this source, which is in the public domain.
  2. "Background Information: East Pacific Hurricane Season". Climate Prediction Center. Archived from the original on 2009-05-09. Retrieved 2009-06-01.
  3. 1 2 3 4 5 6 7 8 "Annual Typhoon Report 1972" (PDF). Joint Typhoon Warning Center. Archived from the original (PDF) on 2013-02-21. Retrieved 2014-04-05.
  4. 1 2 3 4 5 6 7 8 9 10 11 12 13 14 15 16 17 Baum, Robert (April 1973). "Eastern North Pacific Hurricane Season of 1972" (PDF). Monthly Weather Review . 101 (4). American Meteorological Society: 339–49. Bibcode:1973MWRv..101..339B. doi: 10.1175/1520-0493(1973)101<0339:ENPHSO>2.3.CO;2 . Retrieved 2009-08-09.
  5. 1 2 3 4 5 6 7 8 9 10 11 "The Central Pacific Tropical Cyclone Season of 1972". Central Pacific Hurricane Center. Archived from the original on 2009-08-03. Retrieved 2009-08-09.
  6. Chun, Clayton K.S. (1999). Shooting Down a Star (PDF). pp. 30–31. ISBN   1-58566-071-X. Archived from the original (PDF) on 2006-05-16. Retrieved 2009-08-09.
  7. Eastern and Central Pacific Hurricane Centers (March 1973). "Eastern North Pacific Tropical Cyclones, 1972". Mariners Weather Log. 17 (2). National Oceanic and Atmospheric Administration: 70.
  8. "Beaches Crowded as Holiday Begins". Oxnard Press-Courier . 1972-09-03. p. 1. Archived from the original (PDF) on 2009-08-14. Retrieved 2009-08-11.
  9. Jack Williams (2005-05-17). "Background: California's tropical storms". USA Today . Retrieved 2009-08-11.
  10. 1 2 "...Top Arizona Hurricane/Tropical Storm Events..." Archived from the original on 2009-09-29. Retrieved 2009-06-09.
  11. Michael Chenoweth & Christopher Landsea (2004). "The San Diego Hurricane of 2 October 1858" (PDF). Bulletin of the American Meteorological Society . 85 (11): 1689–1697. Bibcode:2004BAMS...85.1689C. doi:10.1175/BAMS-85-11-1689. Archived (PDF) from the original on 10 May 2009. Retrieved 2009-06-09.
  12. David M. Roth. "Hurricane Joanne – October 5–8, 1972" (GIF). Hydrometeorological Prediction Center. Archived from the original on 2008-10-19. Retrieved 2009-08-14.
  13. "Calif. Desert Normal after Flash Floods". Long Beach Press-Telegram. 1972-10-05. p. 17.
  14. "Richmond Hit 2nd time by flooding". Ocala Star-Banner . 1972-10-08. Retrieved 2014-04-05.
  15. "High Water In Virginia, Arizona". The Evening Independent . 1972-10-07. Retrieved 2014-04-05.
  16. 1 2 3 Pao-Shin Chu; Peng Wu (2008). Climatic Atlas of Tropical Cyclone Tracks over the Central North Pacific (PDF) (Report). University of Hawaii-Manoa. Retrieved August 2, 2015.
  17. 1 2 National Hurricane Operations Plan (PDF) (Report). Washington, D.C.: NOAA Office of the Federal Coordinator for Meteorological Services and Supporting Research. May 1972. pp. 100, 102. Retrieved February 27, 2024.
  18. National Hurricane Operations Plan 1968 (PDF) (Report). Washington, D.C.: Interdepartmental Committee for Meteorological Services. May 1968. p. 62. Retrieved February 5, 2024.
  19. "Tropical Cyclone Naming History and Retired Names". Miami, Florida: National Hurricane Center. Retrieved February 27, 2024.
  20. National Hurricane Operations Plan (PDF) (Report). Washington, D.C.: NOAA Office of the Federal Coordinator for Meteorological Services and Supporting Research. May 1976. p. 86. Retrieved February 27, 2024.
  21. "Eastern North Pacific Tropical Cyclone Name History". Atlantic Tropical Weather Center. Archived from the original on September 29, 2007. Retrieved February 27, 2024.